Following the release of the Q1’2023 results by Kenyan banks, the Cytonn Financial Services Research Team undertook an analysis on the financial performance of the listed banks and identified the key factors that shaped the performance of the sector. For the earnings notes of the various banks, click the links below:
- Equity Group Q1’2023 Earnings Note
- KCB Group Q1’2023 Earnings Note
- Standard Chartered Bank Kenya Q1’2023 Earnings Note
- ABSA Bank Kenya Q1’2023 Earnings Note
- NCBA Group Q1’2023 Earnings Note
- Co-operative Bank Q1’2023 Earnings Note
- Diamond Trust Bank Kenya (DTB-K) Q1’2023 Earnings Note
- I&M Group Holdings Q1’2023 Earnings Note
- Stanbic Holdings Q1’2023 Earnings Note
- HF Group Q1’2023 Earnings Note
The core earnings per share (EPS) for the listed banks recorded a weighted growth of 25.0% in Q1’2023, compared to a weighted growth of 37.9% recorded in Q1’2022, an indication of sustained performance despite the tough operating environment occasioned by elevated inflationary pressures experienced during the period. The performance in Q1’2023 was supported by a 48.1% growth in non-funded income coupled with a 20.1% growth in net interest income. Additionally, the listed banks continued to implement their revenue diversification strategies, as evidenced by Non-Funded Income (NFI) weighted average growth of 48.1% in Q1’2023 compared to a weighted average growth of 21.4% in Q1’2022. The growth in NFI was largely driven by the increase in foreign exchange income recorded by the banks during the period as a result of increased dollar demand in the country. However, the listed banks’ asset quality deteriorated marginally, with the weighted average NPL ratio increasing by 0.1% points to 12.6% in Q1’2023, from 12.5% in Q1’2022. We note that the NPL ratio still remains higher than the 10-year average of 9.6%.
The report is themed “Sustained Profitability Despite Challenging Business Environment” where we assess the key factors that influenced the performance of the banking sector in Q1’2023, the key trends, the challenges banks faced, and areas that will be crucial for growth and stability of the banking sector going forward. As such, we shall address the following:
- Key Themes that Shaped the Banking Sector Performance in Q1’2023,
- Summary of the Performance of the Listed Banking Sector in Q1’2023,
- The Focus Areas of the Banking Sector Players Going Forward, and,
- Brief Summary and Ranking of the Listed Banks based on the outcome of our analysis.
Section I: Key Themes That Shaped the Banking Sector Performance in Q1’2023
Below, we highlight the key themes that shaped the banking sector in Q1’2023 which include; regulation, regional expansion through mergers and acquisitions, and asset quality:
- Regulation:
- Risk based Lending: Since the repeal of the Interest Cap Law in 2019, the Central Bank of Kenya has been developing a risk-based lending model aimed at pricing loans. The model's primary purpose is to enable banks to lend based on the anticipated risks of each borrower. Furthermore, this represents a shift away from the negative listing of defaulters and toward a new credit score rating system that does not deny borrowers credit based on the quality of their credit bureau reference ratings. The approach targets riskier borrowers, with the majority operating in micro, small, and medium-sized businesses that have struggled to obtain conventional credit. Notably, as of May 2023, 33 of the banks in the country had their models approved by the CBK, with Equity Bank being the first commercial bank to implement risk-based lending. However, the approval process of the models has been gradual in a bid to avoid causing distress to customers through high interest rates. Further, the full deployment has been slowed due to a lack of data to analyse the client's risk profile, and,
- Foreign Exchange Code: The Central Bank of Kenya announced the issuanceof the Foreign Exchange Code (the FX Code) on 22 March 2023 to commercial banks, in a move to regulate wholesale transactions of the foreign exchange market in Kenya. The measure was in response to the wide variation of exchange rate spread in the market, as discussed in our currency review note. The FX Code aims to promote a robust and transparent foreign currency market through the following reporting guidelines;
- Compliance with FX Code- All market participants (commercial banks and foreign exchange brokers) will be required to conduct a self-assessment and submit to the CBK a report on an institution’s level of compliance with the FX Code by 30 April 2023. Further, all market participants will be required to submit to CBK a detailed compliance implementation plan that is approved by its Board by 30 June 2023, and each participant must be fully compliant with the aforementioned code by 31 December 2023,
- Reporting Mechanism- All market participants will be required to submit a quarterly report to CBK, on the level of compliance to the FX Code within 14 days after the end of every calendar quarter, with the first report due by July 14, 2023,
-
-
- In the event of non-compliance, CBK may take appropriate enforcement and other administrative action including monetary penalties as provided for under the Banking Act against any market participant, and,
-
-
-
- Prohibitive Practices- The FX Code is majorly to identify practices that are geared towards market disruptions such as price quotations or manipulating price movements creating artificial delays, or false impression on market depth and liquidity by any market participants will result in heavy penalties. Additionally, market participants are not to engage in position or points parking (artificial transactions to conceal positions or transfer profits or losses).
-
- Regional Expansion through Mergers and Acquisitions: Kenyan banks are continuously looking at having an extensive regional reach and in Q1’2023, there were three completed acquisition done by Commercial International Bank (Egypt) S.A.E (CIB), Equity Group Holdings Plc and Premier Bank Limited Somalia as follows:
- On 30 January 2023, the Central Bank of Kenya (CBK) announcedthat Commercial International Bank (Egypt) S.A.E (CIB) had completed acquisition of additional 49.0% shareholding of Mayfair CIB Bank Limited (MBL) at Kshs 5.0 bn following the earlier acquisition of 51.0% stake in MBL announced in April 2020. As such, MBL is now a fully owned subsidiary of CIB,
- On 31 January 2023, Equity Group Holdings PLc, through Equity Bank Kenya Limited (EBKL) announced that it had completed the acquisition of certain assets and liabilities of the local Bank, Spire Bank Limited after obtaining all the required regulatory approvals. The completion of the acquisition followed the Assets and Liabilities Purchase Agreement, which was announced in September 2022, as highlighted in our Cytonn Weekly #37/2022. As such, Equity Bank Kenya Limited took over Spire Banks’s 12 branches as well as all existing depositors in Spire Bank, other than remaining deposits from its largest shareholder, Mwalimu Sacco. For more information, please see our Cytonn Monthly-January 2023, and,
- On 17 March 2023 the Central Bank of Kenya (CBK) announced that Premier Bank Limited Somalia (PBLS) had completed acquisition of 62.5% shareholding of First Community Bank Limited (FCB) effective 27 March 2023. This came after receiving regulatory approvals from the CBK and the Cabinet Secretary for the National Treasury. FCB, which has been in operation since June 2008, is classified as a tier 3 bank in Kenya with 18 branches and a market share of 0.3% as at December 2022. The acquisition by Premier Bank Limited Somalia (PBLS), came at a time when FCB has been struggling to meet regulatory Capital adequacy requirements. For more information, please see our Cytonn Weekly #11/2023.
The following are Mergers and Acquisitions that happened after Q1’2023:
- On 22 May 2023, the Central Bank of Kenya (CBK) announced the acquisition of 20.0% stake of Credit Bank Plc by Shorecap III, LP a Private Equity fund registered under the laws of Mauritius, with Equator Capital Partners LLC as the managers of the fund. The value of the deal was not disclosed by the CBK, however, Shorecap III, LP will take over 7,289,928 ordinary shares which constitute of 20.0% of the ordinary shares of the Bank. The acquisition came after Oikocredit acquired 22.8% stake of the lender in August 2019, after paying a cash consideration of Kshs 1.0 bn, with the transaction trading at price to book (P/B) multiple of 1.5x. For more information, please see our Cytonn Weekly #21/2023, and,
- On 14 June 2023 Equity Group Holdings Plc (EGH) announced that it had entered into a binding agreement with Government of Rwanda, Rwanda Social Security Board and other investors of Compagnie Generale De Banque (Cogebanque) Plc Limited to acquire a 91.9% stake in the Rwanda based lender. Upon the completion of the acquisition, EGH plans to eventually merge the business of the Cogebanque with its Rwandan Subsidiary, Equity Bank Rwanda Plc. Additionally, EGH intends to make an offer to the remaining shareholders to acquire all the shares in Cogebanque in a move that will make EGH take over 100.0% of the issued shares of Cogebanque.
Below is a summary of the deals in the last 10 years that have either happened, been announced or expected to be concluded:
|
Cytonn Report: Banking sector Deals and Acquisitions |
||||||
|
Acquirer |
Bank Acquired |
Book Value at Acquisition (Kshs bn) |
Transaction Stake |
Transaction Value (Kshs bn) |
P/Bv Multiple |
Date |
|
Equity Group |
Cogebanque PLC ltd |
5.7 |
91.90% |
6.7 |
1.3x |
Jun-23 |
|
Shorecap III |
Credit Bank Plc |
3 |
20.00% |
Undisclosed |
N/A |
Jun-23 |
|
Premier Bank Limited |
First Community Bank |
2.8 |
62.50% |
Undisclosed |
N/A |
Mar-23 |
|
KCB Group PLC |
Trust Merchant Bank (TMB) |
12.4 |
85.00% |
15.7 |
1.5x |
Dec-22 |
|
Equity Group |
Spire Bank |
Unknown |
Undisclosed |
Undisclosed |
N/A |
Sep-22* |
|
Access Bank PLC (Nigeria)* |
Sidian Bank |
4.9 |
83.40% |
4.3 |
1.1x |
June-22* |
|
KCB Group |
Banque Populaire du Rwanda |
5.3 |
100.00% |
5.6 |
1.1x |
Aug-21 |
|
I&M Holdings PLC |
Orient Bank Limited Uganda |
3.3 |
90.00% |
3.6 |
1.1x |
Apr-21 |
|
KCB Group** |
ABC Tanzania |
Unknown |
100% |
0.8 |
0.4x |
Nov-20* |
|
Co-operative Bank |
Jamii Bora Bank |
3.4 |
90.00% |
1 |
0.3x |
Aug-20 |
|
Commercial International Bank |
Mayfair Bank Limited |
1 |
51.00% |
Undisclosed |
N/D |
May-20* |
|
Access Bank PLC (Nigeria) |
Transnational Bank PLC. |
1.9 |
100.00% |
1.4 |
0.7x |
Feb-20* |
|
Equity Group ** |
Banque Commerciale Du Congo |
8.9 |
66.50% |
10.3 |
1.2x |
Nov-19* |
|
KCB Group |
National Bank of Kenya |
7 |
100.00% |
6.6 |
0.9x |
Sep-19 |
|
CBA Group |
NIC Group |
33.5 |
53%:47% |
23 |
0.7x |
Sep-19 |
|
Oiko Credit |
Credit Bank |
3 |
22.80% |
1 |
1.5x |
Aug-19 |
|
CBA Group** |
Jamii Bora Bank |
3.4 |
100.00% |
1.4 |
0.4x |
Jan-19 |
|
AfricInvest Azure |
Prime Bank |
21.2 |
24.20% |
5.1 |
1.0x |
Jan-18 |
|
KCB Group |
Imperial Bank |
Unknown |
Undisclosed |
Undisclosed |
N/A |
Dec-18 |
|
SBM Bank Kenya |
Chase Bank Ltd |
Unknown |
75.00% |
Undisclosed |
N/A |
Aug-18 |
|
DTBK |
Habib Bank Kenya |
2.4 |
100.00% |
1.8 |
0.8x |
Mar-17 |
|
SBM Holdings |
Fidelity Commercial Bank |
1.8 |
100.00% |
2.8 |
1.6x |
Nov-16 |
|
M Bank |
Oriental Commercial Bank |
1.8 |
51.00% |
1.3 |
1.4x |
Jun-16 |
|
I&M Holdings |
Giro Commercial Bank |
3 |
100.00% |
5 |
1.7x |
Jun-16 |
|
Mwalimu SACCO |
Equatorial Commercial Bank |
1.2 |
75.00% |
2.6 |
2.3x |
Mar-15 |
|
Centum |
K-Rep Bank |
2.1 |
66.00% |
2.5 |
1.8x |
Jul-14 |
|
GT Bank |
Fina Bank Group |
3.9 |
70.00% |
8.6 |
3.2x |
Nov-13 |
|
Average |
|
|
75.0% |
|
1.3x |
|
|
Average: 2013 to 2018 |
|
|
73.5% |
|
1.7x |
|
|
Average: 2019 to 2023 |
|
|
75.8% |
|
0.9x |
|
|
* Announcement Date ** Deals that were dropped |
||||||
So far in 2023, the average acquisition valuations for banks have remained unchanged at 1.3x, similar to what was recorded in 2022. As such, the valuations still remain low compared to historical prices paid, as highlighted
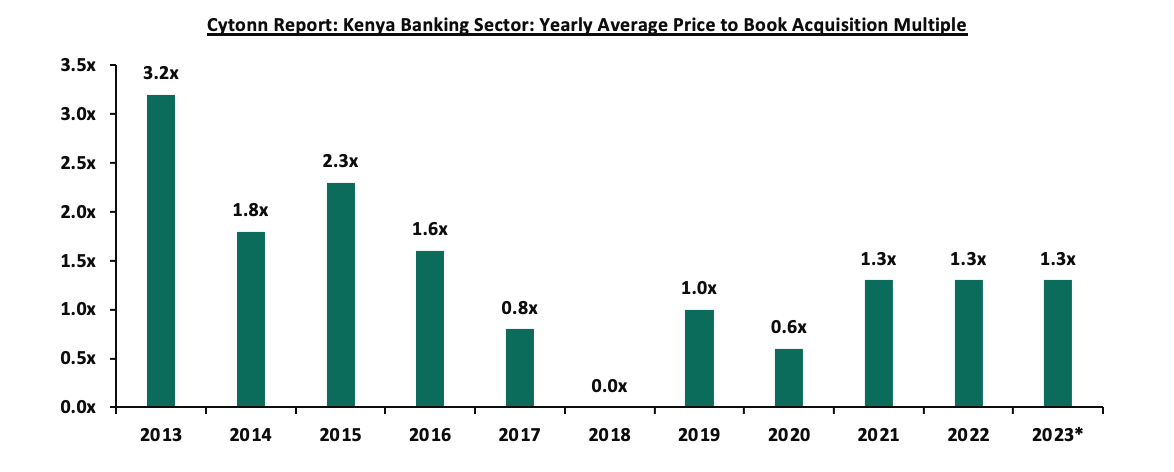
in the chart below;
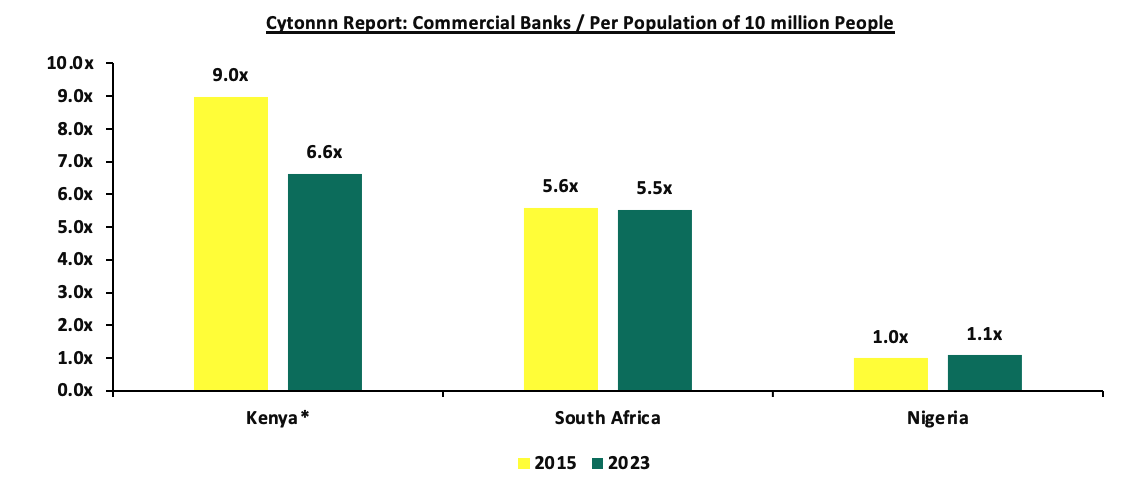
As at the end of Q1’2023, the number of commercial banks in Kenya stood at 38, same as in Q1’2022 but lower than 43 licensed banks in FY’2015. The ratio of the number of banks per 10 million populations in Kenya now stands at 6.6x, which is a reduction from 9.0x in FY’2015 demonstrating continued consolidation in the banking sector. However, despite the ratio improving, Kenya still remains overbanked as the number of banks remains relatively high compared to the African major economies. To bring the ratio to 5.5x, we ought to reduce the number of banks from the current 38 banks to 32 banks. For more on this see our topical.
 Source: World Bank, Central Bank of Kenya, South Africa Reserve Bank, Central Bank of Nigeria;
* Data as of June 2023
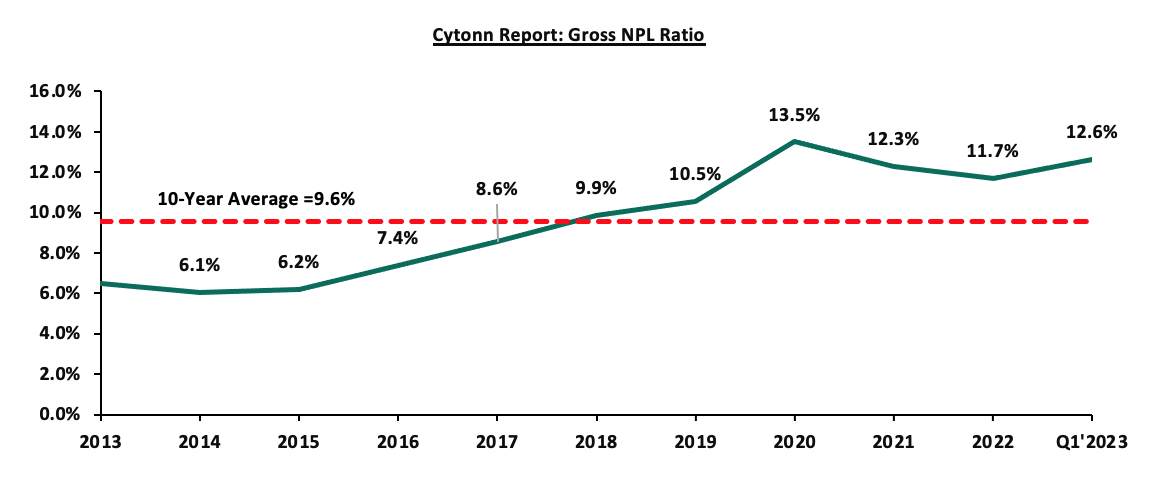
- Asset Quality: Asset quality for listed banks deteriorated marginally in Q1’2023, with the weighted average Gross Non-Performing Loan ratio (NPL) increasing by 0.1% points to 12.6%, from 12.5% recorded in Q1’2022. The performance remained 3.0% points above the ten-year average of 9.6%. The slight deterioration in asset quality in Q1’2023 was mainly driven by 1.8% points increase in ABSA Bank’s NPL ratio to 9.4%, from 7.6% in Q1’2022, coupled with 1.0% points increase in Equity Group NPL ratio to 10.0% from 9.0% in Q1’2022. The deterioration in ABSA Bank asset quality was mainly attributable to a 59.8% increase in gross non-performing loans to Kshs 31.1 bn in Q1’2023, from Kshs 19.5 bn in Q1’2022 which outpaced the 28.1% increase in gross loans to Kshs 329.9 bn from 257.5 bn in Q1’2022. However, the deterioration in listed banks asset quality was mitigated by an improvement in NCBA Group’s Asset quality, with their NPL ratio declining by 3.5% points to 12.8%, from 16.3% in Q1’2022, mainly attributable to 11.9% decrease in Gross non-performing loans to Kshs 39.7 bn, from Kshs 45.1 bn in Q1’2022, coupled with a 12.0% increase in gross loans to Kshs 309.7 bn from Kshs 276.7 bn in Q1’2022. A total of 4 out of the ten listed Kenyan banks recorded improvement in asset quality, despite the deteriorated general business environment which was evidenced by the average Purchasing Managers Index coming at 49.3 in Q1’2023, lower than the average of 50.3 recorded in the same period in 2022. Additionally, according to the May 2023 MPC Press Release, the NPL ratio for the entire banking sector stood at 14.6% in April 2023, 0.5% points increase from 14.1% recorded in April 2022, an indication of further deterioration in the sector’s asset quality. Going forward, we expect credit risk to remain elevated in the short to medium term mainly on the back of tough operating environment occasioned by elevated inflationary pressures as well as sustained depreciation of the Kenya shilling. The chart below highlights the asset quality trend for the listed banks:
The table below highlights the asset quality for the listed banking sector:
|
Cytonn Report: Listed Banks Asset Quality |
||||||
|
|
Q1'2023 NPL Ratio* |
Q1'2022 NPL Ratio** |
% point change in NPL Ratio |
Q1'2023 NPL Coverage* |
Q1'2022 NPL Coverage** |
% point change in NPL Coverage |
|
ABSA Bank Kenya |
9.4% |
7.6% |
1.8% |
63.9% |
76.2% |
(12.3%) |
|
Equity Group |
10.0% |
9.0% |
1.0% |
62.0% |
66.0% |
(4.0%) |
|
I&M Holdings |
10.6% |
10.0% |
0.6% |
65.8% |
72.1% |
(6.3%) |
|
Stanbic Bank |
11.7% |
11.1% |
0.6% |
66.7% |
59.1% |
7.6% |
|
Diamond Trust Bank |
12.3% |
12.6% |
(0.3%) |
45.9% |
42.2% |
3.7% |
|
NCBA Group |
12.8% |
16.3% |
(3.5%) |
56.8% |
72.6% |
(15.8%) |
|
Co-operative Bank of Kenya |
14.1% |
13.9% |
0.2% |
62.2% |
65.3% |
(3.1%) |
|
Standard Chartered Bank Kenya |
14.4% |
15.4% |
(1.0%) |
86.8% |
81.8% |
5.0% |
|
KCB |
17.1% |
16.9% |
0.2% |
57.3% |
52.7% |
4.6% |
|
HF Group |
19.9% |
20.5% |
(0.6%) |
81.4% |
76.1% |
5.3% |
|
Mkt Weighted Average |
12.6% |
12.5% |
0.1% |
63.7% |
65.1% |
(1.4%) |
|
*Market cap weighted as at 15/06/2023 |
||||||
|
**Market cap weighted as at 17/06/2022 |
||||||
Key take-outs from the table include;
- Asset quality for the listed banks deteriorated marginally during the period, with the market-weighted average NPL ratio increasing by 0.1% points to 12.6%, from 12.5% in Q1’2022. The deterioration was largely driven by deterioration in ABSA Bank’s and Equity Group’s asset quality with their NPL ratios increasing by 1.8% and 1.0% points to 9.4% and 10.0%, from 7.6% and 9.0%, respectively recorded in Q1’2022
- ABSA Bank had the highest NPL Ratio jump by 1.8% points to 9.4% in Q1’2023 from 7.6% in Q1’2022, attributable to a 59.8% increase in gross non-performing loans to Kshs 31.1 bn in Q1’2023 from Kshs 19.5 bn in Q1’2022 which outpaced the 28.1% increase in gross loans to Kshs 329.9 bn in Q1’2023 from 257.5 bn in Q1’2022,
- NCBA Group recorded the highest improvement in its asset quality with the NPL ratio declining by 3.5% points to 12.8% from 16.3% recoded in Q1’2022. The improvement in asset quality was mainly attributable to an 11.9% decline in gross non-performing loans to Kshs 39.7 bn in Q1’2023 from Kshs 45.1 bn in Q1’2022, coupled with a 12.0% increase in gross loans to Kshs 309.7 bn in Q1’2023 from 276.7 bn in Q1’2022, and,
- Market weighted average NPL Coverage for the listed banks declined by 1.4% points to 63.7% in Q1’2023, from 65.1% recorded in Q1’2022. The decrease was mainly attributable to decrease in NCBA Group’s, ABSA Bank’s, Equity Group’s and I&M Group’s NPL coverage by 15.8%, 12.3% and 6.3% points to 56.8%, 63.9% and 65.8%, from 72.6%, 76.2% and 72.1%, respectively in Q1’2022
Section II: Summary of the Performance of the Listed Banking Sector in Q1’2023:
The table below highlights the performance of the banking sector, showing the performance using several metrics, and the key take-outs of the performance;
|
Cytonn Report: Listed Banks Performance in Q1’2023 |
|||||||||||||
|
Bank |
Core EPS Growth |
Interest Income Growth |
Interest Expense Growth |
Net Interest Income Growth |
Net Interest Margin |
Non-Funded Income Growth |
NFI to Total Operating Income |
Growth in Total Fees & Commissions |
Deposit Growth |
Growth in Government Securities |
Loan to Deposit Ratio |
Loan Growth |
Return on Average Equity |
|
HF Group |
143.5% |
15.1% |
9.1% |
21.0% |
5.0% |
8.7% |
30.4% |
(29.7%) |
7.4% |
31.4% |
89.7% |
6.2% |
3.8% |
|
Stanbic Bank |
84.3% |
49.1% |
59.7% |
44.7% |
7.2% |
89.3% |
51.4% |
17.7% |
23.8% |
9.7% |
79.1% |
11.5% |
20.7% |
|
Absa Bank |
50.7% |
38.3% |
46.8% |
36.0% |
8.3% |
49.3% |
32.5% |
29.7% |
15.3% |
(1.8%) |
99.7% |
27.7% |
25.5% |
|
NCBA Group |
48.5% |
21.0% |
25.2% |
18.0% |
6.0% |
18.5% |
46.2% |
9.1% |
7.3% |
6.4% |
57.5% |
17.7% |
18.4% |
|
SCBK |
45.7% |
34.1% |
(5.4%) |
40.1% |
7.3% |
55.5% |
35.9% |
13.3% |
14.2% |
(6.2%) |
45.3% |
7.0% |
23.0% |
|
DTBK |
11.3% |
32.1% |
49.2% |
20.7% |
5.4% |
59.1% |
29.6% |
26.5% |
17.9% |
3.1% |
66.8% |
20.3% |
9.1% |
|
Equity Bank |
7.9% |
21.6% |
46.9% |
12.1% |
7.4% |
54.3% |
45.9% |
39.2% |
23.3% |
(7.7%) |
68.1% |
21.3% |
26.8% |
|
Coop Bank |
4.7% |
11.2% |
32.2% |
3.9% |
8.5% |
10.8% |
39.7% |
9.7% |
2.2% |
(2.3%) |
85.8% |
11.0% |
20.7% |
|
KCB Group |
(1.0%) |
26.2% |
67.7% |
11.8% |
7.3% |
59.2% |
40.1% |
65.5% |
41.5% |
4.8% |
77.6% |
31.9% |
20.9% |
|
I&M Holdings |
(2.0%) |
18.3% |
20.2% |
17.0% |
6.3% |
58.8% |
36.4% |
16.6% |
4.9% |
(13.3%) |
79.4% |
18.0% |
14.4% |
|
Q1'23 Mkt Weighted Average* |
25.0% |
26.2% |
40.2% |
20.1% |
7.3% |
48.1% |
41.3% |
30.0% |
19.0% |
(1.2%) |
73.1% |
19.6% |
22.1% |
|
Q1'22 Mkt Weighted Average** |
37.9% |
17.8% |
17.1% |
17.7% |
7.3% |
21.4% |
35.9% |
21.7% |
9.5% |
17.6% |
73.9% |
17.2% |
21.9% |
|
*Market cap weighted as at 15/06/2023 |
|||||||||||||
|
**Market cap weighted as at 17/06/2022 |
|||||||||||||
Key takeaways from the table include:
- Listed banks recorded a 25.0% growth in core Earnings per Share (EPS) in Q1’2023, compared to the weighted average growth of 37.9% in Q1’2022, an indication of sustained performance despite the tough operating environment experienced in Q1’2023 on the back of elevated inflationary pressures. The performance during the period was mainly supported by a 48.1% weighted average growth in non-funded income, coupled with a 20.1% weighted average growth in net interest income,
- The listed banks continued to implement their revenue diversification strategies, as evidenced by non-funded income weighted average growth of 48.1% in Q1’2023 compared to a weighted average growth of 21.4% in Q1’2022. The performance was largely supported by the increase in foreign exchange income recorded by the banks during the period as a result of increased dollar demand in the country,
- Listed banks investments in government securities slowed down in Q1’2023, having recorded a market weighted average decline of 1.2% compared to a 17.6% growth recorded in Q1’2022. The slowed growth of investment in Kenya government securities is partly attributable to the increased perceived risk of default by the government, mainly on the back of high debt sustainability concerns given the current high public debt stock as well as the upcoming Eurobond maturity in June 2024,
- The listed banks Net loans and advances to customers recorded a weighted average growth of 19.6% in Q1’2023 compared to 17.2% in Q1’2023, an indication of increased lending despite the elevated credit risk,
- Interest income recorded a weighted average growth of 26.2% in Q1’2023, compared to 17.8% in Q1’2022. Similarly, interest expenses recorded a market weighted average growth of 40.2% in Q1’2023 compared to a growth of 17.1% in Q1’2022. As such, net interest income recorded a weighted average growth of 20.1% in Q1’2022 compared to 17.7% in Q1’2022,
- The listed banks recorded a 22.1% weighted average growth on return on average equity (RoaE), 0.2% higher than the 21.9% growth recorded in Q1’2022. Additionally, the entire banking sector’s Return On Equity (ROE) recorded9% points increase to 27.0% in Q1’2023, from 25.1% recorded in Q1’2022. As such, the Kenyan banking sector continues to record high profitability compared to other economies in the world, as highlighted in the chart below:
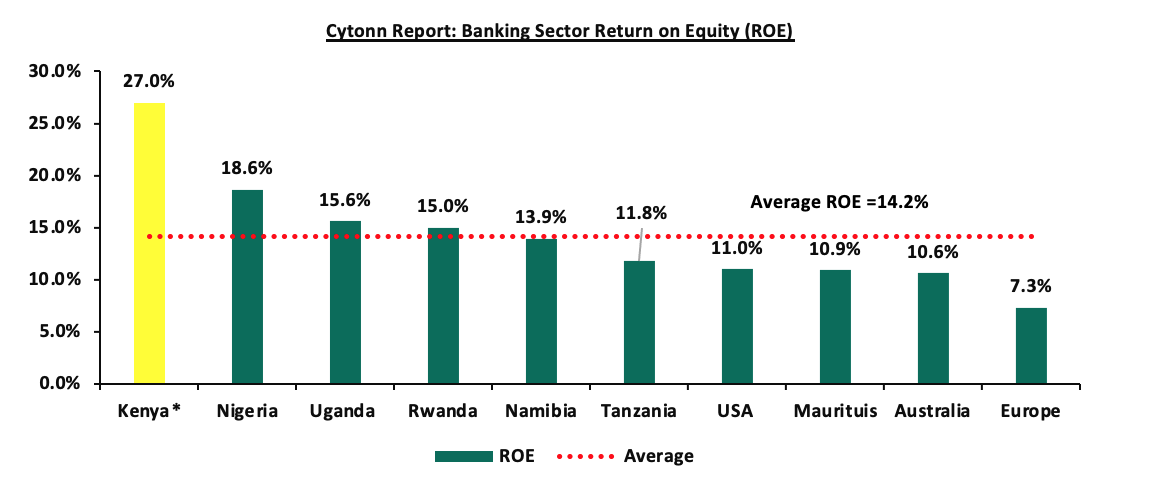
Source: Online research, * Figure as of Q1’2023
Section III: Outlook of the banking sector:
The banking sector continued to showcase sustained performance despite the tough operating environment occasioned by elevated inflationary pressures, as evidenced by the increase in their profitability, with the Core Earnings Per Share (EPS) growing by 25.0%, majorly supported by the Non-Funded income as banks continued to implement their revenue diversification strategies. However, in the short to medium term, we expect profitability to be weighed down by the expected increase in provisioning aimed at cushioning banks from the elevated credit risk arising from the deteriorated business environment. As such, we expect the future performance of the banking sector to be mainly supported by the following key factors:
- Regional Expansion and Further Consolidation: Consolidation remains a key theme going forward, with the current environment offering opportunities for well-capitalized banks to expand and take advantage of the market's low valuations, as well as further consolidate out smaller and less-capitalized banks. Notably, the majority of the bigger banks have continued to cushion unsystematic risks specific to the local market by expanding their operations into other African nations. Banks such as KCB and Equity Group have been leveraging expansion and consolidation, which has largely contributed to their increased asset base as well as earnings growth. As such, we expect to see a continued expansion trend aimed at revenue optimization. Additionally, the Ethiopian government opened up the financial sector to foreign investors, which provides a great opportunity for Kenyan banks to expand their operations into this untapped market,
- Revenue Diversification: In Q1’2023, non-funded income (NFI) recorded a 48.1% weighted average growth compared to a 21.4% weighted growth in Q1’2023, with many banks diversifying their revenue sources. Consequentially, the weighted average contribution of NFI to total operating income came in at 41.3% in Q1’2023, 5.4% points higher than the 35.9% weighted average growth contribution recorded in Q1’2022. As such, there exists an opportunity for the sector to further increase NFI contributions to revenue given the continuous adoption of digitization. Additionally, the reinstatement of charges for transactions between bank accounts and mobile money wallets is also expected to continue spurring NFI growth due to the increased adoption of digital channels, and,
- Growth in Interest income: Going forward, we expect interest income growth to remain a key driver in the banking industry, as evidenced by the weighted average growth of 26.2% in Q1’2023, compared to 17.8% recorded in Q1’2022. Additionally, the continued approval of banks risk-based lending models will enable banks to effectively price their risk, expand loan books, and consequently increase their interest income.
Section IV: Brief Summary and Ranking of the Listed Banks:
As per our analysis of the banking sector from a franchise value and a future growth opportunity perspective, we carried out a comprehensive ranking of the listed banks. For the franchise value ranking, we included the earnings and growth metrics as well as the operating metrics shown in the table below in order to carry out a comprehensive review of the banks:
|
Cytonn Report: Listed Banks Earnings, Growth and Operating Metrics |
||||||||
|
Bank |
Loan to Deposit Ratio |
Cost to Income (With LLP) |
Return on Average Capital Employed |
Deposits/ Branch (bn) |
Gross NPL Ratio |
NPL Coverage |
Tangible Common Ratio |
Non-Funded Income/Revenue |
|
Absa Bank |
99.7% |
53.7% |
10.1% |
3.7 |
9.4% |
63.9% |
13.1% |
32.5% |
|
NCBA Group |
57.5% |
58.9% |
7.6% |
4.8 |
12.8% |
56.8% |
13.2% |
46.2% |
|
Equity Bank |
68.1% |
57.9% |
9.6% |
3.1 |
10.0% |
62.0% |
11.2% |
45.9% |
|
KCB Group |
77.6% |
62.4% |
7.1% |
2.0 |
17.1% |
57.3% |
11.6% |
40.1% |
|
SCBK |
45.3% |
47.6% |
9.7% |
9.5 |
14.4% |
86.8% |
14.5% |
35.9% |
|
Coop Bank |
85.8% |
54.9% |
7.6% |
2.3 |
14.1% |
62.2% |
16.9% |
39.7% |
|
Stanbic Bank |
79.1% |
50.7% |
10.5% |
9.7 |
11.7% |
66.7% |
14.2% |
51.4% |
|
DTBK |
66.8% |
61.7% |
5.1% |
3.1 |
12.3% |
45.9% |
13.0% |
29.6% |
|
I&M Holdings |
79.4% |
63.0% |
4.7% |
3.9 |
10.6% |
65.8% |
15.5% |
36.4% |
|
HF Group |
89.7% |
90.0% |
1.1% |
1.8 |
19.9% |
81.4% |
14.5% |
30.4% |
|
Weighted Average Q1’2023 |
73.1% |
56.7% |
8.5% |
4.3 |
12.6% |
63.7% |
13.2% |
41.3% |
|
Market cap weighted as at 15/06/2023 |
||||||||
The overall ranking was based on a weighted average ranking of Franchise value (accounting for 60.0%) and intrinsic value (accounting for 40.0%). The Intrinsic Valuation is computed through a combination of valuation techniques, with a weighting of 40.0% on Discounted Cash-flow Methods, 35.0% on Residual Income and 25.0% on Relative Valuation, while the Franchise ranking is based on banks operating metrics, meant to assess efficiency, asset quality, diversification, and profitability, among other metrics. The overall Q1’2023 ranking is as shown in the table below:
|
Cytonn Report: Listed Banks Q1’2023 Rankings |
|||||
|
Bank |
Franchise Value Rank |
Intrinsic Value Rank |
Weighted Rank |
Q1’2022 |
Q1’2023 |
|
Equity Group Holdings Ltd |
5 |
1 |
2.6 |
1 |
1 |
|
ABSA Bank |
3 |
3 |
3.0 |
5 |
2 |
|
Co-operative Bank of Kenya Ltd |
2 |
5 |
3.8 |
4 |
3 |
|
KCB Group Plc |
7 |
2 |
4.0 |
2 |
4 |
|
NCBA Group Plc |
8 |
4 |
5.6 |
6 |
5 |
|
Stanbic Bank/Holdings |
1 |
9 |
5.8 |
8 |
6 |
|
I&M Holdings |
4 |
8 |
6.4 |
3 |
7 |
|
SCBK |
6 |
7 |
6.6 |
7 |
8 |
|
DTBK |
9 |
6 |
7.2 |
9 |
9 |
|
HF Group Plc |
10 |
10 |
10.0 |
10 |
10 |
Major Changes from the Q1’2023 Ranking are:
- ABSA Bank’s rank improved to position 2 in Q1’2023 from position 5 in Q1’2022, majorly driven by a strong franchise score driven by improvement in the bank’s management quality, with the cost to income ratio with LLPs declining by 2.9% to 53.7% in Q1’2023, from 56.6% in Q1’2022. Similarly, the cost to income ratio without LLPs declined by 8.3% points to 36.3% in Q1’2023, from 44.6% in Q1'2022,
- NCBA Group’s rank improved to position 5 in Q1’2023, from position 6 in Q1’2022, mainly attributable to a 3.5% points decline in the group’s NPL ratio to 12.8% from 16.3% recorded in Q1’2022, as well as an increase in the group’s return on average equity to 18.4%, from 14.0% in Q1’2022. Additionally, the group’s net interest margin increased to 6.0%, from the 5.7% recorded in Q1’2022,
- I&M Group’s rank declined to position 7 in Q1’2023, from position 3 in Q1’2022, mainly due to a deterioration in the group’s asset quality as the gross NPL ratio rose to 10.6%, from the 10.0% recorded in Q1’2022. Additionally, there was a deterioration in operating efficiency, with the cost-to income ratio with LLPs increasing by 11.0% points to 63.0% from 52.0% recorded in Q1’2022, while the cost-to ratio without LLPs also increased by 0.3% to 45.8% from 45.5% in Q1’2022, and,
- KCB Group’s rank declined to position 4 in Q1’2023, from position 2 in Q1’2022, mainly due to a deterioration in management quality, with the cost-to income ratio with LLPs increasing by 10.7% points to 62.4% from 51.7% recorded in Q1’2022, while the cost-to income without LLP also increased by 6.7% to 51.2% from 44.5% in Q1'2022. Additionally, the Group’s asset quality deteriorated with the NPL ratio increasing to 17.1%, from 16.9% recorded in Q1’2022.
For more information, see our Cytonn Q1’2023 Listed Banking Sector Review
Disclaimer: The views expressed in this publication are those of the writers where particulars are not warranted. This publication is meant for general information only and is not a warranty, representation, advice or solicitation of any nature. Readers are advised in all circumstances to seek the advice of a registered investment advisor.


