In 2022, we published the Nairobi Metropolitan Area Serviced Apartments Report 2022, which highlighted that serviced apartment’s average rental yield grew by 0.7% points to 6.2% in 2022, from 5.5% recorded in 2021. This was attributed to an increase in average monthly charges per SQM by 6.6% to Kshs 2,716 per SQM, from Kshs 2,549 per SQM recorded in 2021, coupled with an increase in occupancy levels by 4.3% to 65.8% in 2022, from 61.5% recorded in 2021. The improvement in performance was attributable to increased demand for hospitality facilities and services as a result of the reopening of the economy, the return of international flights, and the improved rent collection amounts by serviced apartments that had previously been issuing discounts to attract and maintain clients. This year, we update our report using 2023 market research data and by focusing on;
- Overview of the Kenyan Hospitality Sector,
- Introduction to Serviced Apartments,
- Supply and Distribution of Serviced Apartments within the NMA,
- Performance of Serviced Apartments in the NMA,
- Serviced Apartments Performance by Node
- Comparative Analysis - 2022/2023 Market Performance
- Performance per Typology
- Recommendations and Outlook.
Section I: Overview of the Kenyan Hospitality Sector
In 2023, the Kenyan hospitality sector continues its path to recovery and expansion, demonstrating resilience and adaptability despite ongoing global challenges. Building on the momentum of the previous year, the sector has witnessed significant growth and transformation, driven by various factors contributing to its resurgence. The hospitality sector's recovery from the aftermath of the pandemic persists as one of the noteworthy highlights. Following the tumultuous period induced by COVID-19, 2022 marked a significant rebound, with 2023 showcasing a sustained trajectory of improvement. Key performance indicators, including hotel occupancy rates, international arrivals, and sectoral contribution to the economy, have displayed promising upward trends.
In terms of international arrivals, Kenya National Bureau of Statistics’ Leading Economic Indicators – September 2023 report highlighted that arrivals through Jomo Kenyatta International Airport (JKIA) and Moi International Airport (MIA) registered an increase of 13.3% to 317,196 visitors in Q2’2023 from 279,981 visitors in Q2’2022. This is was a result of i) increased international marketing of Kenya’s tourism market by the Ministry of Tourism in collaboration with the Kenya Tourism Board, through platforms such as the Magical Kenya platform, ii) the tourism board alignment of its marketing initiatives towards targeting emerging and established source markets, iii) concerted efforts to promote local and regional tourism, iv) development of niche products such as cruise tourism, adventure tourism, culture and sports tourism and, iv) an increase in corporate and business Meetings, Events, and Conferences (MICE) from both the public and private sectors. For the months of July and August 2023, the number of international visitors arriving through Jomo Kenyatta (JKIA) and Moi International Airports (MIA) came in at a cumulative 316,193 persons, representing a significant 34.0% increase, compared to the 235,982 visitors recorded during a similar period in 2022. The graph below shows the number of international arrivals in Kenya between Q1’2020 and Q2’2023;
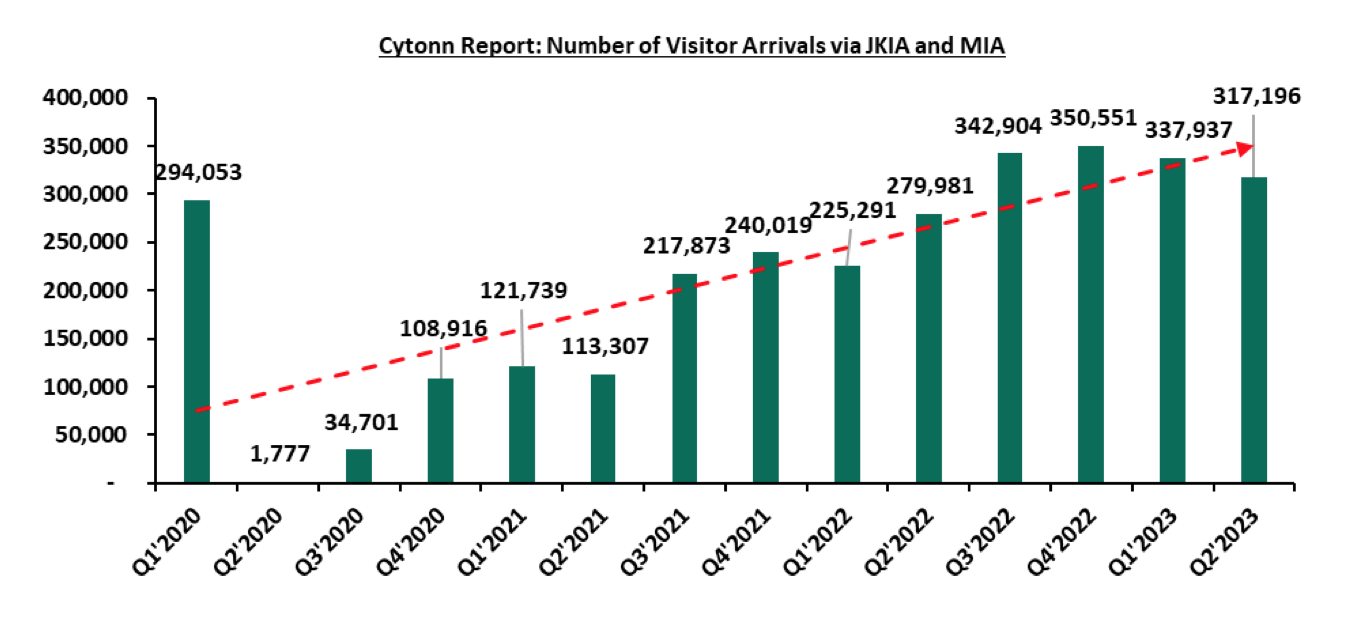
Source: Kenya National Bureau of Statistics
Some of the factors that continue to cushion the hospitality sector include;
- Retraction of all Travel Restrictions: The retraction of pandemic-related travel restrictions, both domestically and globally, remains a cornerstone for the sector's revitalization. The restoration of international connectivity and a conducive travel environment have contributed to increased tourist arrivals and operational activities within the country,
- Hosting Global Sports Events: Kenya has continued to host various events such as the World Rally Championship (WRC) held in mid-2023, and still expected to be hosted annually until 2026, and the World Freestyle Football Championship 2023. These events continue to boost visitor arrivals, hotel bookings and the general performance of the hospitality industry,
- Rich Tapestry of Tourist Attractions: Kenya's diverse and captivating array of tourist attractions, encompassing wildlife reserves, cultural heritage sites, and breathtaking landscapes, continues to captivate travelers worldwide. These include; Kenya’s Lake System, Lake Turkana National Park, Mijikenda Kaya Forests, Mount Kenya National Park, Lamu Old Town, and, Fort Jesus. Preservation efforts, coupled with innovative experiential offerings, have sustained their allure, enticing visitors seeking authentic and immersive experiences,
- Positive Accolades for the Hospitality Industry: The garnering of prestigious industry accolades has elevated Kenya's standing in the global hospitality sphere. These events serve as magnets for visitors while concurrently enhancing the country's reputation as an alluring destination for both leisure and business travelers. Some of these accolades in 2023 included; the 30th World Travel Awards and 17th World Luxury Hotel Awards. Furthermore, Kenya was voted as Africa's Leading Destination at the 2023 World Travel Awards. This is as Nairobi and Diani emerged as Africa’s top destinations in leading business travel and beach destinations respectively,
- Peaceful Post-Electioneering Period: In spite of the uncertain political environment in the run up to the August 2022 General Elections, the country remained calm post-election. Additionally, Kenya had a smooth government transition within 2022 leading to a sense of security and stability during 2023. This encouraged both domestic and international visitors to engage more confidently with the country,
- Aggressive Marketing of Kenya’s Hospitality Industry: The proactive role of the government in advocating and promoting Kenya as a premier tourism destination has been instrumental. This has taken shape such as through the annual Magical Kenya Travel Expo held in the KICC and organized by the Kenya Tourism Board. In addition, strategic investments in infrastructure, targeted promotional campaigns, and collaborative efforts to attract a diverse range of domestic and international tourists have significantly bolstered the industry, and,
- Regional Expansion Drive by Market Players: The hospitality sector has seen continued expansions, signifying investor appetite and confidence in a bid to gain market dominance on the back of the recovery of domestic and international travel. In 2023, there has been expansions by international hotel chains and hospitality brands such as such as JW Marriott of the Bonvoy Global, Pan Pacific Hotels Group and Miftah Concierge into Kenya. In addition, there are 25 new hotels in the development pipeline during 2023, an increase from 24 hotels that were established in 2022, according to the Hotel Chain Development Pipeline Africa 2023 report. These expansionary efforts are expected to further cushion the performance of the sector.
Nevertheless, the sector continues to face challenges, mainly;
- Increased Costs of Operation: The burgeoning operational costs during 2023 have posed challenges in maintaining competitive pricing without compromising on service quality and profitability. This is due to a number of factors, including the rising cost of inputs caused by elevated inflationary pressures, coupled with continued depreciation of the Kenyan shilling against the US dollar. On a year-to-date basis, the shilling has depreciated by 23.8% against the US dollar, adding to the 9.0% depreciation recorded in 2022. As a result, the prices of crucial inputs have increased thereby reducing profit margins for service providers in the sector, and,
- Lack of Proactive Reputational Management: During crises, Kenya is vulnerable to travel warnings advising against travel into the country, which lead to reduced international arrivals. Additionally, there is currently no dedicated strategy by the government to pre-emptively manage this reputational risk in existence. As a result, the hospitality industry may continue to face setbacks when foreign governments issue these advisories.
Section II: Introduction to Serviced Apartments
Serviced apartments are fully furnished residences available for short-term or extended stays, and have solidified their place within the vibrant hospitality landscape of the Nairobi Metropolitan Area. They encompass a spectrum of amenities and services, resembling the comforts of home combined with hotel-like conveniences. These accommodations typically feature spacious living areas, fully equipped kitchens, separate bedrooms, and en-suite facilities, providing guests with a self-sufficient and flexible living environment. In 2023, these establishments continue to redefine the hospitality experience by catering to a diverse range of guests, including business travelers, families, digital nomads, and leisure tourists, offering tailored experiences to suit individual needs. The appeal of serviced apartments lies in their unique offerings and advantages that include:
- Flexibility and Space: These accommodations provide more space than traditional hotel rooms, offering separate living, dining, and sleeping areas. This flexibility appeals to guests seeking a comfortable and homely environment during their stay,
- Personalized Services: Serviced apartments offer a range of services such as housekeeping, concierge, and even customized amenities, catering to the specific needs and preferences of guests,
- Technological Integration: The integration of advanced technologies within these apartments, including smart home features and user-friendly apps, enhances guest convenience and control over their stay,
- Integration with Local Communities: Often situated within or near residential neighbourhoods, serviced apartments allow guests to immerse themselves in the local culture, fostering a sense of belonging and community integration, and,
- Long-term Stay Options: As the trend toward extended stays and remote work continues, serviced apartments offer appealing options for guests seeking longer-term accommodations, complete with dedicated workspaces and amenities conducive to extended stays.
Section III: Supply and Distribution of Serviced Apartments in the Nairobi Metropolitan Area
The number of serviced apartments within the Nairobi Metropolitan Area (NMA) has increased by an 8-Year CAGR of 8.6% to 6,627 apartments in 2023, from 3,414 apartments in 2015. Notable serviced apartments facilities brought into the market in 2023 included the 100-room Dusit Princess Residences located in Westlands, and Somerset Rosslyn Nairobi by Ascott Limited, a 150-unit development in Runda which is set to be launched in December 2023. The table below shows the growth in supply of serviced apartments in the Nairobi Metropolitan Area over the last five years;
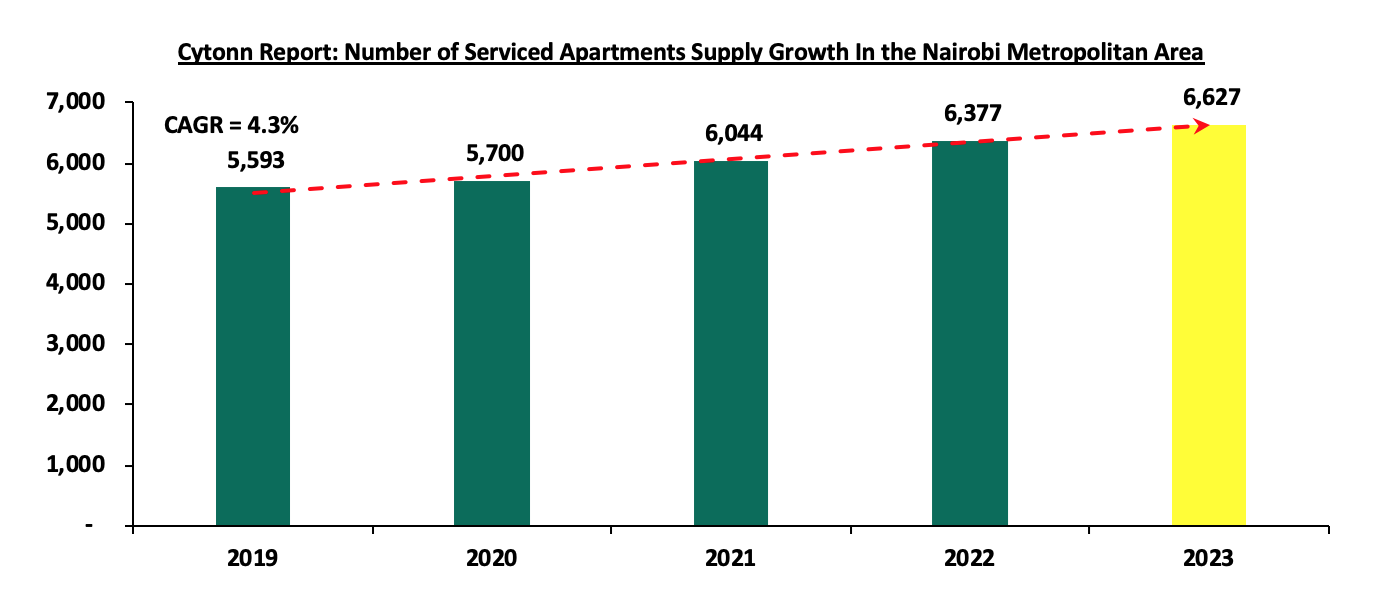
Source: Cytonn Research
In terms of distribution, Westlands and Kilimani have the largest market share of serviced apartments within the Nairobi Metropolitan Area, at 37.8% and 25.6%, respectively attributable to;
- A growing influx of international organizations aiming to bolster their footprint in Africa, exemplified by entities such as Price Water Coopers Kenya Headquarters, United Nations agencies, and numerous embassies. This trend contributes to an expanding customer base of expatriates, thereby increasing the demand for serviced apartments,
- The presence of premium serviced apartments commanding higher rents and rental yields, instilling confidence among investors in the region,
- Enhanced infrastructural connectivity by projects such as the Nairobi Expressway facilitating seamless connections to and from Jomo Kenyatta International Airport (JKIA) and relatively good road network simplifying accessibility from various key locations, and,
- Abundant social amenities, including shopping malls, and efficiently organized delivery service companies in the surrounding areas.
The table provided below illustrates the market share of serviced apartments in the Nairobi Metropolitan Area in 2023;
|
Cytonn Report: Nairobi Metropolitan Area (NMA) Serviced Apartments Market Share 2023 |
|
|
Area |
Percentage Market Share |
|
Westlands |
37.8% |
|
Kilimani |
25.6% |
|
Lavington-Kileleshwa |
11.1% |
|
Upperhill |
7.8% |
|
Limuru Road |
7.8% |
|
Thika Road |
5.5% |
|
Nairobi CBD |
4.4% |
|
Total |
100.0% |
Source: Cytonn Research
For the projects in the pipeline, serviced apartments and hotels with serviced apartments’ concepts currently under development in the Nairobi Metropolitan Area currently include;
|
Cytonn Report: NMA Serviced Apartments Projects in the Pipeline 2023 |
|||
|
Name |
Location |
Number of Rooms |
Estimated Completion Date |
|
MGallery |
Gigiri |
105 |
2024 |
|
Hyatt Regency |
Westlands |
72 |
2024 |
|
Total |
|
17 |
|
Source: Online Research
Section IV: Performance of Serviced Apartments in the Nairobi Metropolitan Area
In the development of the report, the performance of seven nodes within the Nairobi Metropolitan Area was tracked, and compared to the performance in 2022, with emphasis on the following metrics;
- Charged Rates: It is the daily, weekly and monthly rates that are charged to guests for serviced apartments in specific markets. This which form the basis for evaluation of the likely rental income to be received by investors in serviced apartments,
- Occupancy Rates: It measures the number of inhabited apartments as a percentage of the total number of units available. It also guides in determining the expected rental yields for various developments, and,
- Rental Yields: It measures the Real Estate investment return from the annualized collected rental income. It provides investors with an estimate of the returns expected from the property, as well as the time it will take to recover the investment. In the calculation of rental yields, we estimate annual income from monthly revenues and deduct operational costs (assumed as 40.0% of revenues).
In the estimations for the investment value, we have calculated development costs per SQM through factoring in land costs (location-based), costs of construction, equipping costs, professional fees and other costs relating to development. The formula thus used in the calculation rental yields is as follows;

It is important to note that investors will generally incur varying costs depending on the actual land costs incurred, the plot ratios, and the level of finishing and equipping. In analyzing performance, we will start by the node during the year, followed by a comparison with 2022 then the performance by typology will then be covered;
- Serviced Apartments Performance by Node
The average rental yield for serviced apartments within the NMA increased by 0.6% points to 6.8% in 2023 from 6.2% in 2022. Westlands and Limuru Road emerged the best performing nodes, with rental yields of 10.2% and 8.2% respectively, compared to the market average of 6.8%. The performance was attributed to, i) the proximity of the nodes to international organizations and embassies concentrated within their bounds which has continued to drive the demand for serviced apartments in the nodes upward, owing to a high influx of foreign nationals and expatriates, ii) presence of high quality serviced apartments available in the nodes which attract premium rates, iii) the ease of accessing the areas through well-developed infrastructure road networks, and, iv) their relative closeness to the Nairobi CBD and other upscale neighborhoods. On the other hand, Thika Road was the least performing node, with an average rental yield of 4.1%, 2.7% points lower than the market average of 6.8%. The performance is attributed to, i) the relatively low charge rates for apartments in the node, ii) the low demand for its serviced apartments caused by their unpopularity, iii) the long commute to main commercial zones, and, iv) reduced monthly charges in the area compared to last year, as landlords continued to offer discounts in efforts meant to attract customers and improve occupancy rates. The table below highlights the performance of the various nodes within the NMA;
|
Cytonn Report: NMA Serviced Apartments Performance per Node - 2023 |
||||||||
|
Node |
Studio |
1 Bed |
2 Bed |
3 bed |
Monthly Charge/ |
Occupancy |
Devt Cost/SQM (Kshs) |
Rental Yield |
|
SQM (Kshs) |
||||||||
|
Westlands |
193,633 |
271,362 |
340,190 |
359,563 |
4,059 |
74.2% |
209,902 |
10.2% |
|
Limuru Road |
6,271 |
236,265 |
329,655 |
271,105 |
4,699 |
58.1% |
231,715 |
8.2% |
|
Kilimani |
187,980 |
258,288 |
309,200 |
468,883 |
3,229 |
66.5% |
202,662 |
7.7% |
|
Kileleshwa & Lavington |
120,000 |
284,231 |
230,204 |
400,495 |
2,844 |
71.5% |
206,132 |
7.2% |
|
Upperhill |
187,000 |
335,951 |
360,400 |
2,309 |
65.8% |
209,902 |
5.2% |
|
|
Nairobi CBD |
120,000 |
167,140 |
254,875 |
300,000 |
2,539 |
57.5% |
224,571 |
4.9% |
|
Thika Road |
92,975 |
1,444 |
1,312 |
1,632 |
70.6% |
200,757 |
4.1% |
|
|
Average |
125,577 |
213,894 |
257,360 |
308,823 |
3,045 |
66.3% |
212,234 |
6.8% |
Source; Cytonn Research
- Comparative Analysis - 2022/2023 Market Performance
The performance of the serviced apartments improved slightly y/y, with the occupancy rates coming in at 66.3% in 2023, a 0.5%-points increase from the 65.8% recorded in 2022. This was lower than 2022, where occupancy rates improved by 4.3% points to 65.8% from the 61.5% recorded in 2021. The slower growth is ascribed to tough economic challenges occasioned by rising inflation, which continues to eroded the purchasing power of consumers. As a result, this has curtailed the expenditures of a majority of potential clients, as they have had to cut back on spending, prioritizing essential spending only.
The average monthly charges for 2023 increased to Kshs 3,045 per SQM from Kshs 2,716 per SQM recorded in 2022, representing a 10.9% increase. This was attributed to increased costs of operations on the back of rising costs of essential commodities, electricity, fuel costs and energy. Consequently, the average rental yield increased to 6.8% in 2023, a 0.6%-points increase from the 6.2% recorded in 2022. The improvement in performance was primarily on the back of; i) growing popularity of Nairobi as a business destination, having being voted as Africa’s leading business travel destination in the 2023 World Travel Awards, ii) continued recovery of the Kenyan hospitality sector, iii) increased number of international tourist arrivals into the country as compared to a similar period in 2022, iv) the intensive marketing of Kenya’s tourism market through platforms such as the Magical Kenya platform among others, and, v) the sustained preference by various guests for extended stay options within the city. The table below shows the comparative analysis between 2022 and 2023;
|
All values in Kshs unless stated otherwise |
|||||||||
|
Cytonn Report: Comparative Analysis-2022/2023 Market Performance |
|||||||||
|
Node |
Monthly Charge/SQM 2022 |
Occupancy 2022 |
Rental Yield 2022 |
Monthly Charge/SQM 2023 |
Occupancy 2023 |
Rental Yield 2023 |
Change in Monthly Charges/SQM |
Change in Occupancy |
Change in Rental Yield |
|
Westlands |
3,916 |
70.7% |
9.3% |
4,059 |
74.2% |
10.2% |
3.7% |
3.5% |
0.9% |
|
Limuru Road |
2,976 |
60.6% |
5.8% |
4,699 |
58.1% |
8.2% |
57.9% |
(2.5%) |
2.4% |
|
Kilimani |
2,937 |
69.3% |
7.2% |
3,229 |
66.5% |
7.7% |
9.9% |
(2.8%) |
0.5% |
|
Kileleshwa & Lavington |
2,811 |
66.3% |
6.6% |
2,844 |
71.5% |
7.2% |
1.2% |
5.2% |
0.6% |
|
Upperhill |
2,225 |
65.4% |
5.0% |
2,309 |
65.8% |
5.2% |
3.8% |
0.4% |
0.2% |
|
Nairobi CBD |
2,348 |
66.2% |
5.2% |
2,539 |
57.5% |
4.9% |
8.1% |
(8.7%) |
(0.3%) |
|
Thika Road |
1,800 |
62.1% |
4.2% |
1,632 |
70.6% |
4.1% |
(9.3%) |
8.5% |
(0.1%) |
|
Average |
2,716 |
65.8% |
6.2% |
3,045 |
66.3% |
6.8% |
10.8% |
0.5% |
0.6% |
Source; Cytonn Research
Section V: Recommendations and Outlook
Having looked at the various factors driving the hospitality industry and with a particular focus on the serviced apartments sector, including challenges and current performance, we conclude with a recommendation of existing investment opportunities in the sector, and outlook as depicted below;
|
Cytonn Report: Serviced Apartments Sector Outlook 2023 |
||
|
Measure |
Sentiment |
Outlook |
|
Serviced Apartments Performance |
|
Neutral |
|
International Tourism |
|
Neutral |
|
MICE Tourism |
|
Neutral |
|
Supply |
|
Neutral |
Given that all of our key metrics are neutral, we have a NEUTRAL overall outlook for the serviced apartments sector. The Investment opportunity lies in Westlands, Limuru Road, Kilimani, and Kileleshwa-Lavington which performed the best among all the nodes, with rental yields of 10.2%, 8.2%, 7.7% and 7.2% respectively, compared to the market average of 6.8%.
Disclaimer: The views expressed in this publication are those of the writers where particulars are not warranted. This publication, which is in compliance with Section 2 of the Capital Markets Authority Act Cap 485A, is meant for general information only and is not a warranty, representation, advice or solicitation of any nature. Readers are advised in all circumstances to seek the advice of a registered investment advisor


