Gigiri and Karen were the best performing submarkets in Q1’2021 recording rental yields of 8.3% and 8.0%, respectively compared to a market average of 6.8%
I. Commercial Office Sector
In Q1’2020, the commercial office sector recorded subdued performance attributed to; i) reduced demand of office spaces as businesses restructure their operations hence scaling down, ii)oversupply in the commercial office sector which has created a bargaining chip for tenders forcing developers to reduce their prices and give discounts and concessions to attract and retain clients, iii) tough economic environment which has resulted to firms scaling down, iv) declines in occupancy spaces as businesses continue to embrace the working from home strategy.
Source: Cytonn Research
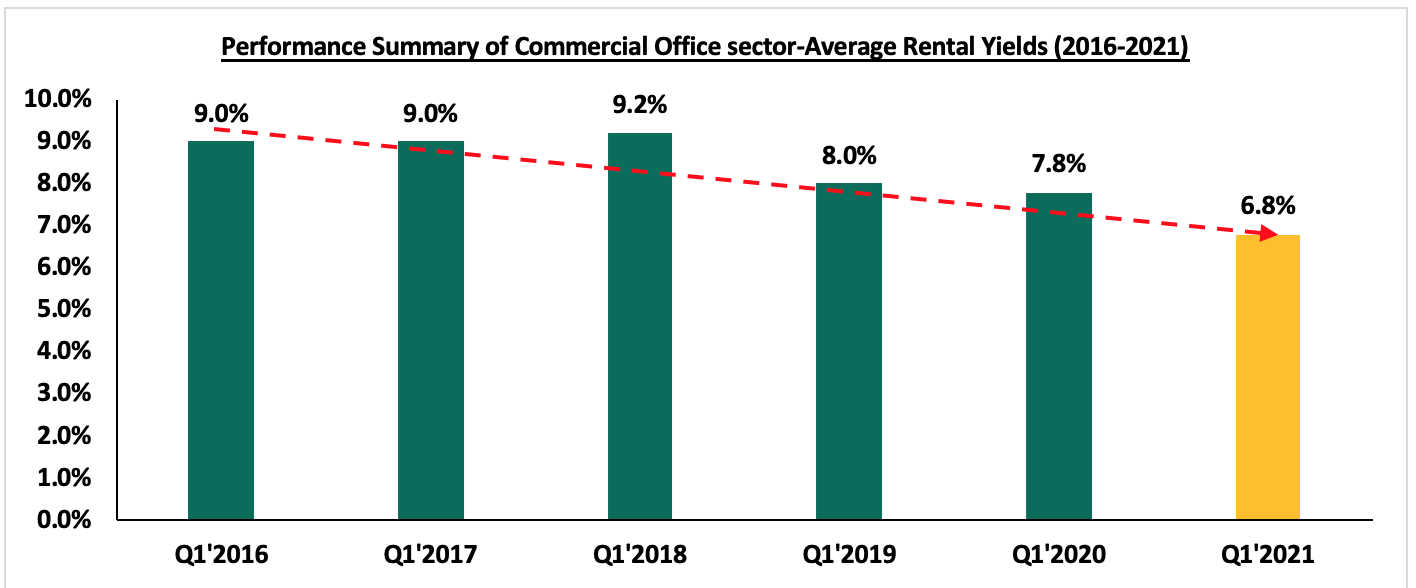
The commercial office sector recorded a 0.2% and 1.4% points decline in the average rental yields and occupancy rates to 6.8% and 76.3% in Q1’2021, from 7.0% and 77.7%, respectively in FY’2020. The declines in the rental yields and the occupancies is attributable to the ongoing COVID-19 pandemic which has led to reduced demand for office spaces as businesses restructure their operations hence scaling down. The asking rents also decreased by 0.8% to an average of Kshs 92 per SQFT in Q1’2021, from Kshs 93 per SQFT in FY’2020, while the asking prices declined by 0.4% to an average of Kshs 12,228 per SQFT in Q1’2021 from Kshs 12,280 per SQFT in FY’2020. The decline in the asking prices and rents is attributed to a surplus of office space which stood at 6.3mn SQFT as at 2020 which has created a bargaining chip for tenants forcing developers to reduce their prices so that they can retain and attract occupants for their office spaces.
The table below highlights the performance of the Nairobi Metropolitan Area (NMA) Commercial Office sector over time:
(All values in Kshs unless stated otherwise)
|
Nairobi Metropolitan Area (NMA) Commercial Office Returns Over Time |
||||||
|
Year |
Q1'2020 |
H1’2020 |
Q3' 2020 |
FY'2020 |
Q1’2021 |
∆ FY'2020/ Q1’2021 |
|
Occupancy % |
81.7% |
80.0% |
79.9% |
77.7% |
76.3% |
(1.4%) points |
|
Asking Rents (Kshs) /SQFT |
97 |
95 |
94 |
93 |
92 |
(0.8%) |
|
Average Prices (Kshs) /SQFT |
12,535 |
12,516 |
12,479 |
12,280 |
12,228 |
(0.4%) |
|
Average Rental Yields (%) |
7.8% |
7.3% |
7.2% |
7.0% |
6.8% |
(0.2%) points |
Source: Cytonn Research 2021
Gigiri and Karen were the best performing submarkets in Q1’2021 recording rental yields of 8.3% and 8.0%, respectively attributed to their superior locations, availability of high quality office spaces charging prime rental prices, relatively good infrastructure, and low supply of commercial office spaces within the markets.
Thika Road and Mombasa Road were the worst performing commercial office nodes within the Nairobi Metropolitan Area recording rental yields of 5.3% and 4.7%, respectively attributed to the effect of traffic snarl-ups, low quality office spaces, and zoning regulations as Mombasa Road is mainly considered as an industrial area, while Thika Road is a popular residential hub, thus making the locations unattractive to business firms.
The table below shows the Nairobi Metropolitan Area (NMA) sub-market performance:
(All values in Kshs Unless Stated Otherwise)
|
Nairobi Metropolitan Area Commercial Office Submarket Performance Q1’2021 |
|||||||||||
|
Area |
Price (Kshs) /SQFT Q1'2021 |
Rent (Kshs) /SQFT Q1'2021 |
Occupancy (%) Q1'2021 |
Rental Yield (%) Q1'2021 |
Price (Kshs) /SQFT FY’2020 |
Rent Kshs/ SQFT FY 2020 |
Occupancy (%) FY’2020 |
Rental Yield (%) FY'2020 |
∆ in Rent |
∆ in Occupancy (% points) |
∆ in Rental Yields (% points) |
|
Gigiri |
13,400 |
116 |
81.0% |
8.3% |
13,400 |
116 |
82.5% |
8.5% |
0.0% |
(1.5% |
(0.2%) |
|
Karen |
13,511 |
107 |
83.8% |
8.0% |
13,567 |
106 |
83.6% |
7.8% |
0.5% |
0.2% |
0.1% |
|
Westlands |
11,974 |
101 |
74.0% |
7.6% |
11,975 |
104 |
74.4% |
7.8% |
(2.4%) |
(0.3%) |
(0.2%) |
|
Parklands |
10,763 |
92 |
77.2% |
7.4% |
10,958 |
93 |
79.9% |
8.2% |
(0.8%) |
(2.7%) |
(0.8%) |
|
Kilimani |
12,187 |
92 |
78.6% |
6.7% |
12,233 |
93 |
79.1% |
6.8% |
(0.4%) |
(0.5%) |
(0.1%) |
|
Upperhill |
12,524 |
95 |
74.8% |
6.8% |
12,684 |
92 |
78.5% |
6.9% |
2.5% |
(3.7%) |
(0.1%) |
|
Nairobi CBD |
12,110 |
81 |
80.9% |
6.6% |
11,889 |
82 |
82.4% |
6.8% |
(1.0%) |
(1.5%) |
(0.2%) |
|
Thika Road |
12,417 |
76 |
74.4% |
5.3% |
12,500 |
80 |
76.1% |
5.8% |
(4.7%) |
(1.7%) |
(0.4%) |
|
Mombasa road |
11,167 |
72 |
61.6% |
4.7% |
11,313 |
73 |
63.0% |
4.8% |
(1.8%) |
(1.4%) |
(0.1%) |
|
Average |
12,228 |
92 |
76.3% |
6.8% |
12,280 |
93 |
77.7% |
7.0% |
(0.9%) |
(1.4%) |
(0.2%) |
Source: Cytonn Research 2021
We have a NEGATIVE outlook for the NMA commercial office sector attributed to the reduced demand of commercial office spaces brought about by the COVID-19 pandemic amid tough economic environments as firms continue to downsize due to financial constrains while others embrace the working from home strategy and may make it a permanent measure with the third wave of the pandemic making it worse. Landlords are expected to continue adopting strategies to cushion themselves against the impacts of the pandemic such as giving discounts and concessions to attract and retain clients. The sector is however expected to recover in the long run as the economy picks up. Investment opportunity lies in Gigiri and Karen which offer relatively good returns compared to the market averages.
For more information, please see our Cytonn Q1’2021 Markets Review.


