In 2017, the Kenyan economy remained resilient, despite a challenging operating environment, expanding by an average of 4.7% for the first three quarters of 2017, compared to an average of 5.7% in a similar period in 2016. The Kenya National Treasury, World Bank and IMF cut their 2017 GDP growth projections to 5.5%, 4.9% and 5.0% from 6.0%, 6.0% and 5.7%, respectively, at the beginning of the year, citing (i) slower growth of the agriculture sector, which grew by an average of 1.9% in the first three quarters of 2017 compared to an average of 5.0% in a similar period in 2016, following the prolonged 2016/17 drought, (ii) the interest rate cap, which led to a reduction in corporate earnings for commercial banks with EPS growth for Q3’2017 at negative 8.2%, compared to positive 15.1% in Q3’2016, (iii) political uncertainty during the year, and (iv) low private sector credit growth, which has averaged 2.4% in the first 10-months to October 2017 compared to a 5-year average of 14.4%. Despite this, we expect GDP growth to come in at 4.7% in 2017, primarily due to the prolonged electioneering period, suppressed growth in agriculture and a slow-down in financial intermediation.
We project 2018 GDP growth to come in between 5.3% and 5.5%, driven by:
- Recovery of the agricultural sector, following improved weather conditions,
- Continued strong growth in the real estate and tourism sectors, with growth in the real estate sector being supported by improved infrastructure and a growing middle class,
- Public infrastructural investments, such as the second phase of the SGR and LAPSSET, boosting growth in the construction sector, and,
- Growth in the manufacturing sector driven by the Kenyan Government’s initiatives, like reducing the cost of energy, aimed towards supporting the various industries, such as textile, leather and agro-business.
Going into 2018, we expect the government to focus on restoring normalcy in the operating environment and fully regaining investor confidence following the political uncertainty experienced in 2017, an election year. This, we expect to be fulfilled through continued implementation of the 2017/18 budget that focused on job creation, investments into the country through tax incentives, and improvement of living standards of the low income population through an increase in the lowest monthly taxable income to Kshs 13,489 from Kshs 11,135. The government exceeded the first quarter of the FY’2017/18 spending targets for both recurrent and development expenditure at 102.4% and 102.9% absorption rates, respectively. Total revenue collections, however, came Kshs 140.2 bn short in January, with the government having collected Kshs 758.9 bn of the targeted Kshs 899.2 bn. Upward pressure on interest rates still exists, which could be brought about by excessive demand for borrowing by the government, due to (i) the higher absorption rates coupled with lower revenue collection, (ii) the government currently being behind its domestic borrowing target for the 2017/18, having borrowed Kshs 185.0 bn against a prorated target of Kshs 244.5 bn, and its foreign borrowing target for the 1st quarter of the 2017/18 fiscal year as per the Q1’2017/18 Budget Review by the CBK, having met 43.8% of the target, and (iii) the expectation that the KRA will face challenges in meeting its collection target due to expected subdued corporate earnings.
Private sector credit growth remained low throughout 2017, averaging 2.4% in 10-months to October, compared to a 5-year average of 14.4%. The decline begun when reforms in the banking sector brought about by the increase in Non-Performing Loans (NPLs) prompted banks to reassess their risk assessment framework, preferring to lend to the government as it is risk free as opposed to the riskier private sector. This then persisted in the year 2017 as a result of the enactment of the Banking (Amendment) Act, 2015, with banks finding it hard to price for risk. In 2018, with banks embarking on implementation of IFRS 9 that will require them to be more prudent in terms of provisioning for bad loans, we expect private sector credit growth to remain well below the government target of 18.3%.
The Kenyan Shilling remained resilient in 2017, depreciating by 0.7% against the USD during the year to close at Kshs 103.2 from Kshs 102.5 in 2016, supported by (i) weakening of the USD in the global markets as indicated by the US Dollar Index, which shed 9.9% in 2017, (ii) the CBK’s intervention activities, as they had sufficient forex reserves to protect the shilling against any instability, which closed the year at USD 7.1 bn (equivalent to 4.7 months of import cover), and (iii) diaspora remittances increased by 21.9% y/y and 8.8% YTD in November 2017, to USD 175.2 mn. However, the current account balance worsened to 7.0% of GDP in Q3’2017 from 6.2% recorded in Q2’2017 and 6.0% in Q3’2016, attributable to imports rising by 20.3% to Kshs 450.9 bn from Kshs 374.8 bn in Q3’2016, mainly due to increased food and petroleum imports, faster than exports that rose by 2.6% to Kshs 145.0 bn from Kshs 141.3 bn in the same periods. Come 2018, the shilling is likely to come under pressure from an expected increase in the value of oil imports should global oil prices continue to rise. However, it shall remain supported by (i) declined food imports and improved agricultural exports as production improves due to improved weather conditions, (ii) the CBK’s foreign exchange reserves of USD 7.1 bn (equivalent to 4.7 months of import cover), and (iii) the continued weakening of the US Dollar. We project that the shilling will range between Kshs 102.0 and Kshs 107.0 to the USD in 2018. However, the shilling has started the year on a strong path, recording an appreciation of 1.0% in January 2018 to Kshs 102.2 from Kshs 103.2 at the start of the year.
2017 average inflation came in at 8.0%, up from 6.3% in 2016, with pressure mainly from rising food inflation in H1’2017 brought on by the 2016/17 drought, causing inflation to hit a high of 11.7% in May. Inflation declined towards the tail end of the year to 4.5% in December, despite pressure from rising fuel prices. In 2018, inflationary pressure is expected to come from (i) higher electricity prices as the Kenya Power Company passes on higher costs to consumers to recover Kshs 8.1 bn incurred by the distributor during the period of prolonged drought, so as to keep the cost of electricity low. This, however, is expected to be countered by a base effect especially in H1’2018, due to the high rates witnessed in a similar period in 2017. The increased maize flour prices, which grew by about 16.7% in January brought on by the end of the maize subsidy on December 31st 2017, should be cushioned by declining prices of other food basket items as a result of improved weather conditions. We therefore project inflation rates for 2018 to average 7.5%, which is at the upper bound of the government target range.
The table below summarizes the various macro-economic factors and the possible impact on the business environment in 2018. With 4 indicators being positive, 2 at neutral and 1 negative, the general outlook for the business environment in 2018 is positive, compared to our 2017 outlook, where 6 indicators were Neutral and 1, Exchange Rate, was negative. The 2018 outlook is more optimistic, with investor sentiment and security turning Positive from Neutral, following the conclusion of the General Election, Inflation and GDP at Positive from Neutral as Inflation stabilised into the government target range of 2.5% - 7.5%, and the Exchange Rate at Neutral from Negative as the CBK continues to support the Shilling in the short term through its sufficient reserves of USD 7.1 bn (equivalent to 4.7 months of import cover).
|
Macro-Economic & Business Environment Outlook |
||
|
Macro-Economic Indicators |
2018 Outlook |
Effect |
|
Government Borrowing |
· Government to come under pressure to borrow as it is well behind both domestic and foreign borrowing targets for FY 2017/18, and KRA is unlikely to meet its collection target due to expected suppressed corporate earnings in 2017. The government is still behind its domestic borrowing target for the current fiscal year, having borrowed Kshs 185.0 bn, against a domestic borrowing target of Kshs 244.5 bn (assuming a pro-rated borrowing target throughout the financial year of Kshs 410.2 bn budgeted for the full financial year as per the Cabinet-approved 2017 Budget Review and Outlook Paper (“BROP”)) |
Negative |
|
Exchange Rate |
· We project the currency will range between Kshs 102.0 and Kshs 107.0 against the USD in 2018 · However, the current account balance worsened to 7.0% of GDP in Q3’2017 from 6.2% recorded in Q2’2016 and 6.0% in Q3’2016, to Kshs 145.4 bn, attributable to imports rising by 20.3% to Kshs 450.9 bn from Kshs 374.8 bn in Q3’2016 · The CBK will continue to support the Shilling in the short term through its sufficient reserves of USD 7.1 bn ( equivalent to 4.7 months of import cover) |
Neutral |
|
Interest Rates |
· We expect upward pressure on interest rates, especially in the first half of the year, as the government falls behind its borrowing targets for the fiscal year. However, with the Banking (Amendment) Act, 2015, the MPC might be unable to do much with the CBR which has remained at 10.0% throughout 2017 |
Neutral |
|
Inflation |
· Inflation is expected to average 7.5% compared to 8.0% last year. The 7.5% is at the upper bound of the government target range of 2.5% - 7.5% |
Positive |
|
GDP |
· We project GDP growth to come in at between 5.3% - 5.5%, higher than the expected growth rate of 4.7% in 2017, and in line with the 5-year historical average of 5.4% |
Positive |
|
Investor Sentiment |
· Given (i) the now settling operating environment following the elections in Q3’2017, (ii) the expectation that long term investors will enter the market seeking to take advantage of the valuations which are at historical averages, though there exists pockets of value, and (iii) expectations of a relatively stable shilling, we expect investor sentiment to improve in 2018 |
Positive |
|
Security |
· We expect security to be maintained in 2018, especially given that the elections are now concluded and the government is settling into office. The USA has also lifted its travel warning for Kenya, placing it in the 2nd highest tier of its new 4-level advisory program, indicating positive sentiments on security from the international community |
Positive |
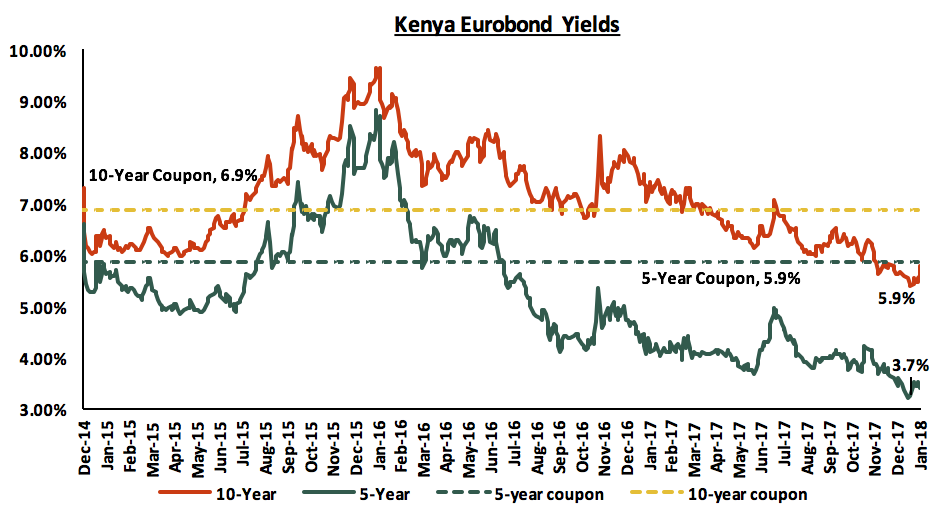
According to Bloomberg, the yields on the 5 and 10-year Eurobonds rose by 20 bps each during the month of January, to close at 3.7% and 5.9%, from 3.5% and 5.7%, respectively, at the end of December, following increased political uncertainty in the country. Since the mid-January 2016 peak, yields on the Kenya Eurobonds have declined by 5.1% points and 3.8% points for the 5-year and 10-year Eurobonds, respectively, due to stable macroeconomic conditions in the country. The declining Eurobond yields, a relatively peaceful electioneering period, and stable rating by Standard & Poor (S&P), are indications that Kenya’s macro-economic environment remains stable and hence an attractive investment destination. However, concerns from Moody’s around Kenya’s rising debt to GDP levels may see Kenya receive a downgraded sovereign credit rating.
The Kenya Shilling appreciated by 1.0% against the USD during the month of January to close at Kshs 102.2, from Kshs 103.2 in December, closing the week at Kshs 101.7, supported by horticulture export earnings. On a year to date basis, the shilling has appreciated against the dollar by 1.4%. In our view, the shilling should remain relatively stable against the dollar in the short term, supported by (i) the expected calm in the political front, following the conclusion of the presidential elections and the swearing in of the President, (ii) the weakening of the USD in the global markets, as indicated by the US Dollar Index, which has shed 9.9% in 2017 and 3.1% year to date, and (iii) the CBK’s activity, as they have sufficient forex reserves, currently at USD 7.1 bn (equivalent to 4.7 months of import cover).
Fixed Income Outlook
The government domestic borrowing has been behind target since the beginning of the fiscal year, currently having borrowed Kshs 185.0 bn domestically, against the pro-rated target of Kshs 244.5 bn, going by the revised government domestic borrowing target of Kshs 410.2 bn as per the Budget Review and Outlook Paper (BROP) 2017. This is compared to a similar period last year where the government was ahead of target all through the first half of the fiscal year, having borrowed Kshs 169.2 bn domestically, against the pro-rated target of Kshs 158.6 bn. The result of this is a higher expected average monthly borrowing of Kshs 147.8 bn in the 2nd half of the current fiscal year, which could lead to upward pressure on interest rates as the government tries to catch up.
Below is a summary of treasury bills and bonds maturities and the expected borrowings over the same period. The government will need to borrow Kshs 147.8 bn on average each month for the rest of the fiscal year in order to meet the revised domestic borrowing target of Kshs 410.2 bn and also cover arising T-bill and T-bond maturities, as illustrated in the graph below.
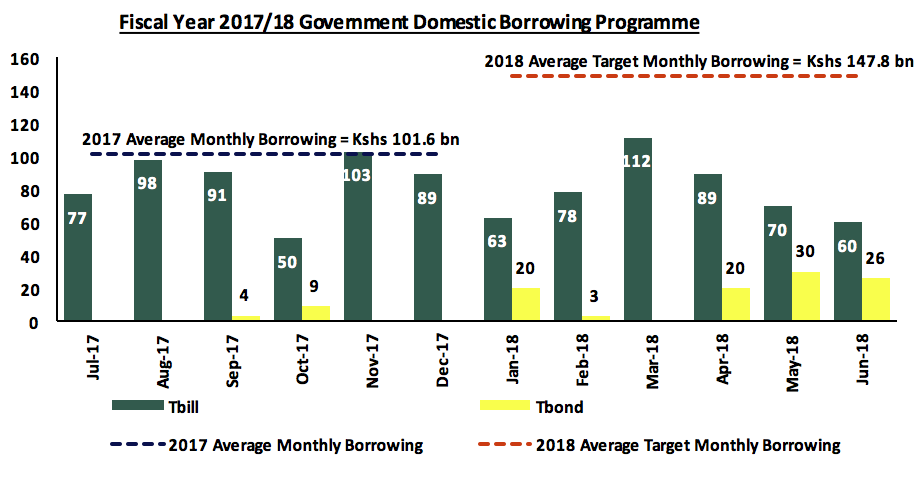
Fig: Schedule of Treasury bills and bonds maturities and the expected target borrowings in the 2017-2018 fiscal year to cater for the maturities and additional government borrowing.
In 2017, yields on government securities remained relatively stable, mainly due to the Central Bank of Kenya’s (CBK’s) efforts to keep rates low by rejecting expensive bids. Following the enactment of the Banking (Amendment) Act, 2015, banks have preferred to lend to the less risky government as opposed to the riskier private sector, because on a risk adjusted basis, government papers are more attractive compared to private sector capped returns. Uncertainty exists in the interest rate environment in 2018, as (i) the government is behind its domestic borrowing target for the current fiscal year, (ii) as per the Q1’2017/18 fiscal year budget review, the government has only borrowed 2.7% of its total foreign borrowing target, having borrowed Kshs 7.5 bn compared to a target of Kshs 277.3 bn, and (iii) the KRA is expected to face challenges in meeting its collection target due to expected subdued corporate earnings. All these factors could result in upward pressure on interest rates.
During the month of January, T-bills auctions recorded an undersubscription, with the average subscription rate coming in at 97.5%, compared to 78.3% recorded in December. The subscription rates for the 91, 182 and 364-day papers came in at 97.5%, 111.4% and 83.5% from 79.5%, 52.1% and 216.9% the previous month, respectively. The yields on the 91 and 182-day papers remained unchanged at 8.0% and 10.6%, respectively, while the yield on the 364-day paper increased to 11.2% from 11.1%. The T-bills acceptance rate came in at 85.5% during the month, compared to 87.9% in December, with the government accepting Kshs 100.0 bn of the Kshs 116.9 bn worth of bids received, indicating that bids were largely within ranges the CBK deemed acceptable.
This week, T-bills were oversubscribed, with the overall subscription coming in at 138.3%, compared to 116.8% recorded the previous week. Subscription rates for the 91, 182, and 364-day papers came in at 143.0%, 129.6%, and 145.1% from 99.6%, 138.1%, and 102.4%, the previous week, respectively. Yields on the 91 and 364-day T-bills remained unchanged during the week at 8.0% and 11.2%, respectively, while the yield on the 182-day paper declined to 10.4% from 10.6% the previous week.
Rates in the fixed income market have remained stable as the government rejects expensive bids despite being behind their borrowing target. However, a budget deficit that is likely to result from depressed revenue collection creates uncertainty in the interest rate environment as any additional borrowing in the domestic market to plug the deficit could lead to upward pressure on interest rates. Our view is that investors should be biased towards short-to medium term fixed income instruments to reduce duration risk.
Equities Outlook
During the year 2017, the Kenyan equities market was on an upward trend, with NASI, NSE 25 and NSE 20 gaining by 28.4%, 21.3% and 16.5%, respectively. This performance was driven by gains in large-cap stocks such as DTB, KCB Group, Safaricom, Equity Group and Co-operative Bank, which gained 62.7%, 48.7%, 39.7%, 32.5% and 21.2%, respectively. Following 2017’s bull-run, the market came close to its historical average with NASI P/E currently at 13.9x compared to the historical average of 13.4x. Equity turnover in 2017 rose by 14.3% to USD 1.7 bn from USD 1.4 bn in FY’2016. Foreign investors turned net sellers with net outflows of USD 117.1 mn compared to net inflows of USD 88.8 mn recorded in FY’2016, which can be attributed to negative investor sentiment as a result of political uncertainty during the election period, with investors taking profit following the stock market rally. The year also saw 12 companies issue profit warnings to investors, compared to 11 companies that issued profit warnings in 2016, as summarised in the table below:
|
Companies that issued profit warnings in 2016 and 2017 |
||
|
No |
2016 |
2017 |
|
1 |
Nairobi Securities Exchange |
Standard Chartered Bank |
|
2 |
Sasini |
Standard Group |
|
3 |
Sameer Africa |
Britam Holdings |
|
4 |
Sanlam Kenya |
Bamburi |
|
5 |
Deacons East Africa |
HF Group |
|
6 |
Family Bank |
Flame Tree |
|
7 |
CIC Insurance Group |
BOC Kenya |
|
8 |
Williamson Tea Kenya |
Deacons East Africa |
|
9 |
Kapchorua Tea |
Family Bank |
|
10 |
Mumias Sugar |
Mumias Sugar |
|
11 |
Shelter Afrique |
Nairobi Business Ventures |
|
12 |
Unga Group |
|
During the month of January 2018, the equities market was on an upward trend with NASI, NSE 25 and NSE 20 gaining 5.5%, 5.4% and 0.7%, respectively, which also represent the indices YTD performance. The equities market performance during the month was driven by gains in large caps such as Barclays Bank, Safaricom, Diamond Trust Bank and Equity Group, which gained 10.4%, 10.3%, 8.2% and 6.8%, respectively. For this week, the equities market was on an upward trend with NSE 20 and NSE 25 gaining 0.8% and 0.7%, respectively, while NASI remained flat. For the last twelve months, NASI, NSE 25 and NSE 20 have gained 48.0%, 44.2% and 34.1%, respectively. Since the February 2015 peak, NASI has gained 2.4%, while NSE 20 has lost 31.7%.
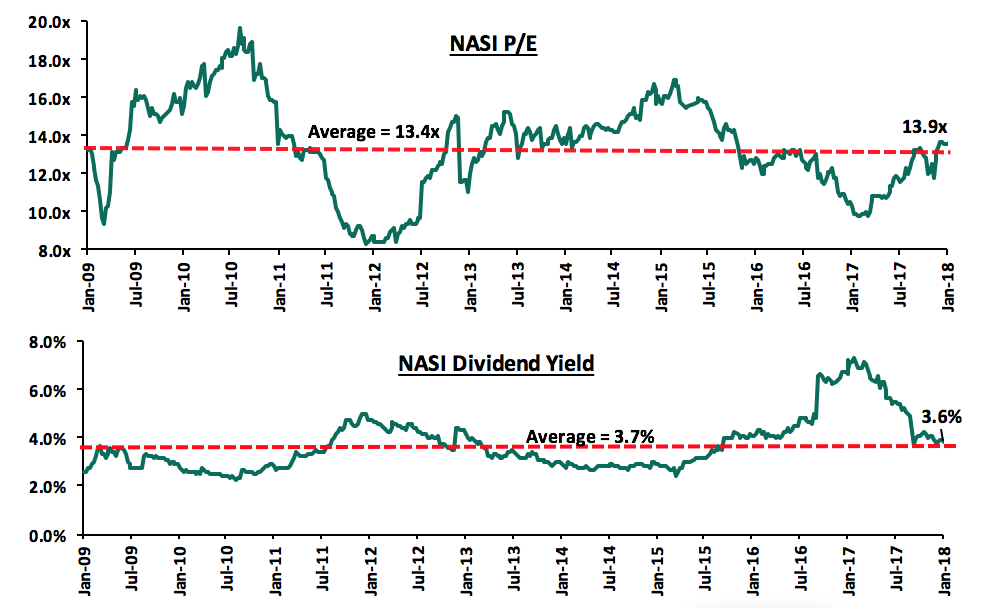
The market is currently trading at a price to earnings ratio (P/E) of 13.9x, versus a historical average of 13.4x, and a dividend yield of 3.6%, compared to a historical average of 3.7%. The current P/E valuation of 13.9x is 43.4% above the most recent trough valuation of 9.7x experienced in the first week of February 2017, and 67.4% above the previous trough valuation of 8.3x experienced in December 2011. In our view, there still exists pockets of value in the market, with the current P/E valuation being 17.8% below the most recent peak of 16.9x in February 2015. The charts below indicate the historical P/E and dividend yields of the market.
During the week, National Bank announced plans to send 150 employees, who are aged over 35-years and have worked for the company for at least 5-years, on voluntary early retirement in a process that was scheduled to be completed by 1st February 2018. The move is aimed at realigning staff requirements to the needs of the bank, as it intensifies its digital transformation agenda. National Bank becomes the latest bank to announce a restructuring plan necessitated by the challenging operating environment, which has seen 10 other banks retrench staff and close branches. However, given that banks have adjusted to the new interest cap environment and the electioneering period is over, we believe the worst is now behind the banking sector and we don’t expect any new massive layoffs. The table below highlights the number of staff retrenched and branches closed by financial institutions since the implementation of Banking (Amendment) Act:
|
Kenya Banking Sector Restructuring |
|||
|
No |
Bank |
Staff Retrenchment |
Branches Closed |
|
1 |
Bank of Africa |
- |
12 |
|
2 |
Barclays Bank |
301 |
7 |
|
3 |
Ecobank |
- |
9 |
|
4 |
Equity Group |
400 |
7 |
|
5 |
Family Bank |
Unspecified |
- |
|
6 |
First Community Bank |
106 |
- |
|
7 |
I&M Holdings |
- |
Unspecified |
|
8 |
KCB Group |
223 |
Unspecified |
|
9 |
National Bank |
150 |
- |
|
10 |
NIC |
32 |
Unspecified |
|
11 |
Sidian Bank |
108 |
- |
|
12 |
Standard Chartered |
300 |
4 |
|
Total |
1,620 |
39 |
|
Going into 2018, the factors that will affect the direction of the Kenyan equities market include:
- Corporate Earnings: On average, we expect earnings growth for the year 2018 to come in at 12.0%, higher than our 2017 expectation of 8.0%. The expectation of suppressed earnings for 2017 was mainly attributed to (i) anticipation of depressed earnings for commercial banks due to implementation of the Banking (Amendment) Act, 2015, which placed regulations on banks’ loan and deposit pricing framework, thereby reducing the net interest margin for banks, and (ii) disruption of business as a result of the prolonged election period. In 2018, we expect a more stable and favourable business operating environment given the peaceful conclusion of general elections. Despite the implementation of IFRS 9 that is likely to negatively impact financial institutions’ profitability, we expect banks to record better earnings this year given the impact of interest rate caps has already been levelled off in 2017. Non-financials are also likely to report better earnings supported by a stable business environment, although decline in private sector credit growth remains a key risk;
- Capital Markets Investor Sentiment: Despite policies geared towards monetary tightening in global markets that may result in foreign exits, we expect the equities market to register increased foreign inflows in 2018, mainly supported by (i) expectations of a stable macroeconomic environment that will favour businesses, thus enabling them to achieve higher corporate earnings, (ii) existence of value to be derived from stocks in under-valued segments of the market, which provide attractive entry opportunities for long-term investors, and (iii) generally, Kenya remains more attractive compared to other frontier markets boosted by stronger economic growth compared to other economies in the region such as Nigeria, and Kenya’s rank at position 80 in ease of doing business higher than regional peers Uganda and Tanzania, which will attract investors seeking the high growth in frontier markets;
- Interest Rates: We expect the monetary policy to remain relatively stable in 2018, as the CBK monitors Kenya’s inflation rate and exchange rate expectation, despite upward pressure due to government borrowing falling below its target. The inflation rate is expected to remain within the government target of 2.5% - 7.5% due to improved weather conditions, while the currency is expected to remain stable supported by CBK, despite expectations of strengthening of the dollar due to rate hikes by Fed. The interest rate cap also makes it hard for the CBR to be changed, as it will have a direct negative effect on lending and the banking sector;
- Diversification of Capital Markets and New Listings: In March 2017, NSE introduced the Barclays NewGold ETF that tracks the price of Gold Bullion; however, the product has received minimal interest from investors having gained 1.2% with a traded volume of 9,700 units since launching. A number of other initiatives undertaken by NSE in 2017 have fallen overdue, including (i) possible setting up of a commodities exchange, (ii) the CDSC’s plan to launch a new trading platform in April 2017 that would allow a settlement cycle of 1 day (T+1), (iii) the recently approved launch of a short-selling and security lending facility due in June 2018, and (iv) to add listed equities from other African countries, starting with Nigeria. We expect implementation of these initiatives to result in; (i) increased liquidity in the market by increasing the volume of securities available for trading, (ii) make pricing of bonds and equities easier as it improves price discovery mechanisms in the securities exchange, and (iii) improve depth of the capital market thus attracting investors. Key challenges in the market, however, are the deferment of these initiatives without clear timelines, and the low volume of trades on the new products, which could be attributed to lack of proper investor education, and our suggestion is more investment towards educating the public before rolling out new products;
- Regulation: Key regulatory change in 2018 is IFRS 9, in which financial institutions are expected to adopt a more forward-looking approach in provisioning for bad loans, which is expected to improve asset quality and eventually lead to a more stable sector. We also expect enhanced corporate governance practices following adoption of the guidelines stipulated in the Code of Governance and the Companies (General) (Amendment) Regulations, 2017, which requires listed firms to publish directors’ pay in annual reports. These, together with other regulations highlighted in Cytonn Annual Markets Review – 2017, are key to investors for decision-making thus boosting investor sentiments in the equities market.
As can be seen in the table below, we expect equities market activity in 2018 to be driven by (i) expected strong GDP growth rate for the year at between 5.3% -5.5% supported by agriculture, real estate and manufacturing sectors, (ii) faster growth in corporate earnings compared to 2017, (iii) attractive valuations for long-term investors, with the market forward P/E of 12.3x compared to a historical average of 13.4x, and (iv) improved investor sentiment due to a stable business operating environment. Compared to 2017, we have maintained our outlook on the three key equities market indicators relatively the same. Our outlook on macro-economic environment was more optimistic in 2017 as we expected a GDP growth of between 5.4% - 5.7%, which is above the 5-year historical average of 5.4%. On corporate earnings growth and valuations, we had a better outlook in 2017 compared to this year, since the market was then trading at a P/E of 10.5x, against a historical average of 13.6x, which gave a forward P/E of 9.6x, 41.6% cheaper than the historical average. Currently, stocks have rallied and brought the market P/E slightly above the historical average, hence long-term investors get a less return this year given the assumption of 12.0% growth in corporate earnings. We have also changed our outlook on investor sentiment and security to ‘Positive’ from ‘Neutral’ last year due to expectations of improved investor sentiment supported by a stable business environment, since 2017 was affected by uncertainty over the Kenyan general elections.
|
Equities Market Indicators |
Outlook 2018 |
Current View |
2017 View |
|
Macro-economic Environment |
· GDP growth is expected to recover in 2018, from the depressed average of 4.7% recorded in the first three quarters of 2017, and come in at between 5.3%-5.5%. This will be driven by recovery of agriculture, continued growth in real estate and tourism and public infrastructural investments. Key risk lies in the subdued private sector credit growth, that averaged 2.4% in 2017, below the 5-year average of 14.0%, and this may impact adversely on economic growth · Interest rates are expected to remain at the current levels as the CBK monitors inflation and exchange rates |
Neutral |
Neutral with a bias to Positive |
|
Corporate Earnings Growth and Valuations |
· We expect corporate earnings growth of 12.0% in 2018, higher than the expected growth of 8.0% for 2017, boosted by a more stable and favourable business operating environment · Assumption of corporate earnings growth rate of approximately 12.0% at the current market P/E of 13.9x gives a forward P/E of 12.4x, which is 10.7% cheaper than historical average of 13.4x and 26.6% below the most recent peak of 16.9x recorded in Feb 2015 |
Neutral |
Neutral with a bias to Positive |
|
Investor Sentiment and Security |
· We expect 2018 to register increased foreign inflows from the negative position in 2017, mainly supported by a stable business operating environment and long term investors who enter the market looking to take advantage of the current low valuations in sections of the market · We expect security to be maintained in the country supported by government initiatives towards maintaining internal security even as we expect minimal political activity in the year |
Positive |
Neutral |
Below is our Equities Universe of Coverage:
|
all prices in Kshs unless stated otherwise |
||||||||
|
No. |
Company |
Price as at 29/12/17 |
Price as at 31/01/18 |
m/m Change |
YTD Change |
Target Price* |
Dividend Yield |
Upside/ (Downside)** |
|
1. |
NIC*** |
33.8 |
36.3 |
7.4% |
7.4% |
61.4 |
3.4% |
72.8% |
|
2. |
DTBK |
192.0 |
205.0 |
6.8% |
6.8% |
281.7 |
1.3% |
38.7% |
|
3. |
KCB Group |
42.8 |
45.3 |
5.8% |
5.8% |
59.7 |
6.6% |
38.5% |
|
4. |
I&M Holdings |
127.0 |
116.0 |
(8.7%) |
(8.7%) |
150.4 |
2.6% |
32.2% |
|
5. |
Barclays |
9.6 |
10.6 |
10.4% |
10.4% |
12.8 |
9.3% |
30.1% |
|
6. |
Kenya Re |
18.1 |
19.7 |
8.8% |
8.8% |
24.4 |
3.8% |
27.7% |
|
7. |
Liberty Holdings |
12.2 |
13.3 |
9.0% |
9.0% |
16.4 |
0.0% |
23.3% |
|
8. |
Britam |
13.4 |
13.1 |
(2.2%) |
(2.2%) |
15.2 |
1.7% |
18.2% |
|
9. |
Co-op Bank |
16.0 |
16.6 |
3.4% |
3.4% |
18.6 |
5.5% |
17.9% |
|
10. |
Jubilee Insurance |
499.0 |
500.0 |
0.2% |
0.2% |
575.4 |
1.7% |
16.8% |
|
11. |
Sanlam Kenya |
27.8 |
27.8 |
0.0% |
0.0% |
31.4 |
1.1% |
14.1% |
|
12. |
CIC Group |
5.6 |
5.6 |
0.0% |
0.0% |
6.2 |
1.8% |
12.5% |
|
13. |
HF Group*** |
10.4 |
10.9 |
4.3% |
4.3% |
11.7 |
0.8% |
8.9% |
|
14. |
Standard Chartered |
208.0 |
203.0 |
(2.4%) |
(2.4%) |
201.1 |
4.3% |
3.4% |
|
15. |
Stanbic Holdings |
81.0 |
81.0 |
0.0% |
0.0% |
79.0 |
5.1% |
2.6% |
|
16. |
Equity Group |
39.8 |
43.0 |
8.2% |
8.2% |
42.3 |
4.1% |
2.5% |
|
17. |
NBK |
9.4 |
9.0 |
(3.7%) |
(3.7%) |
5.6 |
0.0% |
(38.1%) |
|
*Target Price as per Cytonn Analyst estimates |
|
|
|
|
|
|||
|
**Upside / (Downside) is adjusted for Dividend Yield |
||||||||
|
***Banks in which Cytonn and/or its affiliates holds a stake |
||||||||
|
For full disclosure, Cytonn and/or its affiliates holds a significant stake in NIC Bank, ranking as the 9th largest shareholder |
||||||||
We maintain a “NEUTRAL” recommendation on equities for investors with short-term investment horizon since the market has rallied and brought the market P/E slightly above its’ historical average. However, pockets of value exist, with a number of undervalued sectors like Financial Services, and with expectations of higher corporate earnings this year, the market will be cheaper for long-term investors hence we are “POSITIVE” for investors with long-term horizon.
Private Equity Outlook
The year 2017 saw an increase in private equity deals across sub-Saharan Africa, with the first half of 2017 registering USD 1.0 bn of deals compared to USD 0.9 bn within a similar period in 2016. 56.0% of these deals were in East Africa and West Africa. In terms of fund raising efforts, 2017 recorded stronger performance with more than USD 2.0 bn raised in the first half of 2017 compared to USD 1.1 bn raised in H1’2016. Funds that announced a final close in H1’2017 include (i) Actis Energy Fund 4, which began it fund raising in September 2016, (USD 2.8 bn), Adenia Capital IV (USD 0.3 bn), Fund for Agricultural Finance in Nigeria (USD 0.1 bn), and African Rivers Fund (USD 0.05 bn). There were 12 disclosed exits recorded in Sub Saharan Africa by H1’2017, with the number of exit by the end of 2017 expected to be slightly higher than the 44 recorded in 2016. In East Africa, the financial services sector recorded the highest number of deals (5 of 15) while the telecommunication sector had the highest value of deals in H1’2017. Data relating to FY’2017 performance of the private equity market in SSA is not yet available.
We expect the trend to continue into 2018, especially in East Africa, which remains the backbone of the Sub Saharan economy, attributed to (i) a general improvement in ease of doing business, (ii) the high return potential across major sectors, especially those underserved by the government, (iii) a well-diversified economy, resilient to external shocks, (iv) consolidation in sectors such as financial services, creating an avenue for increased private equity activity, (v) the continued deepening of the capital markets which provide an avenue for PE investors to exit, and (vi) a general improvement in political stability.
We expect investors to remain focused on the following key sectors that we cover:
- Financial Services - Kenya’s Financial Services Sector is already going through consolidation as evidenced by heightened M&A activity over the last 4-years. The consolidation of the industry is attributed to heightened regulations in the sector, which require companies to shore up capital. Those who fail will either be acquired or merge. Key to note is that the transactions have been trading at a discount, highlighting the attractive valuations for PE investors to penetrate the market. Below is a summary of key transactions done over the last few years and their transaction multiples;
|
Banking Sector Transaction Multiples over the last 2 Years |
||||||
|
Acquirer |
Bank Acquired |
Book Value (bn Kshs) |
Transaction Stake |
Transaction Value (Kshs bns) |
P/Bv Multiple |
Date |
|
Mwalimu SACCO |
Equatorial Commercial Bank |
1.2 |
75.0% |
2.6 |
2.3x |
Mar-15 |
|
I&M Holdings |
Giro Commercial Bank |
3.0 |
100.0% |
5.0 |
1.7x |
Jun-16 |
|
M Bank |
Oriental Commercial Bank |
1.8 |
51.0% |
1.3 |
1.4x |
Jun-16 |
|
SBM Holdings |
Fidelity Commercial Bank |
1.8 |
100.0% |
2.8 |
1.6x |
Nov-16 |
|
DTBK |
Habib Bank Limited Kenya |
2.4 |
100.0% |
1.8 |
0.8x |
Mar-17 |
|
Average |
|
|
85.2% |
2.7 |
1.6x |
|
|
Insurance Sector Transaction Multiples over the last 2 Years |
||||||
|
Acquirer |
Acquired |
Book Value (bn Kshs) |
Stake |
Transaction Value(bn Kshs) |
P/B |
Date |
|
Old Mutual Plc |
UAP Holdings |
9.6 |
60.7% |
11.1 |
1.9x |
Jan-15 |
|
MMI Holdings |
Cannon Assurance |
1.7 |
75.0% |
2.4 |
1.9x |
Jan-15 |
|
Sanlam |
Gateway Insurance |
1.0 |
51.0% |
0.6 |
1.1x |
Mar-15 |
|
Barclays Africa |
First Assurance |
2.0 |
63.3% |
2.9 |
2.2x |
Jun-15 |
|
IFC |
Britam |
22.5 |
10.4% |
3.6 |
1.5x |
Mar-17 |
|
Africinvest III |
Britam |
28.5 |
14.3% |
5.7 |
1.4x |
Sep-17 |
|
Average |
|
|
45.8% |
4.4 |
1.7x |
|
Given the moratorium on licensing new banks, it is a great opportunity for PE firms to acquire banks and insurance companies at favourable multiples. The focus on financial services sector is driven by (i) the increasing demand for credit, (ii) the growing financial services inclusion in the region through alternative banking channels, (iii) increased innovation and new product development within the financial services sector, and (iv) the growing middle class supporting an inherent increase in consumption expenditure, and an increase in the percentage of the population that will require financial services
- Education - We expect an increase in deal volume in the education sector, with a focus on (i) Early Childhood Development Education (ECDE), (ii) Private Primary, (iii) Private Secondary, and (iv) technical and vocational training institutes. The key drivers of investment in the sector will be (i) demand for quality education and a more comprehensive curriculum, (ii) a rise in number of candidate who don’t meet the minimum University grade, (iii) the entry of international brands over the past years such as the Nova Academies, GEMS Cambridge, JSE listed ADvTech Limited and bridge schools, (iv) a shift of demand from government funded education towards private education providers driven by the frequent disruptions in public schools, and (v) renewed support from the government on technical institutions, through education loans. Informed by demand for education and the ability to afford the education provided, PE investors in the education sector can focus on the following counties to provide either, Early Childhood Development (ECD), Primary or Secondary level education, and technical colleges as highlighted in the table below;
|
Education Sector Investment Opportunities |
|||||
|
|
County |
ECD Level |
Primary Level |
Secondary Level |
Technical Institute |
|
1. |
West Pokot County |
√ |
√ |
||
|
2. |
Turkana County |
√ |
√ |
||
|
3. |
Samburu County |
√ |
√ |
||
|
4. |
Isiolo County |
√ |
√ |
||
|
5. |
Kilifi County |
√ |
√ |
||
|
6. |
Nairobi City County |
√ |
√ |
||
|
7. |
Kwale County |
√ |
√ |
||
|
8. |
Nyandarua County |
√ |
√ |
||
|
9. |
Trans-Nzoia County |
√ |
√ |
||
|
10. |
Lamu County |
√ |
√ |
√ |
|
|
11. |
Nyamira County |
√ |
√ |
√ |
|
|
12. |
Busia County |
√ |
√ |
√ |
|
|
13. |
Vihiga County |
√ |
√ |
√ |
|
|
14. |
Embu County |
√ |
√ |
√ |
|
|
15. |
Tharaka County |
√ |
√ |
√ |
|
|
16. |
Kiambu County |
√ |
√ |
√ |
|
|
17. |
Machakos County |
√ |
√ |
√ |
|
|
18 |
Muranga County |
√ |
√ |
√ |
|
|
19. |
Nakuru County |
√ |
√ |
√ |
|
|
20. |
Elgeyo Marakwet County |
√ |
√ |
√ |
√ |
|
21. |
Kirinyaga County |
√ |
√ |
√ |
√ |
|
22. |
Taita Taveta County |
√ |
√ |
√ |
√ |
|
23. |
Laikipia County |
√ |
√ |
√ |
√ |
|
24. |
Nyeri County |
√ |
√ |
√ |
√ |
- Telecommunication, Media and Technology (TMT) - Kenya continues to register growth in TMT, driven by a young and innovative Kenyan generation, and the demand to provide an all-inclusive economy. Technology is increasingly being used to complement sectors such as financial services, agriculture, health and the energy sector. The sector will remain attractive to investors as it is supported by (i) support for innovation by the government, (ii) increased exposure of Kenya’s tech products to the global market and foreign investors, and (iii) relative ease of entry into the sector. Sectors likely to benefit from investment in technology innovations are;
- Health sector, with an aim to increase efficiency and improve service delivery. The sector has also displayed innovation with companies such as PeekVision, offering medical services via a mobile platform,
- The government, in a bid to increase transparency and reduce corruption in government dealings,
- The agricultural sector with a focus on providing information to farmers and easier sourcing of market for farm produce,
- The financial services sector, as financial service providers strive to be innovative in their products thus improving customer reach and satisfaction, and also reducing operational costs, and,
- The energy sector, where companies are innovating ways which they can facilitate energy provision to marginalised areas and also offer flexible payment terms. Companies such as M-Kopa and M-PAYG are offering such pay-as-you-go
During the month of January, we witnessed Private Equity activity through, acquisitions, and fundraising in major sectors including the TMT (Technology, Media & Telecommunications) sector, financial services sector and the retail sector, as shown below:
- In the retail sector, a deal to fund Uchumi by a New York-based Private Equity fund, Kuramo Capital, collapsed at the final stages of negotiations due to disagreement over the timing of cash injection and concerns over the Treasury’s intended sale of its 14.7% stake in the retailer. For more information on this, see our Cytonn Weekly #01/2018
- In the TMT sector, IHS Holdings Limited, a provider of mobile telecommunications infrastructure in Africa with operations in Nigeria, Cameroon, Côte d’Ivoire, Zambia, and Rwanda, received USD 231.0 mn (Kshs 23.8 bn) in 8-year debt funding from MTN Group, Africa’s biggest GSM operator. For more information on this, see our Cytonn Weekly #02/2018
- In the Financial services sector, Atlas Mara Limited, a financial services holding company formed to undertake the acquisition of target banks in Africa, increased its strategic stake in Union Bank Nigeria (UBN) through a Naira 26.3 bn (USD 75.0 mn) investment in UBN’s rights issue. Atlas Mara’s investment of USD 75.0 mn translates to around 6.4 bn shares. With the acquisition, Atlas will have 10.3 bn shares in total, of the 29.1 bn shares issued translating to a 48.0% ownership in UBN, having fully subscribed to the rights related to its pre-existing 44.5% shareholding, and acquired shares representing a 3.5% shareholding through application for additional shares during the rights issue. As at H1’2017, Union Bank had a book value of N 276.7 bn, as such, the transaction was carried out at a price-to-book value (P/Bv) of 0.3x, which is an 84.2% discount to the average P/TBv multiple of 1.9x for select listed Banks in Nigeria, hence a relatively cheaper transaction valuation. For more information on this, see our Cytonn Weekly #03/2018
- Kuramo Capital, a New-York based private equity firm has completed a transaction to acquire a minority stake in Kenyan investment bank Sterling Capital for an undisclosed amount. The acquisition follows the reinstatement of Sterling’s investment banking license in October 2017, after it was downgraded to stockbroker level in 2011, for failing to meet CMA’s revised minimum capital limit that required investment banks to raise their minimum capital to Kshs 250.0 mn from Kshs 30.0 mn, while stockbrokers were required to increase their capital to Kshs 50.0 mn, up from Kshs 5.0 mn. For more information on this, see our Cytonn Weekly #04/2018
On the Fundraising front:
- Catalyst Principal Partners, a Nairobi Based Private Equity firm, secured a USD 15.0 mn investment from the African Development Bank (AfDB) for their Catalyst Fund II. The fund, targeting a close of USD 175.0 mn, will be deployed in the local mid-market segment across FMCG, financial services, and healthcare. AfDB being the anchor investor in Catalyst Fund I, targets a participation of 8.6% in Catalyst Fund II, while still maintaining a governance role in the fund. For more information on this, see our Cytonn Weekly #01/2018
Our outlook for private equity remains positive, and we expect an increase in the number of deals and deal volume in both the education and the technology sector. For the financial services sector, we expect increased consolidation in the industry and more PE investors to take advantage of the cheaper market valuations. We remain bullish on PE as an asset class given (i) the abundance of global capital looking for opportunities in Africa, (ii) the attractive valuations in private markets compared to public markets, and (iii) better economic growth in Sub Saharan Africa as compared to global markets.
Real Estate Outlook
In 2017, the performance of the real estate sector in Kenya softened as a result of:
- Political uncertainty due to the extended electioneering period resulting in investors adopting a wait and see attitude,
- Reduced credit supply due to the capping of interest rates that saw private sector credit growth decline to 2.4% as at October 2017 from a 5-year average of 14.4% with the number of active mortgage accounts dropping by 1.5% to 24,085 from 24,458 in 2015, and,
- Softening of the retail and commercial office sector performance mainly as a result of (i) an oversupply of 3.2 mn SQFT of office space in Nairobi, and (ii) internal challenges facing retailers on finance and supply chain management, especially with Nakumatt and Uchumi leading to the closure of some of their stores hence affecting occupancy levels in key retail facilities.
The above occurrences resulted in total returns in real estate averaging at 14.5% in 2017 from 25.8% in 2016. However, there were pockets of value in some submarkets, which earned high returns of between 25.0%- 31.0%. These markets include Kilimani and Karen. In 2018, we expect the sector to recover mainly due to:
- Political stability following the end of the electioneering period,
- Economic recovery with the GDP projected to come in between 5.3% and 5.5% compared to the expected 4.7% in 2017, and,
- Government incentives such as (i)tax relief of 15% for developers putting up more than 100 affordable housing units p.a., (ii) the scrapping of the land title search fees, NEMA and NCA Levy, and (iii) digitization of the Lands Ministry.
Other key drivers of real estate in 2018 will be:
- Demographic Trends – Demographic trends such as rapid urbanisation currently at 4.4% p.a against global averages of 2.1%, an expanding middle class with increased purchasing power due to higher disposable incomes, which increased to Kshs 6.6tn in 2016 from Kshs 5.7tn in 2015, rapid population growth with the population growth rates currently at 2.6%, 1.4% points higher than global averages of 1.2%, will drive real estate development as developers work towards serving the housing, entertainment and consumption needs, thus boosting developments in the residential and retail themes;
- Housing Deficit – According to the National Housing Corporation (NHC), Kenya has a housing deficit of approximately 2.0 mn units, with an effective annual shortfall of 200,000 units, that should serve the low to middle-income sectors. We expect to witness increased development as developers strive to reduce the deficit. Increased focus by the government on affordable housing through initiatives such as 15.0% corporate tax relief to developers who put up at least 100 low-cost residential houses annually, digitization of the lands ministry, scrapping of NEMA and NCA levy and inclusion in its four key strategic pillars of focus for the period 2017-2022 known as the “Big Four” alongside food security, manufacturing and affordable healthcare, will also boost development activity and thus drive the residential real estate market;
- Sustained Infrastructural Development – Government has plans to build 10,000 kms of road networks in the next 5-years which will open up various areas for real estate development. Some of tenders already awarded include tenders for Ngong Road Phase II and the dualling of the Ruaka to Ruiru Bypass (Northern Bypass). In addition, areas such as Ruiru and Kitengela are mapped for connection to the main sewer which will allow for higher density developments and boost real estate prices;
- Domestic and MICE Tourism – Domestic tourism has grown with Kenyans accounting for 54.2% of total bed nights in 2016 compared to 53.7% in 2015 and 46.9% recorded in 2014. In addition, the number of conferences held in the country increased by 16.5% in 2016 compared to a 3.0% increase in 2015, driven by the positioning of Nairobi as a regional hub, improved security and political calmness. We expect the trend to continue given the completion of the Standard Gauge Railway (SGR) that has eased access to and from the Coast and government incentives such as the scrapping of VAT from National Park fees;
- A Better Operating Environment – Better operating and legal environment evidenced by political calmness, statutory policies and steps taken by the government to cushion the sector such as (i) Tax relief of 15% for developers developing more than 100 affordable housing units p.a, (ii) Scrapping of the land title search fees, NEMA and NCA levies, (iii) digitization of the Lands Ministry, and (iv) relaxation of zoning regulations that will facilitate optimal land use in areas such as Spring Valley, Kileleshwa and Riverside Drive will also drive real estate in 2018; and
- Kenya as a Regional Hub – We expect increased Foreign Direct Investments (FDI) in 2018, with the entry of multinationals such as Isuzu and JP Morgan Chase, despite a 57.9% drop in FDI recorded in 2016, with the FDI projects decreasing to 40 in 2016, compared to 90 in 2015. Consultancy firm EY (formerly Ernst & Young) ranked Kenya as 2017's second-most attractive foreign investment destination in Africa.
The key challenges that will affect the sector in 2018 include:
- Inadequate and High Cost of Funds - Banks have reduced credit advancement to small and medium-sized companies as a result of the interest rates cap that stands at 14.0%. Mortgages also reduced as a result of the interest capping with the number of active mortgage accounts dropping by 1.5% to 24,085 at the end of December 2017. Despite the capping of interest rates, the actual cost of credit is still high averaging at 19.0% thus increasing the development costs;
- Increased Supply and Competition- The commercial office segment is likely to experience lower returns as a result of the oversupply in the sector; supply is expected to be 3.9 mn SQFT in 2018. With the entry of international retailers, we expected high competition in the retail sector which is likely to constrain the performance of small operators; and
- Lack of Affordable Development Class Land- There is inadequate development land supply at effective prices thus increasing the costs of development and consequently end-user prices. On average, land prices have grown by a 6-year CAGR of 17.4%.
Key trends expected to shape the real estate sector in 2018 include;
- The Adoption of Smart Buildings as Kenya continues to embrace new technology-rich ecosystem, through pro-active legislation and support of technologies designed to enhance the lives of all people, for example through the proposed Konza City;
- Shared Spaces - that is serviced apartments and offices, as clients demand faster and more convenient services. Serviced apartments as a concept is expected to shape the hospitality industry in Kenya with the supply growing by a 5-year CAGR of 23.6% between 2011 and 2016 and is expected to continue with the same trajectory in the future with current occupancies being 72.1%. The serviced office concept has also grown in popularity among users due to the convenience and flexibility. Among developers and providers, the concept is attractive due to the high returns it offers with average rental yields of 13.4% at 66.1% occupancy compared to 9.2% for conventional offices at 84.3% occupancy levels. In addition, there will be more traction in the hospitality sector with the growing popularity of fractional home ownership driven by the growing demand; and
- Alternative Fundraising following the capping of interest rates at 14.0% which has led to low credit supply hence developers are likely to find other innovative ways of raising funds. Some of which include project notes and Real Estate Investment Trusts (REITs).
The table below summarizes the various real estate themes and the possible impact on the business environment in 2018. With 3 indicators being positive, 2 at neutral and 1 negative, the general outlook for the sector in 2018 is neutral, compared to our 2017 outlook, where 4 indicators were positive and 1 neutral and Listed real estate was negative. The 2018 outlook has shifted to neutral due to retail sector shifting from positive to neutral as a result of increase in retail supply as well as internal challenges facing some local retailers leading to the closure of some of their retail stores. The real estate sector however has pockets of value such as residential sector, Grade A offices, serviced offices and MUD’s.
|
Thematic Performance Review and Outlook |
|||
|
Theme |
2017 Performance |
2018 Outlook |
Effect |
|
Residential |
|
· We expect the sector’s performance to improve in 2018 with the value of residential completions increasing by at least 13.9% as the market records increased investment activity following the conclusion of elections. We thus expect the uptake, yield, rents and prices to increase by 2.4% points, 0.5%, 5.5% and 7.7%, respectively, y/y · The best areas to invest in apartments are Ridgeways and Kilimani due to high uptake and market returns of 18.4% and 15.4%, respectively as well as ongoing infrastructural development while Juja and Runda Mumwe offer the best investment opportunity for detached units owing to high uptake and returns to investors of 17.3% and 12.0%, respectively. |
Positive |
|
Commercial |
· Performance of the commercial office theme softened in 2017 with occupancy rates declining by 3.4% from 88.0% to 84.6% and rental yields declining by 0.2% points to 9.2% from 9.4% in 2016 · There was an increase in the number of developments with notable developments launched in the year including Cytonn Towers, FCB Mirhab both in Kilimani, and Pinnacle in Upperhill. An oversupply in the sector with the Nairobi region currently experiencing an oversupply of 3.2mn SQFT, that is forecasted to increase by 21.9% in 2018 to 3.9mn SQFT |
· We forecast a decline in yields by 0.2% points to 9.0% in 2018 from 9.2% in 2017 as a result of oversupply. With the average occupancy rates expected to decrease by 1.4% points from 84.6% to 83.3% and sales price dropping by 1.4% to Kshs. 12,875 · We do not foresee an increase in rental rates with average rates per SQFT expected to decline to Kshs 98 from Kshs 101 · The sector, however, has pockets of value in differentiated concepts such as Grade A offices and serviced offices that attract yields of 10.0% and 13.4%, respectively |
Neutral |
|
Retail |
· Performance of the retail sector softened, as a result of the tough operating environment constrained by an extended electioneering period, struggling retail chains grappled with the effects of poor of financing and poor supply chain management as well as increased supply · Occupancy rates declined by 9.0% points, from 89.3% to 80.3% between 2016 and 2017 in Nairobi triggered by an increase in of mall space by 41.6% y/y from 3.9mn SQFT to 5.6mn SQFT in 2017. Notable malls opened in the year include the Southfield Mall in Embakasi · Rental yields declined from 10.0% in 2016 to 9.6% as a result of lower occupancy rates, occasioned by increased supply |
· Returns are expected to soften as a result of increased supply and the slowdown of traditional retailers such as Uchumi and Nakumatt. Occupancy rates are expected to decline by 0.8% points to 79.5% from 80.3% leading to reduced yields of 9.2% from 9.6%
· However, we expect increased investments by international retailers as they try to cash in on the gap left by local retailers as well as increase in retail space in areas such as Gigiri in Nairobi with low supply and in County Government Headquarters. |
Neutral |
|
Hospitality |
· Declined performance with ADR, RevPAR and Occupancy in Nairobi coming at USD 125.5, USD 61.2 and 49.0% compared to USD 137.0, USD 72.0 and 53.0% in 2016, respectively due to political instability during the elections period |
· Stabilising political situation, growth of MICE and domestic tourism, sustained international business and travel tourism and marketing efforts will drive recovery with room occupancy expected to increase by 4.0% points, ADR by 11.0% and RevPAR by 20.6% |
Positive |
|
Mixed-use Developments |
· Increased uptake with a live-work-play-invest mix for both end users and also investors, leading to an increase in yields and occupancy levels |
· The real estate sector is to embrace the concept of Mixed Use Developments, with Montave in Upper Hill, Pinnacle Towers in Upper Hill, Le Mac in Westlands and Cytonn Towers in Kilimani expected to come in to the market, either completed or with construction having commences, in the 2018. · Yields of 11.0% and occupancies of 95.0% will lead to increased investor interest |
Positive |
|
Land |
· Capital appreciation came in at 6.4% in 2017 from 17.6% in 2016 due to the political uncertainty brought about by the extended electioneering period · This was due to some sectors such as Riverside, Old Muthaiga and Ruai witnessing a land price correction with prices dropping by (0.5%), (7.2%) and (5.8%), respectively, over the same period. |
· In 2018, we expect the performance to remain positive, informed by the historical performance over 6 years, as from 2011 to 2017 with an annual capital appreciation of 10.2% in 2018, as the market recovers from the 2017 deep due to the reduced economic activities as a result of the prolonged electioneering period · The best areas to invest in are areas zoned for high rise residential areas such as Kilimani, Dagoretti, Ridgeways, and Kileleshwa and Satellite Towns, unserviced land with an expected capital appreciation of 13.8% and 13.0%, respectively |
Positive |
|
Listed Real Estate |
· The share price declined by 48.4% to Kshs 10.7 per share from Kshs 20.75 at the time of listing in 2015 and 10.8% lower than Kshs 12 at the beginning of 2017 · The performance has been largely limited by a poor market sentiment with investors preferring other investments such as stocks attributable to the sector’s poor dividend yields |
· We expect the price of the instrument to average at Kshs 11.3, based on its relatively stable 2017 performance · As developers seek capital to fund their real estate ventures, leading to a better market sentiment hence leading to more uptake · The dividend yield is expected to remain the same at 5.9% given that the asset composition in the REIT remains unchanged. |
Negative |
Residential Sector
In 2017, the residential sector’s performance slowed down largely attributable to the extended electioneering period, which led to investors adopting a wait and see attitude, especially for areas known to be more volatile as well as a tough credit environment for both developers and end users. Returns in the sector, as a result, declined by 2.6% points to 10.3% from 2016’s average of 12.9%. In 2018, however, we expect the market to recover given that the fundamentals supporting the sector remain intact. The best areas to invest in apartments are Ridgeways and Kilimani due to high uptake and market returns of 18.4% and 15.4%, respectively as well as ongoing infrastructural development while Juja and Runda Mumwe offer the best investment opportunity for detached units owing to high uptake and returns to investors of 17.3% and 12.0%, respectively.
In 2018, the residential sector will be shaped by the following activities:
- Relaxed Zoning Regulations: The County Government of Nairobi passed a bill that proposes the rezoning of Loresho, Kyuna and Spring Valley from low rise to high-density residential zones. We expect land prices in these areas to increase as was the case in Kilimani, which when regulations were relaxed, the area recorded price appreciation in excess of 22.8% p.a. over the last decade. This is expected to lead to increased demand for detached units in other areas such as Karen, Runda and Muthaiga, which will be among the few high-end suburbs offering exclusivity and low densification as well as increased real estate activity in the mapped-out areas;
- Sustained Demand: The current cumulative housing deficit in Kenya stands at 2.0 mn units, and growing annually by 200,000 units, according to National Housing Corporation. There is this high demand of residential units which will be driven further by positive demographics such as a population growth of 2.6% p.a against a global average of 1.2%, a high urbanization rate of 4.4% versus a global average of 2.1%; and
- Affordable Housing Initiative: The government named affordable housing as one of its “Big Four” Pillars for the 2017-2022 Term, and thus we expect renewed efforts in addressing the housing deficit and more government incentives for developers of the same. The Principal Secretary (PS) for Ministry of Housing and Urban Development, Ms. Aidah Munano announced plans to offer incentives to the private sector worth Kshs 40.0 bn with an aim to deliver 4.3 mn housing units by 2030. By working hand-in-hand with savings and credit co-operative societies, the government can enable home ownership to all income populations through enhanced credit arrangements such as the 5% interest rates on mortgage loans on monthly reducing balance for civil servants and tenants purchase program for the low-income population spectrum. For the supply side, this will be achieved by lowering constructions costs for developers by offering affordable serviced land and encouraging alternative building technologies in the market.
The table below shows our projections for the residential sector in 2018, based on previous trends for each of the metrics:
| Residential Sector Projections for 2018 | |||||
|
Metric |
2016 |
2017 |
Average Change |
2018 (F) |
Reason for Forecast |
|
Value of Residential Completions (Kshs. bn) |
70.1 |
79.8 |
13.9% |
90.9 |
The value of residential buildings is expected to continue on an upward trajectory to grow to at least Kshs 90.9 bn driven by increased housing stock from both the government and private developers despite 18.4% reduction in approvals in 2017 |
|
Uptake |
84.3% |
86.7% |
2.4% |
89.1% |
From the Cytonn Research, we expect housing deficit to come in at 2.0 mn for the Nairobi region. From this, we expect uptake to increase by 2.4% points, particularly as the government enables uptake through provision of affordable mortgages |
|
Rental Yield |
4.9% |
5.2% |
0.5% |
5.7% |
With a sustained demand for rental properties, we expect rental yields to come in at 5.7% supported by 5.5% increase in rental rates and a 7.7% increase in prices |
|
Price Per SQM |
107,137.0 |
113,431.0 |
7.7% |
122,165.2 |
Price appreciation is expected to come in at 7.7%, as the market picks up from last year’s softened growth due to unfavorable macroeconomic conditions and political headwinds. This will be supported by increased effective and speculative demand as well as upward economic growth |
|
Rent Per SQM |
540.1 |
548.5 |
5.5% |
578.7 |
Rental rates are expected to increase by 5.5% supported by infrastructural developments and as affordability remains out of reach for many prospective buyers. Unaffordability of homes push the market to be a renter’s, as evidenced by the low mortgage affordability index of 65, as per the Cytonn Mortgage Affordability Index |
Source: KNBS, Cytonn Research
We expect the sector’s performance to pick up in 2018 with the value of residential completions increasing by at least 13.9%, as the market records increased investment activity following the conclusion of elections. We thus expect the uptake, yield, rents and prices to increase by 2.4% points, 0.5%, 5.5% and 7.7%, respectively y/y.
During the month, Hass Consult released their Q4’2017 House Price Index Report. According to the report, the real estate market performance in 2017 significantly slowed down with asking prices for residential property sales declining by 4.1% y/y in 2017, despite the 1.0% q/q increases during the last quarter of the year while the asking rents declined by 3.9% y/y and 1.2% q/q.
In line with this, Kenya Bankers’ Association also released their Q4’2017 Housing Price Index. As per the report, price appreciation in the last quarter of 2017 came in 0.68%, a marginal increase from the previous quarter’s 0.4%, the lowest during the year. The report attributed the poor performance to decline in credit advancement and the protracted political period of Q3’2017.
Commercial Sector
Similar to the residential market, the commercial office market softened in 2018 as a result of the tough operating environment characterized by low credit supply, extended electioneering period and increased competition as a result of increased supply in the sector. In 2018, we expect a slight slowdown in performance mainly as a result of oversupply specifically in the commercial office theme, which is expected to have an oversupply of 3.9 mn SQFT, 21.9% higher than the oversupply of 3.2 mn SQFT in 2017. The sector, however, has pockets of value in differentiated concepts such as Grade A offices and serviced offices that attract yields of 10.0% and 13.4%, respectively, as well as areas with a low supply of both retail and office spaces such as Gigiri in Nairobi and in County Government Headquarters.
Commercial Office
The key drivers of the commercial office theme in 2018 will be:
- Nairobi as a Regional Hub – Nairobi has positioned itself as a regional and continental hub and has thus attracted multinationals who set up both regional and continental offices these include JP Morgan Chase and Isuzu Motors Ltd who officially launched Isuzu East Africa. These companies create demand for office space in key commercial areas,
- Growth of Professional Services and SMEs – Small and Medium Enterprises (SME) contribute to approximately 45% of Kenya’s GDP, 80% of employment in Kenya and constitute 98% of businesses locally according to a CNBC News Report 2014 and are thus a key driver for the commercial office sector, and
- Devolution - Devolution has created demand for office spaces in counties to cater for County Governments and businesses that are expanding to county headquarters and thus increased real estate development. For instance, Cytonn Investments announced plans to expand operations to Nyeri with potential real estate developments worth Kshs 6 bn, and Fusion is developing a Kshs 3.7bn MUD in Meru County.
The main challenge that will affect the sector’s expected performance will be oversupply with the sector expected to have an oversupply of 3.9mn SQFT in 2018 a 21.9% increase from 2017’s oversupply of 3.2 mn SQFT.
The table below summarizes the performance for office from 2011 to 2018 and our forecast for 2018:
|
Summary of Commercial Office Returns in Nairobi Over Time |
||||||||
|
Year |
FY'11 |
FY'13 |
FY’15 |
FY’16 |
FY’17 |
Annualized Change 2013-2017 |
2018F |
Reason for Forecast |
|
Occupancy (%) |
91.0% |
90.0% |
89.0% |
88.0% |
84.6% |
(1.4%) |
83.3% |
Given the expected increase in oversupply of 21.9% from 3.2mn SQFT in 2017 to 3.9mn SQFT in 2018, we expect occupancy rates to continue on the downward trend to average at approximately 83.3% in 2018 |
|
Asking Rents (Kshs/Sqft) |
78 |
95 |
97 |
103 |
101 |
1.5% |
98 |
Despite the marginal increments over the last four years, we do not foresee an increase in rents in 2018 and we expect the rents to soften slightly, reducing by 3.0% to average at Kshs 98 per SQFT per month |
|
Average Prices (Kshs/Sqft) |
10,557 |
12,433 |
12,776 |
13,003 |
13,058 |
1.2% |
12,875 |
Despite the marginal increase over the last four years, as a result of the increased supply we expect the prices to drop by 1.4% similar to the occupancies and average at Kshs 12,875 |
|
Average Rental Yields (%) |
9.8% |
10.0% |
9.3% |
9.4% |
9.2% |
(0.2%) |
9.0% |
We expect office yields to soften slightly by 0.2% points to average at 9.0% in the Nairobi market mainly as a result of an increase in supply the lower occupancy rates |
|
We expect the performance of the commercial office theme to soften further in 2018 with average yields and occupancy rates coming in at 9.0%, and 83.3%, respectively, from 9.2% and 84.6% in 2017 mainly as a result of the increase in supply. The sector will thus witness a reduction in development activity. There are pockets of value for investment in the sector in concepts with low supply and high returns such as Grade A offices and Serviced offices, which have rental yields of 10.0% and 13.4% and a market share of 10.0% and 0.35%, respectively. |
||||||||
Source: Cytonn Research
Our outlook for the commercial sector is neutral as the sector’s performance continues to be constrained by the oversupply, with the Nairobi region expected to experience an oversupply of up to 3.9mn SQFT. The sector, however, has pockets of value in differentiated concepts such as grade A offices and serviced offices that attract yields of 10.0% and 13.4%, respectively, as well as areas with low supply office spaces such as Gigiri in Nairobi and County Government Headquarters.
Retail
The key drivers to the retail sector in 2018 will be:
- Increased Foreign Investment – Foreign retailers have been making inroads in the country as they seek to cash in on the gap left by some major local chains that closed some stores due to finance and supply chain management issues we expect the sector to continue attracting foreign retailers who are also attracted by a stable economic growth, with an average GDP growth of 5.4% over the last five years,
- E-Commerce – Retailers are increasingly adopting e-commerce as a way to expand their market and offer their clients convenience. For instance, in 2017, Naivas and Deacons invested Kshs. 180mn and Kshs 10 mn in e-commerce, respectively, and with increased technology adoption we expect more retailers to take up e-commerce,
- Positive Demographics - Characterized by population growth rates that currently stand at 2.6%, 1.4% points higher than global averages of 1.2%, (ii) urbanization rates of 4.4% against global averages of 2.1%, and (iii) an expanding middle class with increased purchasing power due to higher disposable incomes which creates demand for retail products and thus boost the retail sector,
- Prudent Financial Management – Retailers will adopt a more institutionalized management in 2018, to curb on financial constraints due to poor administration that has led to closure of some of the local retailers stores such as Nakumatt and Uchumi.
The sector will, however, be constrained by increasing supply as a result of the proliferation of malls in key urban cities. In Nairobi alone, 1.7mn SQFT mn of space was added in 2017 due to the opening of Two Rivers Rosslyn Riviera and Next Gen Mall among others. The supply is expected to grow by a 3-year CAGR of 7.3% to 6.9mn SQFT in 2020.
The table below summarizes the performance for retail from 2016 and 2018F
|
Nairobi’s Retail Sector Performance 2016-2018F |
|||||
|
Item |
FY’ 2016 |
FY’ 2017 |
2018F |
∆ Y/Y |
Reason for Forecast |
|
Asking Rents (Kshs/SQFT) |
206.2 |
185.2 |
183.5 |
(0.9%) |
We expect asking rents to soften, reducing by 0.9% to Kshs 183.5 from Kshs 185.2 as a result of increased supply |
|
Supply in Nairobi (mn SQFT) |
5.4 |
5.6 |
5.8 |
4.1% |
Supply of retail space is expected to increase by 4.1% to 2018, 5.8 mn SQFT due to the opening of malls such as Southfield Mall in Embakasi that will add 269,000 SQFT in retail space. |
|
Occupancy (%) |
89.3% |
80.3% |
79.5% |
(0.8%) |
Due to the expected increase in as a result of the opening of South Field Mall in Embakasi others in the pipeline such as Comesa Mall in Eastlands, Mountain View Mall along Waiyaki Way and Karen Water Front in Karen, we expect occupancy rates to decline by 0.8% points to 79.5% |
|
Average Rental Yields |
10.0% |
9.6% |
9.2% |
(0.4%) |
Mainly as a result of increase in supply and thus lower occupancy rates, we expect retail yields in Nairobi to soften slightly by 0.4% points to average at 9.2% |
Our outlook for the retail sector is neutral as a result the increase in supply as well as internal challenges facing some local retailers leading to the closure of some of their retail stores. The entrance of international retailers is however expected to cushion the market.
During the month, the sector recorded heightened activity as seen through local retailers such as Naivas and Tuskys increasing their nationwide spread and international retailers such as Carrefour and Choppies continuing to create inroads while new retailers such as the Japanese Minisou continued to set up shop in the region.
Hospitality Sector
In 2016, the hospitality sector registered a slight decline in performance with the ADR (Average Daily Rate), RevPAR (Revenue per Available Room), and Occupancy in Nairobi coming in at USD 125.5, USD 61.2 and 49.0% compared to USD 137.0, USD 72.0 and 53.0% in 2016, respectively, as a result of the elections which caused political instability. In addition, serviced apartments recorded lower occupancies of 72.1% compared to 81.8% in 2016.
The factors that will impact the direction of the hospitality market in 2018 include:
- Increased Room Supply - In 2018, we expect increased room supply and bed capacity with Nairobi alone set to register the opening of at least 751 additional rooms in hotels, some of which include City Lodge, at Two Rivers Mall, Movenpick Hotel in Westlands and Hilton Garden Inn along Mombasa Road. This will result in better hotelier standards as global brands such as Movenpick enter the Kenyan market and as hotels aim to maintain their market presence in an increasingly competitive market,
- Continued Marketing Efforts- The Treasury Minister, for the Financial Year 2017/18 allocated Kshs 1.0 bn for tourism recovery and Kshs 1.0 bn for sustaining new markets in order to continue marketing Kenya as a tourist destination. Given the significant improvement recorded in 2016 in the sector, the allocation is 55.5% lower than the 2016/17 allocation of Kshs 4.5 bn, but will still have a positive impact in driving demand for tourism and hospitality services,
- International Conferences - Given the conclusion of the elections and Nairobi’s status as a regional hub, we expect the city to host several international conferences in 2018 including the 2nd African Quaternary (AFQUA) conference and various conferences sponsored by the International Institute of Engineers and Researchers. These will result in an increase in demand for accommodation and conference services,
- Domestic Tourism - The number of Kenyan bed-nights increased by a CAGR of 5.8% between 2012 and 2016 showing the growth in domestic tourism while the number of local conferences grew by a CAGR of 3.0% during the same period, with local conferences accounting for 92.4% of total conferences held in the country. We expect the trend to continue given the completion of the Standard Gauge Railway (SGR) that has eased access to and from the Coast and government incentives such as scrapping of VAT from National Park fees, and
- Infrastructure- We expect continued infrastructural development by the government with to boost the sector by allowing ease of movement into and within the country. Some of the projects underway include; the expansion of the Malindi International Airport, and completion of the Dongo Kundu Bypass allowing ease of travel to the South Coast.
With the stabilizing political environment, improved security and continued marketing, we expect an 11.0% increase in international arrivals for both business and holiday purposes in 2018, which will result in demand for hospitality services. Despite the expected increase in room supply, these factors and the continued growth of MICE and domestic tourism will result in better performance of the hospitality sector in 2018 with bed occupancy rates expected to rise by 1.4% points. In Nairobi alone, we expect the ADR to increase by between 11.0% and 19.0% y/y to average at between USD 139.3 and USD 150.0, average room occupancy to increase by 4.0% points to average at 53.0% resulting in an increase in RevPAR by between 20.6% and 29.9% y/y to average at between USD 73.8 and USD 79.5.
|
Nairobi Hospitality Sector Performance Projections 2018 |
||||||
|
Factor |
2014 |
2015 |
2016 |
2017* |
2018F |
∆ 2017/18 |
|
International Visitor arrivals ('000) |
1,350 |
1,181 |
1,340 |
1,453 |
1,612 |
11.0% |
|
Total Bed Nights ('000) |
6,282 |
5,879 |
6,449 |
6,584 |
7,244 |
10.0% |
|
Total Beds Available ('000) |
19,877 |
20,187 |
21,259 |
22,351 |
23,499 |
5.1% |
|
Kenya Bed-Night Occupancy Rate |
31.6% |
29.1% |
30.3% |
29.5% |
30.8% |
1.4% |
|
Nairobi Room Occupancy Rate |
54.0% |
53.0% |
53.0% |
49.0% |
53.0% |
4.0% |
|
Nairobi ADR (USD) |
145.2 |
142.9 |
137.0 |
125.5 |
139.3 |
11.0% |
|
Nairobi RevPAR (USD) |
77.5 |
75.9 |
72.0 |
61.2 |
73.8 |
20.6% |
|
*2017 figures are projected based on KNBS Leading Economic Indicators, October 2017 issue |
||||||
Source: KNBS, Cytonn Research 2018
During the month, the sector continued to show signs of recovery bagging several international awards such as, (i) The Travel Corporation (TTC), listed Kenya as one of the top 10 transformative travel experiences in the world citing the 11-day East African Safari that heads off to the Maasai Mara as well as Tanzania’s Serengeti and (ii) Trip Advisor ranked Nairobi the 3rd best place to visit in 2018 only behind Ishigaki Island in Japan and Kapaa in Hawaii with top attraction sites in Nairobi according to the ranking being Giraffe center, Karen Blixen Museum and the Black Rhinos at the National Park of Nairobi. Additionally, the United States revised its travel advisory warning against Kenya urging US visitors to exercise caution when visiting and in relation, direct flights from Kenya to New York were launched.
Our outlook for hospitality for 2018 is positive given the (i) stabilizing political situation, (ii) sustained international business and travel tourism, (iii) growth of MICE and Domestic Tourism, (iv) government incentives to boost the sector, and (v) continued marketing to reach new markets such as Asia and America, all factors that will increase demand for hospitality services.
Mixed-use Developments
In recent years, a new trend is emerging of integrated mixed-use developments, these are composed of extensive retail space in malls, Grade A office spaces in office towers and residential precincts composed of apartments, villas and hospitality features. They Include Garden City, Two Rivers, Le Mac and The Hub. The growing popularity in mixed use developments is driven by the fact that they have several advantages, including:
- Higher rates
- Higher occupancy
- Efficient use of space
- Economies of scale
The real estate sector is to embrace the concept of Mixed Use Developments, with Montave in Upper Hill, Pinnacle Towers in Upper Hill, Le Mac in Westlands and Cytonn Towers in Kilimani expected to come in to the market, either completed or with construction having commences, in the 2018. This trend is backed by the MUD’s high returns, for MUD comprising of Office and retail recording an average rental yield of 11%, at 95% occupancy rates, as shown below:
(all values in Kshs unless stated)
|
MUD Analysis |
||||||||
|
Name of Property |
Initial Price SQFT |
Current Price SQFT |
Yield |
Value Appreciation Per annum |
Sales Achieved |
Occupancy |
Weighted Price |
Yield |
|
Adlife Plaza |
13,500 |
15,500 |
10.1% |
5.0% |
93% |
93% |
9,687 |
14.8% |
|
Sifa Towers |
11,000 |
13,000 |
12.0% |
0.0% |
91% |
91% |
11,700 |
10.7% |
|
Timau Plaza |
9,500 |
12,500 |
10.0% |
5.0% |
|
100% |
10,750 |
10.3% |
|
Green House Building |
9,000 |
14,000 |
9.0% |
9.0% |
100% |
95% |
11,200 |
9.9% |
|
K-Rep Center |
10,000 |
13,000 |
10.6% |
4.0% |
|
95% |
9,750 |
9.3% |
|
Average |
10,600 |
13,600 |
10.3% |
4.6% |
95% |
95% |
10,618 |
11.0% |
Source: Cytonn Research
Land
In the year 2017, land in Nairobi Metropolitan Area recorded positive performance with an annual capital appreciation of 6.4% translation to a 6-year CAGR of 17.4%, despite the political uncertainty brought about by the extended electioneering period.
In 2018, we expect the sector’s performance to remain positive, driven by the conclusion of the 2017 electioneering period, population growth and urbanization currently at 2.6% and 4.4% p.a, respectively, improved infrastructure, the relaxation of zoning regulations, increased demand for development land in satellite towns, economic growth with an average GDP growth rate of more than 5.0% over the last five-years and legal reforms in the land administration.
The key challenges expected to affect the sector’s performance include: (i) high land costs up to Kshs 550 mn in areas such as Upperhill, hence impacting on financial viability on return to investor, (ii) communal ownership of land hindering land transfer, (iii) difficult legal environments such as lack of clarity between the mandate of the National Land Commission (NLC) and the Ministry of Lands, and (iv) physical challenges such as inadequate clean water, sewer and poor roads mainly in satellite towns.
Market Outlook
In 2018, we expect the performance to remain positive, based on the stable performance over the last 6-years that is from 2011 to 2017. From our analysis we expect the market to record an annual capital appreciation of 10.2% in 2018, as the market recovers from the 2017 deep where the appreciation averaged at 6.4%, 11.2% points lower than the 17.6% recorded in 2016 mainly as a result of reduced economic activities due to the prolonged electioneering period.
The summary of the performance of the theme over the last 6-years and 2018 outlook is as outlined below:
|
All values in Kshs unless stated otherwise |
|||||||||
|
Summary of the Performance Review and Outlook across all regions |
|||||||||
|
Location |
*Price 2011 |
*Price 2015 |
*Price 2016 |
*Price 2017 |
*Price 2018f |
6-year CAGR |
Price change from 2011 |
Annual Capital appr. (2017) |
Annual Capital appr. (2018) F |
|
Satellite Towns - Unserviced Land |
9m |
16m |
21m |
22m |
25m |
18.5% |
2.9x |
7.8% |
13.8% |
|
Nairobi Suburbs - High rise residential Areas |
46m |
80m |
97m |
103m |
117m |
15.7% |
2.4x |
7.6% |
13.0% |
|
Nairobi Suburbs - Low Rise Residential Areas |
56m |
91m |
106m |
109m |
121m |
13.1% |
2.1x |
6.0% |
10.8% |
|
Satellite Towns - Site and service schemes |
6m |
13m |
14m |
15m |
16m |
18.9% |
3.2x |
6.3% |
9.0% |
|
Nairobi Suburbs - Commercial Areas |
156m |
377m |
458m |
478m |
499m |
20.7% |
3.1x |
4.4% |
4.4% |
|
Average |
|
|
|
|
|
17.4% |
2.7x |
6.4% |
10.2% |
|
· Average land price in Nairobi Metropolitan Area is expected to grow by an annual capital appreciation of 10.2% as it recovers from the reduced economic activities as a result of the extended electioneering period in 2017 · The commercial zones are expected to retain an annual capital appreciation of 4.4% due to the high supply of office space in these areas hence less attractive to investors |
|||||||||
*Asking prices of land are per acre.
Source: Cytonn Research
During the month, Hass Consult released their FY’2017 Land Price index. As per the report, land recorded modest gains of 3.3% y/y compared to 5.1% y/y in 2016. The decline in performance has been attributed to a sluggish property market with the slowdown in inquiries resulting from the protracted electioneering process.
We retain a positive outlook, with bias to Satellite Towns, unserviced land and areas zoned for high rise residential areas such as Kilimani, Dagoretti, Ridgeways, and Kileleshwa, with an expected capital appreciation of 13.8% and 13.0%, respectively, supported by relaxation of zoning regulations and increased investment in infrastructure including roads and sewerage.
Listed Real Estate Outlook 2018
The Fahari REIT share price came in at Kshs 10.7 at the close of 2017, a 48.7% decline from its initial listing value of Kshs 20.8 in November 2015 and 10.8% lower than Kshs 12 at the beginning of 2017. The performance has been largely limited by a poor market sentiment with investors inclining heavily towards brick and mortar real estate which offer higher yields at 10.0% for retail and 9.3% for office sector, and government securities’ average at 12.2%, respectively against an average yield of 5.9% earned from the REIT
Factors expected to impact the REITS market include:
- Institutionalization of Real Estate Investments: As more firms look for an easy access route into the real estate sector, we expect more corporations to come into the sector. Additionally, in a bid to diversify portfolios, we expect to see more local and institutional investors such as pension schemes and insurance funds investing in the sector to tap into the regular dividend income for their members as well as government incentives for the sector,
- Reduced Credit Supply: With the interest rates caps law, private sector credit growth has slowed coming at an average of 2.4% in January to October 2017, and thus developers require alternative sources of funds. The REIT offers an easy tool for pooling funds to enable development for investors and thus we expect increased uptake for the same.
Currently, the only listed REIT in Kenya risks delisting if it fails to meet the net real estate assets threshold of 75% set by Capital Markets Authority. Currently, the REIT has net assets totaling up to Kshs 2.4 bn which is 67.0% of total value and Kshs 245.0 mn lower than the set threshold. Having not acquired any other properties in 2017, the projected yields for 2017 was 5.9%, if the REIT company manages to reach the 75% real estate assets threshold by CMA.
Source: Bloomberg
The Capital Markets Authority has in 2017 tried to increase the attractiveness of the asset class with measures such as exclusion of the REITs from VAT in addition to Capital Gains Tax and Stamp Duty. This is a positive step towards boosting returns from the sector, but it has not yet had an impact on the asset class’s attractiveness.
We retain a negative outlook for the sector, however, attempts by key real estate industry players in the region to improve the market sentiment on REITs and other alternative investments and need for capital by developers is expected to drive uptake of the REIT. The dividend yield is expected to remain the same at 5.9% given the asset composition in the REIT remains unchanged.


