In 2022, the Kenyan equities market was on a downward trajectory with NASI, NSE 20 and NSE 25 declining by 23.7%, 12.4% and 16.6%, respectively. Large cap decliners in 2022 included Safaricom, Bamburi, KCB Group, Diamond Trust Bank (DTB-K) and Equity Group of 36.7%, 17.5%, 16.4%, 16.0% and 15.6%, respectively. The performance during the year was mainly attributable to increased sell offs by foreign investors as they exited the market. Additionally, interest rate hikes in developed economies such as United States caused dollar investments to be more appealing and thus lowering their appetite for risky investments in emerging markets such as Kenya.
Following the poor performance in the equities market in 2022, the market valuation closed the year at a price to earnings ratio (P/E) of 6.7x, 42.0% lower than the 11.5x recorded at the end of 2021 and 47.0% below the 12-year historical average of 12.6x. On the other hand, the equities market closed the year at a dividend yield of 6.6%, 2.5% points above the historical average of 4.1%. Additionally, equities turnover declined by 36.5% to USD 0.8 bn, from USD 1.3 bn recorded in FY’2021. Foreign investors remained net sellers, with a net outflow of USD 204.3 mn, compared to net outflows of USD 91.9 mn recorded in 2021. The year also saw 11 companies issuing profit warnings in 2022, as compared to 4 companies in 2021. The increase in number of companies that issued profit warnings in 2022 highlights the tough macro-economic environment occasioned by continued ripple effects of COVID-19 as well as the disruption of the global supply chain due to the ongoing Ukraine-Russia conflict which has led to high cost of production and consequently reduced consumer demand. Key to note, companies are required to issue profit warnings if they project a more than 25.0% decline in profits year-on-year. For more information, see our Cytonn Annual Markets Review-2022.
Kenyan 2023 Equities Outlook
In 2023, we project the following factors to affect the direction of the Kenyan equities market:
- Corporate Earnings Growth: We expect a slight improvement in the listed sector’s earnings growth in 2023, largely driven by the continued improvement in the country’s business environment. The improvement is evidenced by an average Purchasing Manager’s Index (PMI) of 51.1 for the last four months of 2022 which is expected to raise growth prospects. Additionally, the growth in Corporate Earnings is expected to be boosted by the successful expansion of operations into Ethiopian telecommunication industry by Safaricom, which currently controls 48.3% the entire bourse as of 27th January 2023. Further, we anticipate growth in the banking sector’s earnings as a result of expected increase in lending with the continued adoption of risk-based lending as well as revenue diversification strategies by banks. Notably, credit risk has also gradually eased with the industry’s non-performing loan ratio declining by 1.0% points to 13.7% in Q3’2022 from 14.7% in Q2’2022;
- Attractive valuations: The market valuations remained below the historical average, with NASI closing the year at a price to earnings ratio (P/E) of 6.7x, 47.0% below the 12-year historical average of 12.6x, and a dividend yield of 6.6%, 1.5% points above the historical average of 4.1%. Given these cheap valuations, we expect investors to take advantage of this and buy into the market;
- Capital Markets Investor Sentiment: We expect the equities market to register muted foreign interest in 2023, attributable to the uncertainties in the Kenyan macro-economic conditions occasioned by the elevated inflationary pressures. This resulted in high capital flights in 2022 as investors sought less risky investments such as government papers and other investment alternatives. On the flipside, we believe pockets of value still exist in the equities market due to the attractive valuations, with NASI trading 49.5% below its historical average;
- Diversification of Capital Markets and New Listings: We expect a number of activities to be undertaken by NSE in 2023 such as increasing the number of Single Stock Futures traded on the derivatives market. Currently, the bourse offers 6 Single Stock Futures namely Safaricom Plc, Kenya Commercial Bank Group Plc, Equity Group Holdings Plc, East African Breweries Ltd, ABSA Bank Kenya and British American Tobacco Plc. Additionally, we expect increased listing with the current administration in September 2022 announcing a target of 10 listings in one year. It is our view that the initiative to increase the number of listings would result in; (i) increased liquidity in the market by increasing the volume of securities available for trading, and, (ii) improved depth in the capital market by increasing product offerings at the exchange, consequently attracting investors;
- Monetary Policy Direction: In 2022, the Monetary Policy Committee (MPC) met 6 times, where they maintained the Central Bank Rate (CBR) at 7.00% and the Cash Reserve Ratio of 4.25% in the first two of the meetings of January and March 2022. However, the MPC raised the CBR rate by 50.0 and 75.0 basis points (bps) to 7.50% and 8.25% in May 2022 and September 2022, respectively. Further, the MPC hiked the CBR by an additional 50.0 bps to 8.75% in latest meeting in November 2022 in a bid to anchor inflation which is currently above the government’s target range of 2.5% - 7.5%. We expect the MPC to continue raising the CBR rates in the medium term in a bid to stabilize inflation within the government’s target range and also anchor the Kenyan shilling from further depreciation after recording a 9.0% depreciation in 2022. An increase in the CBR will result in higher yields in the fixed income market, which will in turn make government bonds more attractive compared to equities. An increase in the CBR will also result in lower liquidity in the market, leaving investors with less disposable income to invest.
Below, we summarize the metrics used in coming up with our 2023 Equities Outlook;
|
Equities Market Indicators |
Outlook for 2023 |
Current View |
|
Macro-Economic Environment |
· We expect the economy to grow at a slower pace given the gradual improvement in the general business environment in the country which has been dented by the elevated inflationary pressures occasioned by high fuel and food prices. Additionally, the Central Bank of Kenya’s Monetary Policy Committee decision to hike the Central Bank Rate (CBR) in a bid to curb inflation and maintain price stability is expected to curtail economic growth · Further, we expect the Agricultural sector to remain subdued largely due to erratic weather conditions. However, we expect the sector to be supported by the long rains witnessed across the country at the end of the year, coupled with recent fiscal policies such as subsidizing costs of crucial farm inputs such as fertilizers that will enhance growth in the sector |
Neutral |
|
Corporate Earnings Growth |
· We expect a slight improvement in the listed sector’s earnings growth in 2023, largely driven by the continued improvement in the country’s business environment. Corporate earnings growth is projected to come in at 10.6% for 2023 compared to the projected 7.8% growth in 2022, · Additionally, the growth in Corporate Earnings is expected to be boosted by the successful expansion of operations into Ethiopian telecommunication industry by Safaricom, which continues to control the largest bourse in the Nairobi Stock Exchange, · Further, we anticipate growth in the banking sector’s earnings as a result of expected increase in lending with the continued adoption of risk-based lending as well as revenue diversification strategies by banks |
Neutral |
|
Valuations |
· With the market closing the year 2022 at a P/E of 6.7x, and having an expected earnings growth of 10.6% in 2023, it is currently trading at a Forward P/E of 8.7x. This represents a potential upside of 32.2% compared to historical levels |
Positive |
|
Investor Sentiment and Security |
· We expect the equities market to register muted foreign interest in 2023, attributable to the uncertainties in the Kenyan macro-economic conditions occasioned by the elevated inflationary pressures. This caused high capital flights in 2022 as investors sought less risky investments such as government papers and other investment alternatives · On the flipside, we believe pockets of value still exist in the equities market due to the attractive valuations, with NASI trading 49.5% below its historical average |
Negative |
Out of the four metrics that we track, two have a “neutral” and one a “positive” outlook while one also a has a “negative”. Compared to 2022, we have maintained our positive outlook on the valuations of the market. In consideration of the above, we have a ‘’NEUTRAL” outlook on the Kenyan Equities market in the short term. However, we maintain our bias towards a “BULLISH” equities markets in the medium to long term, with the expectations of a slower growth in corporate earnings and the cheap valuations currently in the market.
Weekly Market Performance
During the week, the equities market recorded mixed performance, with NASI and NSE 25 gaining by 1.4% and 0.7%, respectively, while NSE 20 declined by 0.6%, taking the YTD performance to losses of 1.0% and 0.1% for NASI and NSE 20, while NSE 25 remained relatively unchanged. The equities market performance was mainly driven by gains recorded by large cap stocks such as Safaricom, EABL, Co-operative Bank and Standard Chartered Bank of Kenya (SCBK) of 3.1%, 2.1%,1.6% and 1.3% respectively. The gains were however weighed down by losses recorded by large cap stocks such as NCBA, Bamburi and Equity Group of 3.4%, 3.0% and 1.3%, respectively.
During the week, equities turnover declined by 77.2% to USD 8.4 mn from USD 37.0 mn recorded the previous week, taking the YTD turnover for the equities market to USD 61.0 mn. Additionally, foreign investors turned net buyers, with a net buying position of USD 0.4 mn, from a net selling position of USD 20.1 mn recorded the previous week, taking the YTD net selling position to USD 23.2 mn.
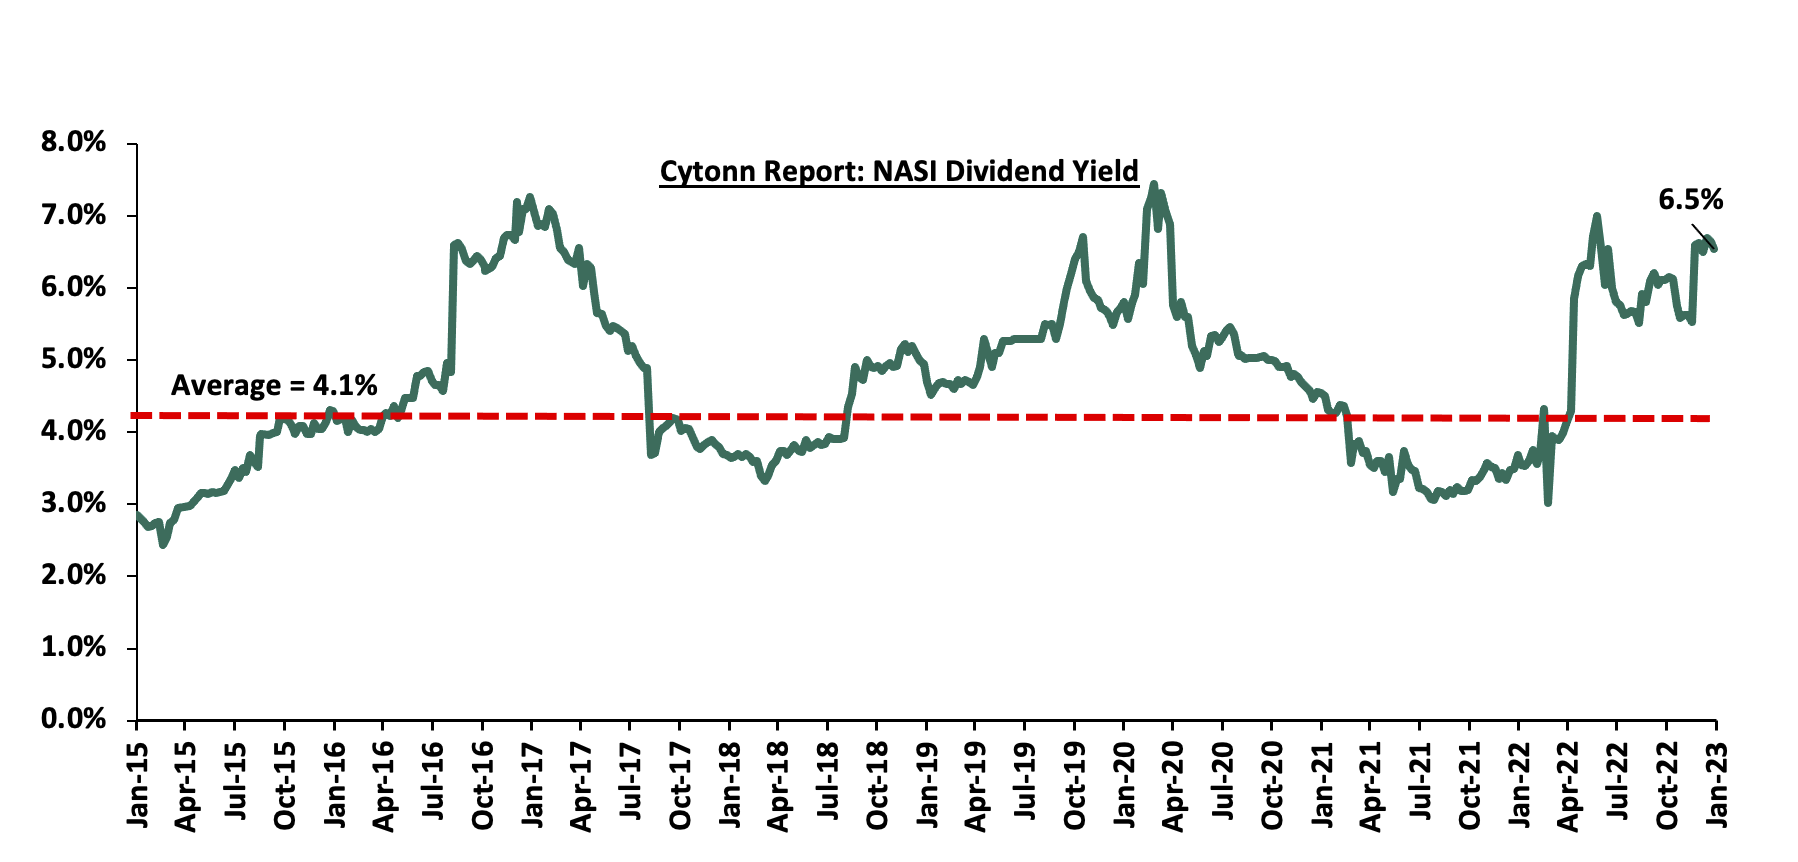
The market is currently trading at a price to earnings ratio (P/E) of 6.3x, 49.5% below the historical average of 12.5x, and a dividend yield of 6.5%, 2.4% points above the historical average of 4.1%. Key to note, NASI’s PEG ratio currently stands at 0.8x, an indication that the market is undervalued relative to its future growth. A PEG ratio greater than 1.0x indicates the market may be overvalued while a PEG ratio less than 1.0x indicates that the market is undervalued. The charts below indicate the historical P/E and dividend yields of the market;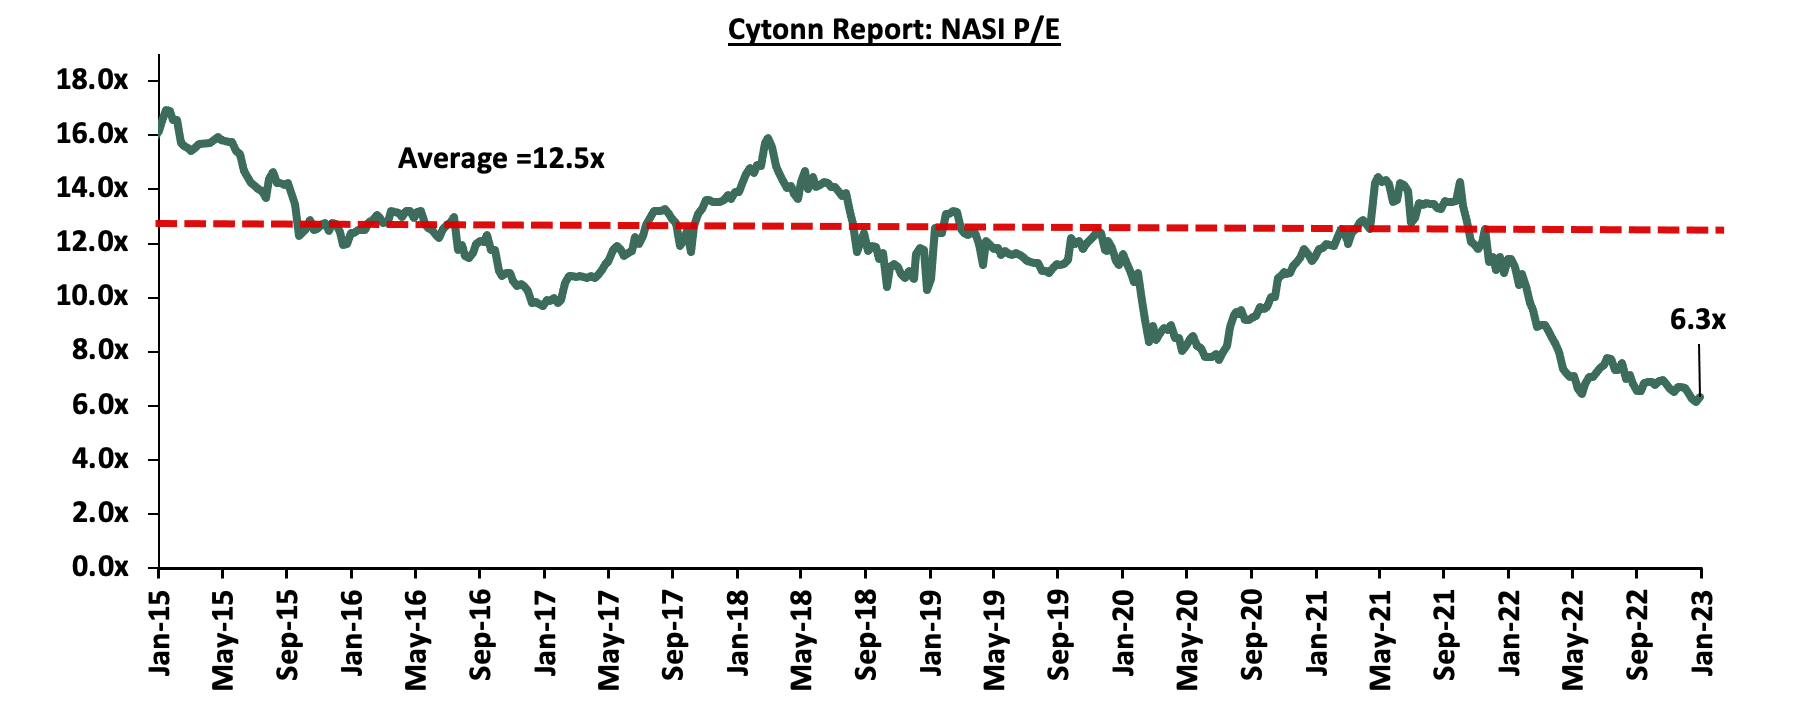
Source: Bloomberg
Source: Nairobi Stock Exchange
Weekly Highlight:
East African Breweries Plc (EABL) H1’2023 Financial Performance
During the week, East African Breweries Plc (EABL) released their H1’2023 financial results for the period ending 31st December 2022, recording a stagnation in the Profits After Tax (PAT) at Kshs 8.7 bn as was recorded in a similar period last year. The stagnation was mainly attributable to a 13.0% increase in Indirect Taxes to Kshs 47.4 bn in H1’2023, from Kshs 41.9 bn in H1’2022 that offset the 8.1% growth in Gross Sales to Kshs 104.7 bn in H1'2023 from Kshs 96.8 bn in H1'2022. The tables below show the breakdown of the Group’s financial performance;
|
Cytonn Report: East African Breweries Plc (EABL) Summarized Income Statement |
|||
|
Income Statement |
H1'2022 |
H1'2023 |
Y/Y Change |
|
Kshs (bn) |
Kshs (bn) |
||
|
Gross Sales |
96.8 |
104.7 |
8.1% |
|
Indirect Taxes |
(41.9) |
(47.4) |
13.0% |
|
Net Revenue |
54.9 |
57.3 |
4.3% |
|
Cost of Sales |
(28.4) |
(30.7) |
8.0% |
|
Gross Profit |
26.5 |
26.6 |
0.3% |
|
Operating Costs |
(11.4) |
(11.3) |
(0.5%) |
|
Net Finance Costs |
(2.2) |
(2.4) |
7.8% |
|
Profit Before Income Tax |
12.9 |
12.9 |
(0.2%) |
|
Income Tax Expenses |
(4.1) |
(4.2) |
0.3% |
|
Profit After Tax |
8.7 |
8.7 |
(0.4%) |
|
Earnings Per Share-Annualized |
16.9 |
17.3 |
2.1% |
Source: East African Breweries Plc (EABL) H1’2023 financial statements
|
Cytonn Report: East African Breweries Plc (EABL) Summarized Balance Sheet |
|||
|
Balance Sheet |
H1'2022 |
H1'2023 |
Y/Y Change |
|
Kshs (bn) |
Kshs (bn) |
||
|
Current Assets |
35.4 |
45.4 |
28.1% |
|
Non-Current Assets |
75.0 |
80.2 |
6.9% |
|
Total Assets |
110.4 |
125.6 |
13.7% |
|
Short term borrowings |
6.6 |
13.3 |
100.7% |
|
Other Current Liabilities |
35.2 |
41.7 |
18.5% |
|
Total Current Liabilities |
41.8 |
55.0 |
31.5% |
|
Long term Borrowings |
35.2 |
35.1 |
(0.1%) |
|
Other Non-Current Liabilities |
7.0 |
7.3 |
4.8% |
|
Total Non-Current Liabilities |
42.2 |
42.5 |
0.7% |
|
Total Liabilities |
84.0 |
97.5 |
16.0% |
|
Total Equity |
26.4 |
28.1 |
6.2% |
Source: East African Breweries Plc (EABL) H1’2023 financial report
Key take outs from the financial performance include;
- Net revenue increased by 4.3%, Kshs 57.3 bn in H1’2023, from Kshs 54.9 bn recorded in H1’2022, mainly driven by improved brand mix and pricing. Notably, Uganda and Tanzania subsidiaries recorded strong growth at 19.0% and 11.0% increase in net revenue, respectively while Kenyan net revenue declined by 1.0% as volume of sales reduced as a result of increase in excise duty tax during the period,
- Indirect Taxes increased significantly by 13.0% to Kshs 47.4 bn, from Kshs 41.9 bn attributable to multiple increases in excise duty taxes in Kenya during the period of review,
- Cost of sales increased by 8.0% to Kshs 30.7 bn, from Kshs 28.4 bn in H1’2022, mainly attributable to increased cost of inputs occasioned by heightened inflationary pressures at 9.1% in December 2022 as compared to 5.7% in the same period in 2021,
- The Group’s short term borrowing increased significantly by 100.7% to Kshs 13.3 bn, from Kshs 6.6 bn recorded in H1’2022, mainly attributable increased short term loans aimed at supporting the working capital as well as to cater for amortization of long term borrowings, and,
- Annualized Earnings per share increased by 2.1% to Kshs 17.3, from Kshs 16.9 in H1’2022, largely driven by a 3.9% increase in total comprehensive income attributable to equity holders to Kshs 7.9 bn, from Kshs 7.6 bn in H1’2022. Additionally, the board of directors has recommended an interim dividend of Kshs 3.75 per share expected to be paid by 28th April 2023.
Despite the challenging macroeconomic environment arising from elevated inflationary pressures couple with the government’s decision to increase excise taxes over the last 15 months, EABL has continued to display strong financial performance as evidence by the Profit After Tax (PAT) of Kshs 8.7 bn in H1’2023 as well as the 2.1% increase earnings per share in H1’2022. Going forward, we expect the volume of sales to drop in Kenya as a result of the high excise duty taxes that will weigh down on the Group’s overall performance and profitability. However, the Group’s announcement of an interim dividend of Kshs 3.75 per share for the period ending 31st December 2022 is expected to boost investors’ confidence in the Group’s stock. Further this comes at the time when Diageo Kenya has received requisite regulatory approvals for its proposed acquisition of an additional 15.0% stake in EABL to bring its shareholding to 65.0%, through a tender to minority shareholders. The Group announced that the tender offer will open on 6th February 2023 with transfer and settlement of shares expected to commence by 11th April 2023. The move reflects the strategic importance of EABL to the Group, having announced it will purchase each share at Kshs 192.0 which represents a 11.6% premium on the current share price of Kshs 172.0 as of 27th January 2023.
Universe of coverage:
|
Company |
Price as at 13/01/2023 |
Price as at 20/01/2023 |
w/w change |
YTD Change |
Target Price* |
Dividend Yield |
Upside/ Downside** |
P/TBv Multiple |
Recommendation |
|
Jubilee Holdings |
196.3 |
194.3 |
(1.0%) |
(2.3%) |
305.9 |
0.5% |
58.0% |
0.4x |
Buy |
|
Kenya Reinsurance |
1.8 |
1.8 |
0.0% |
(3.7%) |
2.5 |
5.6% |
45.0% |
0.1x |
Buy |
|
KCB Group*** |
38.4 |
38.5 |
0.3% |
0.4% |
52.5 |
7.8% |
44.1% |
0.6x |
Buy |
|
Sanlam |
8.3 |
8.3 |
0.0% |
(12.9%) |
11.9 |
0.0% |
42.8% |
0.9x |
Buy |
|
Liberty Holdings |
4.8 |
4.8 |
(0.6%) |
(4.8%) |
6.8 |
0.0% |
40.6% |
0.4x |
Buy |
|
ABSA Bank*** |
12.3 |
12.5 |
1.2% |
2.0% |
15.5 |
12.0% |
36.1% |
1.1x |
Buy |
|
Britam |
5.4 |
5.2 |
(2.2%) |
0.8% |
7.1 |
0.0% |
35.9% |
0.9x |
Buy |
|
Equity Group*** |
46.0 |
45.4 |
(1.3%) |
0.8% |
58.4 |
6.6% |
35.1% |
1.1x |
Buy |
|
I&M Group*** |
17.1 |
17.0 |
(0.6%) |
(0.3%) |
20.8 |
8.8% |
31.3% |
0.4x |
Buy |
|
Co-op Bank*** |
12.4 |
12.6 |
1.6% |
4.1% |
15.5 |
7.9% |
30.7% |
0.7x |
Buy |
|
NCBA*** |
38.3 |
37.0 |
(3.4%) |
(5.0%) |
43.4 |
11.5% |
28.8% |
0.8x |
Buy |
|
CIC Group |
1.9 |
1.9 |
(1.0%) |
(1.0%) |
2.3 |
0.0% |
22.8% |
0.7x |
Buy |
|
Diamond Trust Bank*** |
51.3 |
51.3 |
0.0% |
2.8% |
57.1 |
5.9% |
17.3% |
0.2x |
Accumulate |
|
Standard Chartered*** |
155.0 |
157.0 |
1.3% |
8.3% |
166.3 |
3.8% |
9.7% |
1.1x |
Hold |
|
Stanbic Holdings |
111.8 |
112.0 |
0.2% |
9.8% |
112.0 |
8.0% |
8.0% |
1.0x |
Hold |
|
HF Group |
3.1 |
3.3 |
4.8% |
4.1% |
3.4 |
0.0% |
4.6% |
0.2x |
Lighten |
|
*Target Price as per Cytonn Analyst estimates **Upside/ (Downside) is adjusted for Dividend Yield ***For Disclosure, these are stocks in which Cytonn and/or its affiliates are invested in |
|||||||||
We are “Neutral” on the Equities markets in the short term due to the current adverse operating environment and huge foreign investor outflows, and, “Bullish” in the long term due to current cheap valuations and expected global and local economic recovery.
With the market currently trading at a discount to its future growth (PEG Ratio at 0.8x), we believe that investors should reposition towards value stocks with strong earnings growth and that are trading at discounts to their intrinsic value. We expect the current high foreign investors sell-offs to continue weighing down the economic outlook in the short term.


