Following the release of the H1’2022 results by Kenyan listed banks, the Cytonn Financial Services Research Team undertook an analysis on the financial performance of the listed banks and identified the key factors that shaped the performance of the sector. For the earnings notes of the various banks, click thee links below:
- Equity Group H1’2021 Earnings Note;
- KCB Group H1’2022 Earnings Note;
- ABSA Bank Kenya H1’2022 Earnings Note;
- Standard Chartered Bank Kenya H1’2022 Earnings Note;
- NCBA Group H1’2022 Earnings Note;
- Cooperative Bank H1’2022 Earnings Notes;
- Diamond Trust Bank Kenya (DTB-K) H1’2022 Earnings Note;
- I&M Holdings H1’2022 Earnings Note;
- Stanbic Holdings H1’2022 Earnings Note;
- HF Group H1’2022 Earnings Note;
The Core Earnings per Share (EPS) for the listed banks recorded a weighted growth of 34.0% in H1’2022, from a weighted growth of 136.0% recorded in H1’2021 when the sector was recovering from a lower base. Additionally, the Asset Quality for the listed banks deteriorated, with the gross NPL ratio increasing marginally by 0.3% points to 13.0% in H1’2022, from 12.7% in H1’2021. The listed banks’ management quality on the other hand improved, with the Cost to Income ratio declining by 3.5% points to 53.6%, from 57.1% recorded in H1’2021, as banks continued to reduce their provisioning levels.
The report is themed “Earnings Growth Signify Banking Sector Resilience” where we assess the key factors that influenced the performance of the banking sector in H1’2022, the key trends, the challenges banks faced, and areas that will be crucial for growth and stability of the banking sector going forward. As such, we shall address the following:
- Key Themes that Shaped the Banking Sector Performance in H1’2022,
- Summary of the Performance of the Listed Banking Sector in H1’2022,
- The Focus Areas of the Banking Sector Players Going Forward, and,
- Brief Summary and Ranking of the Listed Banks based on the Outcome of Our Analysis.
Section I: Key Themes That Shaped the Banking Sector Performance in Q1’2022
Below, we highlight the key themes that shaped the banking sector in H1’2022 which include; regulations, regional expansion through mergers and acquisitions, asset quality and capital raising for onward lending:
- Regulation:
- Regulation of Digital Lenders: The Central Bank of Kenya (CBK) enacted the law to regulate digital lenders, granting the bank the authority to license and oversee previously unregulated digital credit providers. The regulations were published on 18th March 2022, and allowed digital lenders a period of six months to acquire licences from CBK and are aimed at protecting borrowers from uncharacterized practices of unregulated digital credit providers, particularly their high costs, unethical debt collection practices, and misuse of personal information. All digital lenders are expected to have registered with CBK by 17th September 2022 after which all those who fail to adhere to the regulations will cease operations, and,
- Risk-based Lending- The Central Bank of Kenya has been working on a risk-based lending model to price loans since the Interest Cap law was repealed in 2019. The model’s main goal is to allow banks to lend in line with the estimated risks of each borrower. As of August 2022, at least half of the banks had their models approved by the CBK. However, the approval rate for the models has been gradual in a bid to avoid causing distress to customers through high interest rates. Additionally, the full implementation has also been slowed down as a result of insufficient data to assess client’s risk profile.
- Regional Expansion through Mergers and Acquisitions: Kenyan banks are looking at having an extensive regional reach. In H1’2022, there was one acquisition by Centum Investments Company while KCB Group PLC also announced an acquisition after H1’2022 as follows:
- On 2nd August 2022, KCB Group PLC, announced that it had entered into a final agreement with shareholders of Trust Merchant Bank (TMB) to acquire an 85.0% stake in the Democratic Republic of Congo (DRC)- based lender, with an option to acquire the remaining stake after two years. If successful, the deal will make KCB Group the second Kenyan banking group to enter the DRC banking market after Equity Group Holdings. For this acquisition, KCB will pay a cash consideration based on the net asset value of TMB at completion of the proposed transaction using a Price to Book (P/B) multiple of 1.5x, subject to regulatory, shareholders and other approvals. We estimate a payment of Kshs 15.7 bn by KCB at the trading multiple of 1.5x given TMB’s book valueof FC 208.4 bn (Kshs 12.4 bn) as of 2020. For more information, please see our Cytonn Weekly #31/2022,
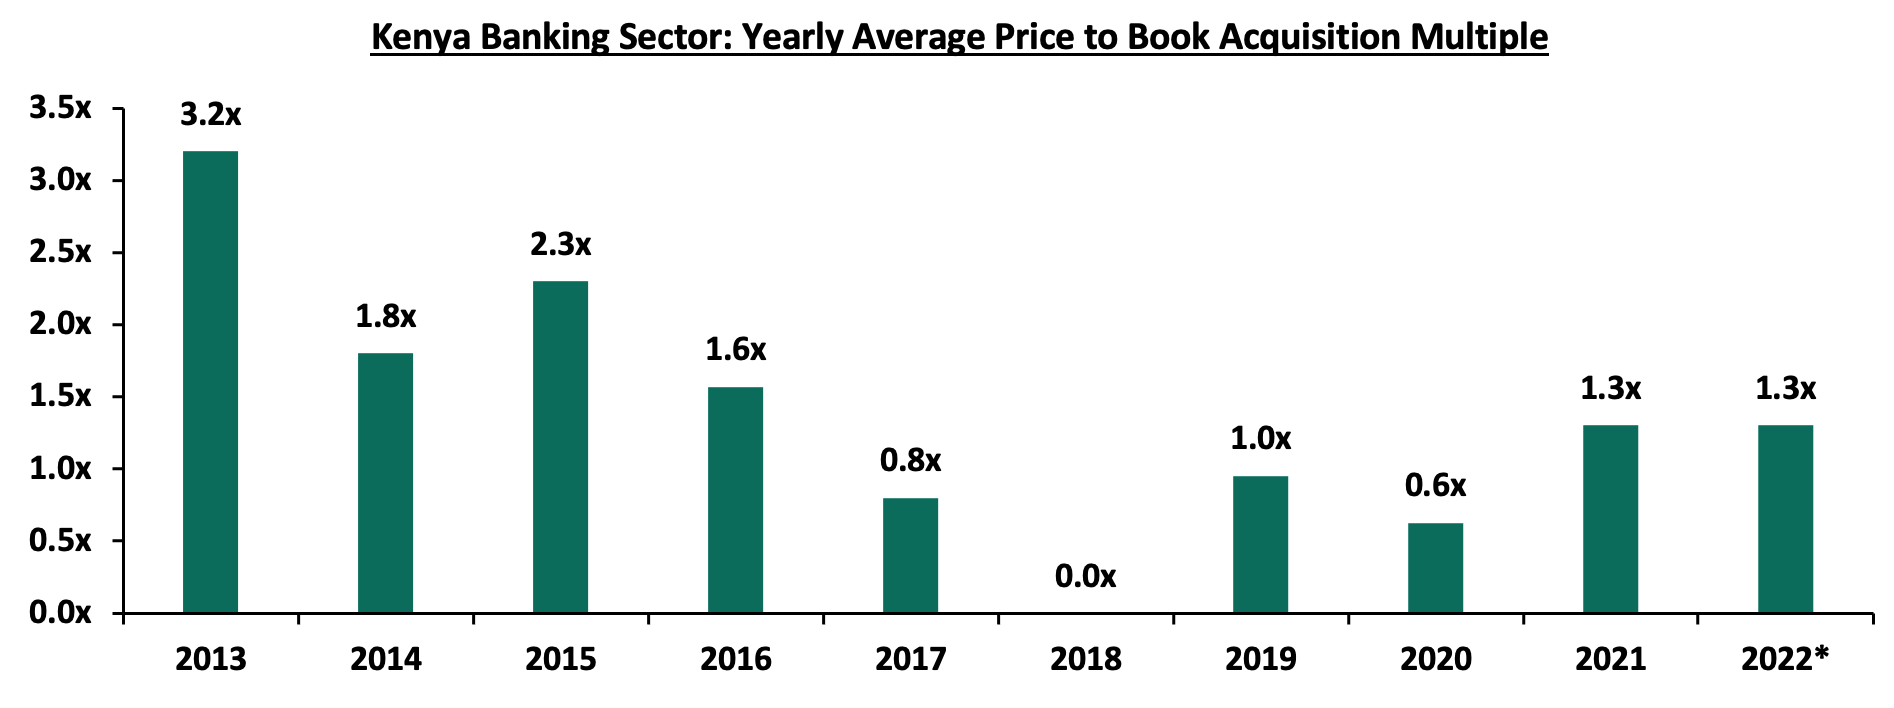
- Also on 8th June 2022, Centum Investment Company PLC, announced that it had entered into a binding agreement to sell its 83.4% shareholding in Sidian Bank to Access Bank PLC, for a consideration of Kshs 4.3 bn subject to relevant approval from the Central bank of Kenya and the Competition Authority of Kenya. The price consideration from Access Bank translates to a Price to Book Value (P/B) of 1.1x, which is lower than the 8-year acquisitions average P/B of 1.3x, but higher than the current average P/B of the listed banking stocks of 0.9x. For more information, please see our Cytonn Weekly #23/2022. Below is a summary of the deals in the last 9years that have either happened, been announced or expected to be concluded:
|
Acquirer |
Bank Acquired |
Book Value at Acquisition (Kshs bn) |
Transaction Stake |
Transaction Value (Kshs bn) |
P/Bv Multiple |
Date |
|
KCB Group PLC |
Trust Merchant Bank (TMB) |
12.4 |
85.0% |
15.7 |
1.5x |
August-22 |
|
Access Bank PLC (Nigeria) |
Sidian Bank |
4.9 |
83.4% |
4.3 |
1.1x |
June-22* |
|
KCB Group |
Banque Populaire du Rwanda |
5.3 |
100.0% |
5.6 |
1.1x |
August-21 |
|
I&M Holdings PLC |
Orient Bank Limited Uganda |
3.3 |
90.0% |
3.6 |
1.1x |
April-21 |
|
KCB Group** |
ABC Tanzania |
Unknown |
100% |
0.8 |
0.4x |
Nov-20* |
|
Co-operative Bank |
Jamii Bora Bank |
3.4 |
90.0% |
1 |
0.3x |
Aug-20 |
|
Commercial International Bank |
Mayfair Bank Limited |
1.0 |
51.0% |
Undisclosed |
N/D |
May-20* |
|
Access Bank PLC (Nigeria) |
Transnational Bank PLC. |
1.9 |
100.0% |
1.4 |
0.7x |
Feb-20* |
|
Equity Group ** |
Banque Commerciale Du Congo |
8.9 |
66.5% |
10.3 |
1.2x |
Nov-19* |
|
KCB Group |
National Bank of Kenya |
7.0 |
100.0% |
6.6 |
0.9x |
Sep-19 |
|
CBA Group |
NIC Group |
33.5 |
53%:47% |
23.0 |
0.7x |
Sep-19 |
|
Oiko Credit |
Credit Bank |
3.0 |
22.8% |
1 |
1.5x |
Aug-19 |
|
CBA Group** |
Jamii Bora Bank |
3.4 |
100.0% |
1.4 |
0.4x |
Jan-19 |
|
AfricInvest Azure |
Prime Bank |
21.2 |
24.2% |
5.1 |
1.0x |
Jan-18 |
|
KCB Group |
Imperial Bank |
Unknown |
Undisclosed |
Undisclosed |
N/A |
Dec-18 |
|
SBM Bank Kenya |
Chase Bank Ltd |
Unknown |
75.0% |
Undisclosed |
N/A |
Aug-18 |
|
DTBK |
Habib Bank Kenya |
2.4 |
100.0% |
1.8 |
0.8x |
Mar-17 |
|
SBM Holdings |
Fidelity Commercial Bank |
1.8 |
100.0% |
2.8 |
1.6x |
Nov-16 |
|
M Bank |
Oriental Commercial Bank |
1.8 |
51.0% |
1.3 |
1.4x |
Jun-16 |
|
I&M Holdings |
Giro Commercial Bank |
3.0 |
100.0% |
5.0 |
1.7x |
Jun-16 |
|
Mwalimu SACCO |
Equatorial Commercial Bank |
1.2 |
75.0% |
2.6 |
2.3x |
Mar-15 |
|
Centum |
K-Rep Bank |
2.1 |
66.0% |
2.5 |
1.8x |
Jul-14 |
|
GT Bank |
Fina Bank Group |
3.9 |
70.0% |
8.6 |
3.2x |
Nov-13 |
|
Average |
74.5% |
1.3x |
||||
|
* Announcement Date ** Deals that were dropped |
||||||
The acquisition valuations for banks have been recovering, with the valuations increasing from the average of 0.6x in 2020 to 1.3x in 2021 and H1’2022 each. This however still remains low compared to historical prices paid as highlighted in the chart below;
The number of commercial banks in Kenya currently stands at 38, same as in Q1’2022 but lower than the 43 licensed banks in FY’2015. The ratio of the number of banks per 10 million populations in Kenya now stands at 6.9x, which is a reduction from 9.0x in FY’2015 demonstrating continued consolidation of the banking sector. However, despite the ratio improving, Kenya still remains overbanked as the number of banks remains relatively high compared to the population. To bring the ratio to 5.5x, we ought to reduce the number of banks from the current 38 banks to 30 banks. For more on this see our topical.
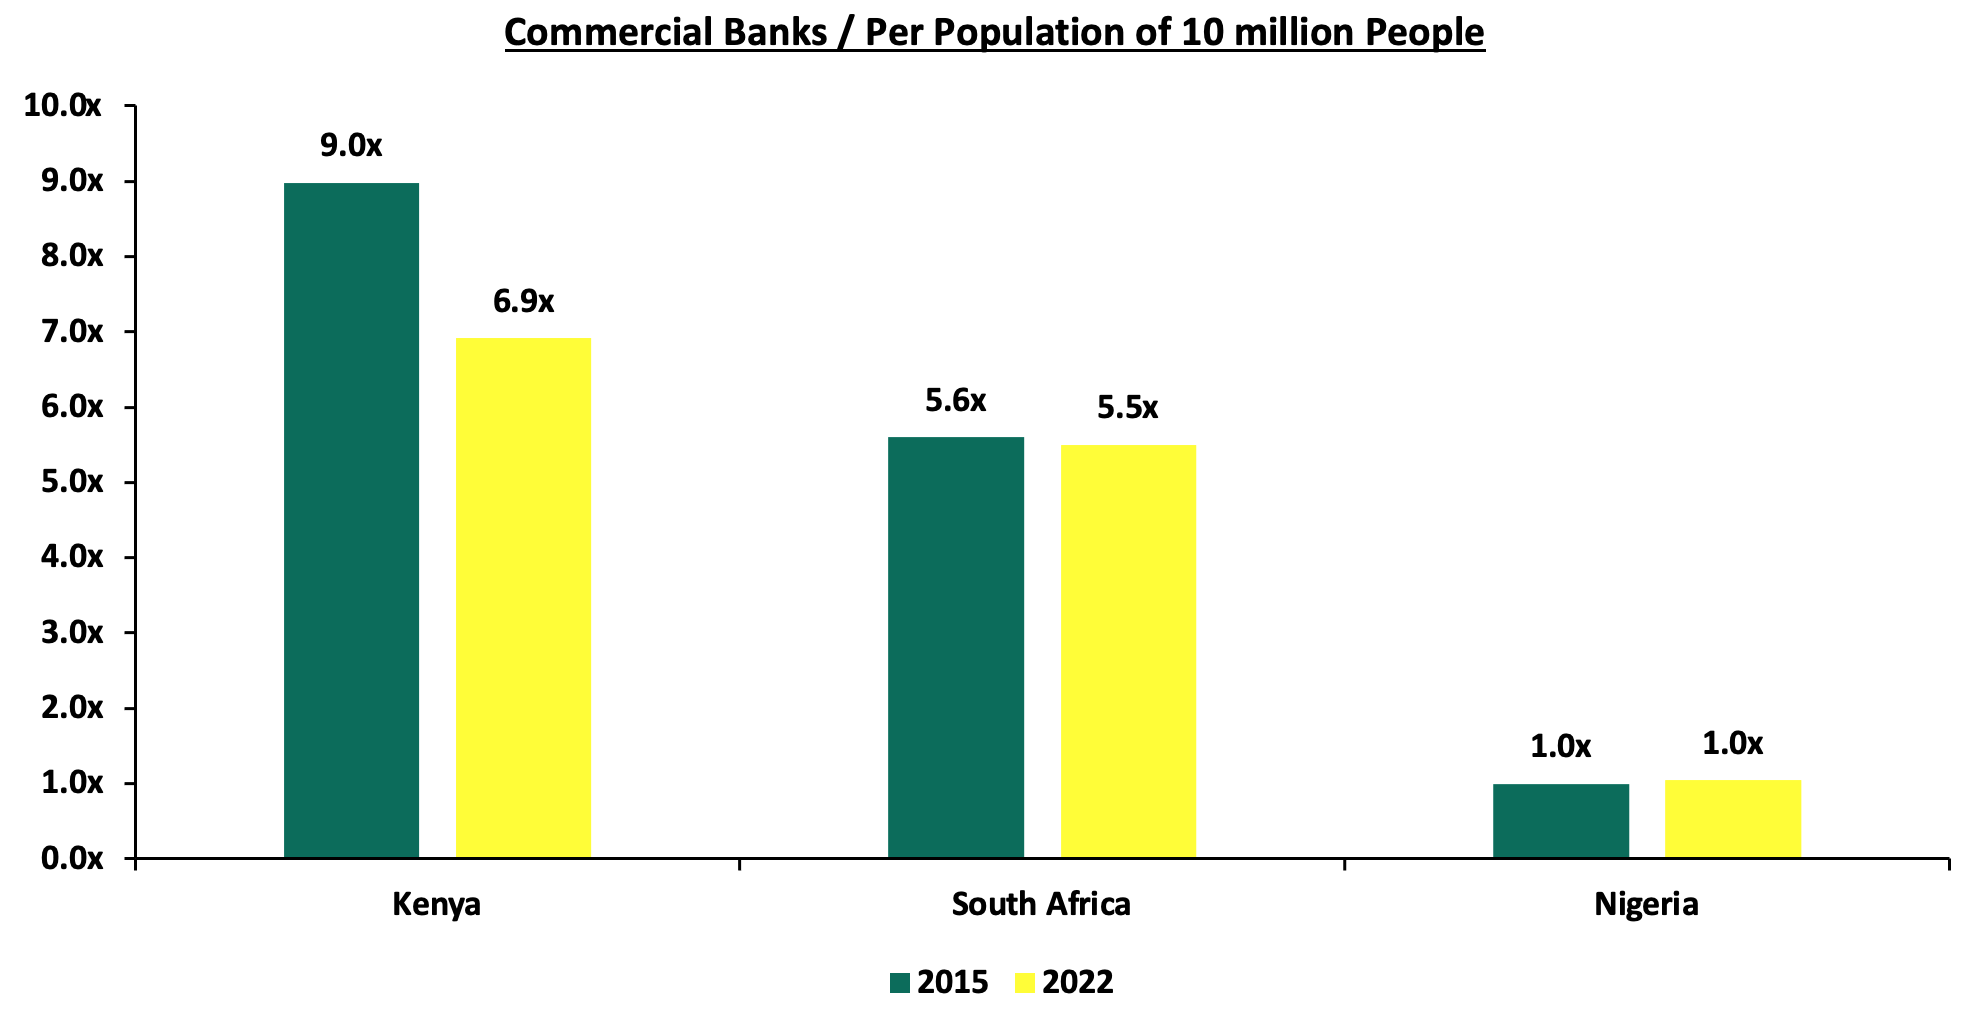
Source: World Bank, Central Bank of Kenya, South Africa Reserve Bank, Central Bank of Nigeria,
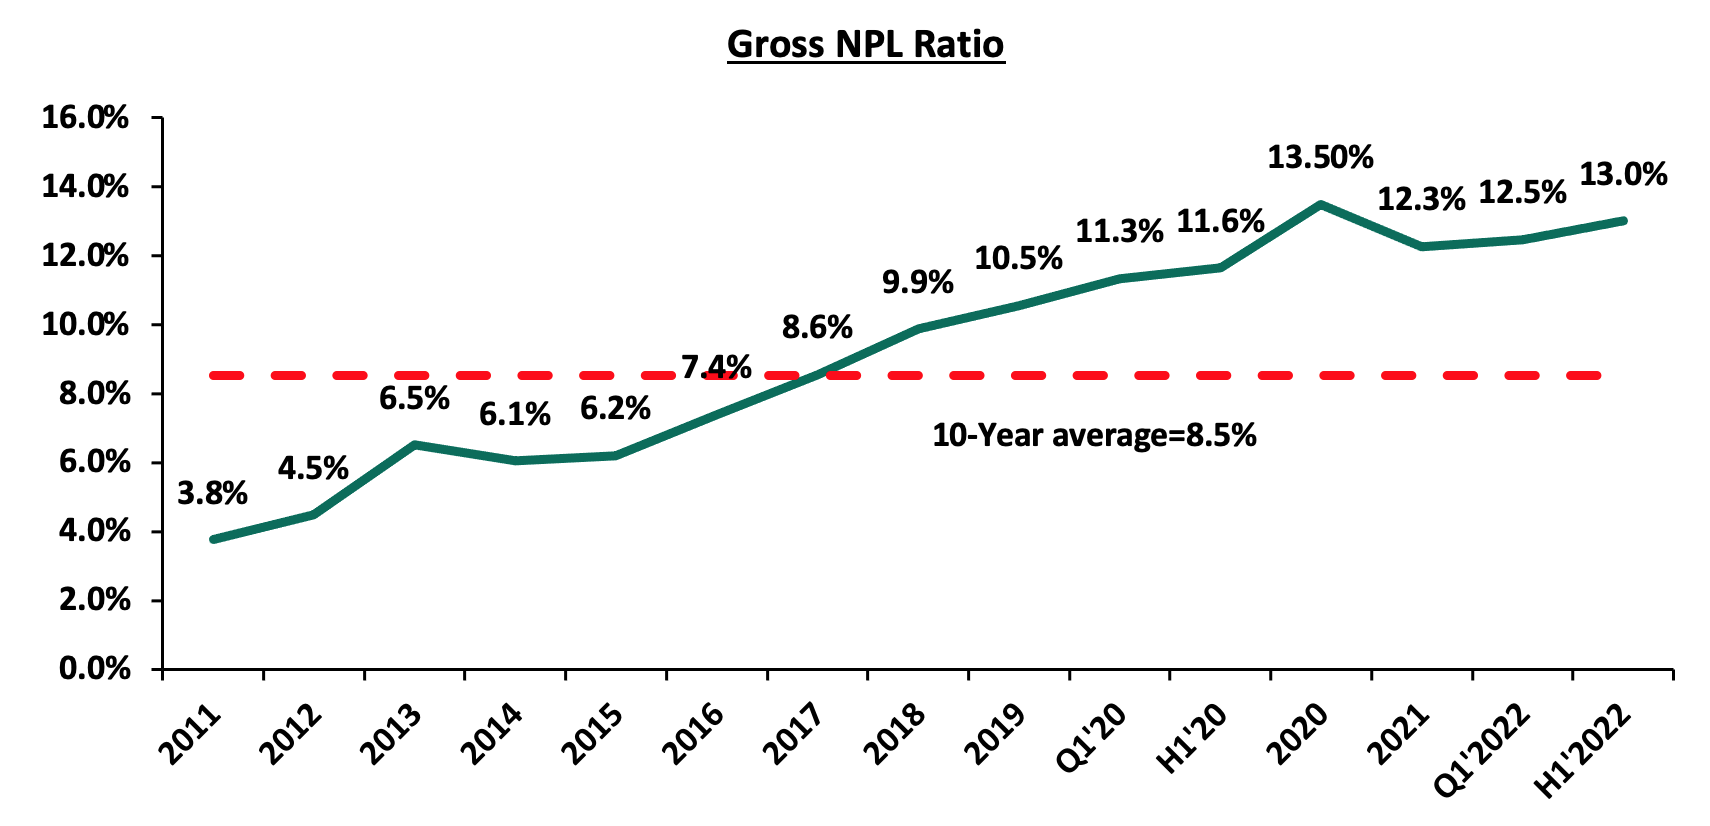
- Asset Quality: Asset quality for listed banks deteriorated in H1’2022, with the Gross NPL ratio increasing by 0.3% points to 13.0%, from 12.7% in H1’2021. According to the July 2022 MPC Press Release, the NPL ratio for the entire banking sector stood at 14.7% as at June 2022, compared to 14.1% in April, with majority of the non-performing loans stemming from sectors like the agriculture, energy and water, as well as the transport and communication sectors. The increase in NPL ratio was primarily due to the deteriorating business environment occasioned by the increased cost of living emanating from elevated inflationary pressures. We expect credit risk to remain elevated in the short term given the soaring inflation as well as persistent supply chain constraints which are expected to continue to weigh on the business environment. The chart below highlights the asset quality trend for the listed banks:
The table below highlights the asset quality for the listed banking sector:
|
|
H1'2021 NPL Ratio** |
H1'2022 NPL Ratio* |
% point change in NPL Ratio |
H1'2021 NPL Coverage** |
H1'2022 NPL Coverage* |
% point change in NPL Coverage |
|
ABSA Bank Kenya |
7.9% |
7.1% |
(0.8%) |
70.9% |
78.5% |
7.6% |
|
KCB |
14.4% |
21.4% |
7.0% |
61.6% |
45.8% |
(15.8%) |
|
Equity Group |
11.4% |
8.8% |
(2.6%) |
63.2% |
64.1% |
0.9% |
|
NCBA Group |
16.7% |
13.5% |
(3.2%) |
68.0% |
62.8% |
(5.2%) |
|
Standard Chartered Bank Kenya |
15.4% |
15.4% |
0.1% |
81.4% |
83.9% |
2.5% |
|
Stanbic Bank |
9.5% |
9.4% |
(0.1%) |
51.2% |
56.0% |
4.8% |
|
I&M Holdings |
10.4% |
9.3% |
(1.1%) |
67.2% |
59.2% |
(8.0%) |
|
Diamond Trust Bank |
10.4% |
12.8% |
2.4% |
41.8% |
44.2% |
2.4% |
|
Co-operative Bank of Kenya |
15.2% |
14.1% |
(1.1%) |
63.5% |
65.8% |
2.3% |
|
HF Group |
22.6% |
18.5% |
(4.1%) |
65.1% |
77.6% |
12.5% |
|
Mkt Weighted Average |
12.7% |
13.0% |
0.3% |
64.6% |
62.3% |
(2.3%) |
|
*Market cap weighted as at 09/09/2022 |
||||||
|
**Market cap weighted as at 09/09/2021 |
||||||
Key take-outs from the table include;
- KCB Group had the highest NPL Ratio jump by 7.0% points to 21.4%, from 14.4% recorded in H1’2021, which was 6.7% points higher than industry average of 0.3% points, mainly attributable to KCB Kenya's deterioration in its NPL ratio to 22.8% from 11.9% in H1'2021, following reclassification of 9 large accounts to non-performing loans in the Kenya market. Additionally, the Group has a 50.1% exposure to corporate loans, which have been impacted by delayed recovery from COVID-19, increased inflationary pressures and pending government bills,
- Asset quality for the listed banks deteriorated during the period, with the weighted average NPL ratio increasing by 0.3% points to a market cap weighted average of 13.0%, from an average of 12.7% for the listed banking sector in H1’2021, and,
- NPL Coverage for the listed banks declined to a market cap weighted average of 62.4% in H1’2022, from 64.5% recorded in H1’2021, as the banks reduced their provisioning following reduced risks with some sectors such as tourism, agriculture and manufacturing continue to record gradual recovery.
- Capital Raising: In H1’2022, listed banks continued to borrow from international institutions to not only strengthen their capital position but also boost their ability to lend to the perceived riskier Micro Small and Medium Sized Enterprises (MSMEs) segment. In the period under review, Equity Group received USD 165.0 mn (Kshs 18.6 bn) facility from the International Finance Corporation (IFC) to Equity Bank Kenya in January 2022. For more information see our Cytonn Weekly #19/2022.
Additionally, the International Finance Corporation (IFC) disclosed a plan to extend USD 150.0 mn (Kshs 18.0 bn) to KCB Group in form of a senior unsecured loan in August. The loan facilities to both banks is aimed at supporting the growth of the banks’ climate finance portfolio which entails clients in sectors such as manufacturing, real estate and agriculture. For more information see our Cytonn Monthly August 2022.
Section II: Summary of the Performance of the Listed Banking Sector in H1’2022:
The table below highlights the performance of the banking sector, showing the performance using several metrics, and the key take-outs of the performance;
|
Bank |
Core EPS Growth |
Interest Income Growth |
Interest Expense Growth |
Net Interest Income Growth |
Net Interest Margin |
Non-Funded Income Growth |
NFI to Total Operating Income |
Growth in Total Fees |
Deposit Growth |
Growth in Government Securities |
Loan to Deposit Ratio |
Loan Growth |
|
HF |
114.4% |
4.6% |
(1.3%) |
11.4% |
4.5% |
53.2% |
32.7% |
13.2% |
3.4% |
87.8% |
89.2% |
(1.1%) |
|
NCBA |
66.9% |
10.9% |
12.0% |
10.2% |
6.0% |
32.5% |
48.9% |
(2.2%) |
7.1% |
17.0% |
53.5% |
4.5% |
|
Co-op |
55.7% |
10.0% |
5.5% |
11.8% |
8.4% |
28.8% |
38.7% |
36.8% |
3.8% |
0.7% |
78.0% |
9.6% |
|
Stanbic |
36.9% |
14.8% |
(2.2%) |
20.9% |
5.4% |
25.1% |
45.1% |
11.1% |
(0.7%) |
(36.1%) |
94.5% |
17.5% |
|
Equity |
36.1% |
28.6% |
30.9% |
27.8% |
7.3% |
24.4% |
39.4% |
28.5% |
18.5% |
16.9% |
67.0% |
28.9% |
|
KCB |
28.4% |
15.7% |
30.3% |
11.5% |
8.5% |
29.9% |
32.1% |
24.4% |
15.6% |
30.4% |
80.4% |
20.3% |
|
DTB-K |
25.6% |
12.5% |
11.4% |
13.3% |
5.2% |
17.8% |
26.0% |
9.4% |
10.4% |
(4.3%) |
67.4% |
14.3% |
|
I&M |
15.9% |
19.3% |
20.2% |
18.7% |
6.4% |
28.2% |
32.5% |
30.1% |
13.2% |
17.2% |
73.8% |
13.0% |
|
ABSA |
13.0% |
21.3% |
25.1% |
20.3% |
7.6% |
10.8% |
31.0% |
(10.0%) |
6.7% |
(0.4%) |
92.9% |
19.5% |
|
SCBK |
10.9% |
4.4% |
(21.4%) |
9.9% |
6.4% |
10.9% |
35.6% |
(6.2%) |
3.1% |
2.1% |
44.8% |
(1.3%) |
|
H1'22 Mkt Weighted Average* |
34.0% |
18.0% |
18.6% |
17.7% |
7.3% |
24.4% |
37.1% |
17.9% |
11.3% |
11.6% |
72.7% |
17.7% |
|
H1'21 Mkt Weighted Average** |
136.0% |
15.0% |
10.8% |
17.6% |
7.4% |
19.2% |
35.6% |
16.6% |
18.4% |
12.4% |
68.8% |
11.7% |
|
*Market cap weighted as at 09/09/2022 **Market cap weighted as at 09/09/2021 |
||||||||||||
Key takeaways from the table include:
- The listed banks recorded a 34.0% weighted average growth in core Earnings per Share (EPS), compared to a weighted average increase of 136.0% in H1’2021 for the listed banking sector,
- The Banks have recorded a weighted average deposit growth of 11.3%, slower than the 18.4% growth recorded in H1’2021, an indication of reduced investment risk in the business environment,
- Interest income grew by 18.0%, compared to a growth of 15.0% recorded in H1’2021 while the weighted average Yield on Interest Earning Assets (YIEA) decreased to 9.8%, from the 9.9% recorded in H1’2021 for the listed banking sector. On the other hand, the Net Interest Margin (NIM) stood at 7.3%, 0.1% points lower than the 7.4% recorded in H1’2021 for the whole listed banking sector, and,
- Non-Funded Income grew by 24.4%, compared to the 19.2% growth recorded in H1’2021. This can be attributable to the faster growth in the fees and commission which grew by 18.0% outpacing 16.6% growth in H1’2021.
Section III: Outlook of the banking sector:
Based on the current operating environment, we believe the future performance of the banking sector will be mainly shaped by the following key factors:
- Revenue Diversification: In H1’2022, Non-Funded Income recorded a 24.4% weighted average growth, an increase from the 19.2% growth recorded in H1’2021, with many banks diversifying their revenue sources. We therefore believe that there exists an opportunity for the sector to further increase NFI contribution to revenue given the continuous adoption of digital channels by banks and their clients after the pandemic has created more revenue opportunities for the sector,
- Consolidation: Consolidation remains a key theme going forward with the current environment offering opportunities for larger banks with a sufficient capital base to expand and take advantage of the market's low valuations, as well as further consolidate out smaller and weaker banks. Bigger banks are also more profitable and have better deposit growth coupled with cheaper cost of funds compared to smaller banks. As such, consolidation will help the smaller banks meet the minimum capital requirement and also expand big bank’s asset base,
- Regional Expansion: Notably, majority of the bigger banks have continued to cushion over unsystematic risks specific to the local market by expanding their operations into other African nations. Banks such as KCB and Equity Group have been leveraging on expansion which has largely contributed to their increased asset base as well as earnings growth. As aforementioned, KCB Group recently announced the acquisition of Trust Merchant Bank (TMB) in DRC. We expect other banks to continue with the expansion trend for revenue optimization, and,
- Integration of Climate-Related Risk Management: The release of Guidance on Climate-Related Risk Management report by the Central Bank of Kenya (CBK) is driving banks to channel their long term financing into environmental-friendly assets that are more sustainable and have lower risk of damage loss as a result of climate change. Banks will also lend to clients whose activities do not pose an environmental risk and will ultimately lead to improvement of collateral quality. Key to note, Equity Group and KCB Group have sourced for loans from International Finance Corporation (IFC) aimed at supporting the growth of the bank’s climate finance portfolio.
Section IV: Brief Summary and Ranking of the Listed Banks:
As per our analysis on the banking sector from a franchise value and a future growth opportunity perspective, we carried out a comprehensive ranking of the listed banks. For the franchise value ranking, we included the earnings and growth metrics as well as the operating metrics shown in the table below in order to carry out a comprehensive review of the banks:
|
Bank |
Loan to Deposit Ratio |
Cost to Income (With LLP) |
Return on Average Capital Employed |
Deposits/ Branch (bn) |
Gross NPL Ratio |
NPL Coverage |
Tangible Common Ratio |
Non Funded Income/Revenue |
|
ABSA Bank |
92.9% |
56.4% |
16.8% |
3.4 |
7.1% |
78.5% |
12.5% |
31.0% |
|
NCBA Group |
53.5% |
58.9% |
14.5% |
4.5 |
13.5% |
62.8% |
12.5% |
48.9% |
|
Equity Bank |
67.0% |
52.9% |
21.2% |
2.8 |
8.8% |
64.1% |
10.1% |
39.4% |
|
KCB Group |
80.4% |
52.9% |
17.0% |
1.8 |
21.4% |
45.8% |
14.5% |
32.1% |
|
SCBK |
44.8% |
51.3% |
14.0% |
13.0 |
15.4% |
81.8% |
14.5% |
35.6% |
|
Coop Bank |
78.0% |
55.8% |
16.1% |
2.4 |
14.1% |
14.1% |
15.0% |
38.7% |
|
Stanbic Bank |
94.5% |
40.0% |
12.0% |
10.3 |
9.4% |
56.0% |
14.7% |
45.1% |
|
DTBK |
67.4% |
62.3% |
8.4% |
2.7 |
12.8% |
44.2% |
14.1% |
26.0% |
|
I&M Holdings |
73.8% |
55.2% |
10.9% |
3.6 |
9.5% |
59.2% |
13.8% |
32.5% |
|
HF Group |
89.2% |
95.9% |
0.7% |
1.8 |
18.5% |
71.8% |
13.6% |
32.7% |
|
Weighted Average H1’2022 |
73.0% |
53.6% |
16.9% |
4.0 |
12.9% |
56.2% |
12.9% |
37.1% |
|
Market cap weighted as at 09/09/2022 |
||||||||
The overall ranking was based on a weighted average ranking of Franchise value (accounting for 60.0%) and intrinsic value (accounting for 40.0%). The Intrinsic Valuation is computed through a combination of valuation techniques, with a weighting of 40.0% on Discounted Cash-flow Methods, 35.0% on Residual Income and 25.0% on Relative Valuation, while the Franchise ranking is based on banks operating metrics, meant to assess efficiency, asset quality, diversification, and profitability, among other metrics. The overall H1’2022 ranking is as shown in the table below:
|
Bank |
Franchise Value Rank |
Intrinsic Value Rank |
Weighted Rank |
Q1'2022 |
H1’2022 |
|
Equity Group Holdings Ltd |
3 |
1 |
1.8 |
1 |
1 |
|
Co-operative Bank of Kenya Ltd |
1 |
4 |
2.8 |
4 |
2 |
|
ABSA |
4 |
3 |
3.4 |
5 |
3 |
|
KCB Group Plc |
7 |
2 |
4.0 |
2 |
4 |
|
I&M Holdings |
4 |
5 |
4.6 |
8 |
5 |
|
Stanbic Bank/Holdings |
1 |
8 |
5.2 |
3 |
6 |
|
SCBK |
4 |
7 |
5.8 |
7 |
7 |
|
DTBK |
10 |
6 |
7.6 |
6 |
8 |
|
NCBA Group Plc |
8 |
9 |
8.6 |
9 |
9 |
|
HF Group Plc |
9 |
10 |
9.6 |
10 |
10 |
Major Changes from the H1’2022 Ranking are:
- KCB Group’s rank declined to position 4 in H1’2022 from position 2 in Q1’2022, attributable to an increase in the bank’s NPL ratio to 21.4%, from 16.9% in Q1’2022. However, the bank’s Return on Average Equity increased to 23.2%, from 22.9% recorded in Q1’2022, and,
- Co-operative Bank’s rank improved to position 2 in H1’2022 from position 4 in Q1’2022 attributable to the improvement in its Net Interest Margin to 8.4%, from the 8.3% recorded in Q1’2022, leading to an increase in the bank’s franchise value score.
For more information, see our Cytonn H1’2022 Listed Banking Sector Review
Disclaimer: The views expressed in this publication are those of the writers where particulars are not warranted. This publication, which is in compliance with Section 2 of the Capital Markets Authority Act Cap 485A, is meant for general information only and is not a warranty, representation, advice or solicitation of any nature. Readers are advised in all circumstances to seek the advice of a registered investment advisor.


