Following the release of the Q3’2022 results by Kenyan listed banks, the Cytonn Financial Services Research Team undertook an analysis on the financial performance of the listed banks and identified the key factors that shaped the performance of the sector. For the earnings notes of the various banks, click the links below:
- Equity Group Q3’2022 Earnings Note;
- KCB Group Q3’2022 Earnings Note;
- Standard Chartered Bank Kenya Q3’2022 Earnings Note;
- ABSA Bank Kenya Q3’2022 Earnings Note;
- NCBA Group Q3’2022 Earnings Note;
- Co-operative Bank Q3’2022 Earnings Note;
- Diamond Trust Bank Kenya (DTB-K) Earnings Note;
- I&M Group Holdings Q3’2022 Earnings Note;
- Stanbic Holdings Q3’2022 Earnings Note;
- HF Group Q3’2022 Earnings Note;
The Core Earnings per Share (EPS) for the listed banks recorded a weighted growth of 36.7% in Q3’2022, compared to a weighted growth of 102.0% recorded in Q3’2021, indicating the banking sector’s continued resilience despite the tough operating business environment occasioned by elevated inflationary pressures. The performance in Q3’2022 was mainly attributable to a 30.1% growth in non-funded income coupled with a 17.6% growth in net interest income. Additionally, the listed banks’ operational efficiency improved, with the Cost to Income without LLP ratio declining by 3.9% points to 45.1%, from 49.0% recorded in Q3’2021, mainly as a result of continuous adoption of alternative distribution channels that have seen banks to reduce their operating expenses. However, the sector’s Asset Quality remains a high concern with average NPL ratio at 12.3% in Q3’2022, remaining 4.2% points higher than the 10-year average of 8.1%. Notably, the Asset Quality for the listed banks deteriorated in Q3’2022, with the gross NPL ratio increasing marginally by 0.1% points to 12.3%, from 12.2% in Q3’2021.
The report is themed “Revenue Diversification Spurs Earnings Growth” where we assess the key factors that influenced the performance of the banking sector in Q3’2022, the key trends, the challenges banks faced, and areas that will be crucial for growth and stability of the banking sector going forward. As such, we shall address the following:
- Key Themes that Shaped the Banking Sector Performance in Q3’2022,
- Summary of the Performance of the Listed Banking Sector in Q3’2022,
- The Focus Areas of the Banking Sector Players Going Forward, and,
- Brief Summary and Ranking of the Listed Banks based on the outcome of our analysis.
Section I: Key Themes That Shaped the Banking Sector Performance in Q3’2022
Below, we highlight the key themes that shaped the banking sector in Q3’2022 which include; regulation, regional expansion through mergers and acquisitions, asset quality and capital raising for onward lending:
- Regulation:
- Risk-based Lending: The Central Bank of Kenya has been working on a risk-based lending model to price loans since the Interest Cap law was repealed in 2019. The model’s main goal is to allow banks to lend in line with the estimated risks of each borrower. Additionally, this is a shift from negative listing of defaulters to a new system of credit score rating that does not deny borrowers credit on the strength of their credit bureau reference scores. The model targets borrowers who are deemed risker with majority operating in micro, small and medium enterprises that have been struggling to access formal credit. Notably, as of November 2022, at least 23 of the banks had their models approved by the CBK, with Equity Bank being the first commercial bank to roll out the risked-based lending. However, the approval rate for the models has been gradual in a bid to avoid causing distress to customers through high interest rates. Additionally, the full implementation has also been slowed down as a result of insufficient data to assess client’s risk profile, and,
- Regulation of Digital Lenders: The Central Bank of Kenya (CBK) enacted the law to regulate digital lenders, granting the bank the authority to license and oversee previously unregulated digital credit providers. The regulations were published on 18th March 2022, and allowed digital lenders a period of six months to acquire licences from CBK and are aimed at protecting borrowers from uncharacterized practices of unregulated digital credit providers, particularly their high costs, unethical debt collection practices, and misuse of personal information. The application period for licencing by all operating unregulated digital credit providers elapsed on 17th September 2022, with the CBK announcing approval of only 10 digital credit providers out of the 288 which had applied to be licenced. Additionally, the CBK cited that the other applicants were at difference stages of the approval process while those that did not apply for licencing as per the regulations will cease operations.
The following are developments that happened after Q3’2022:
- Credit Repair Framework: In November 2022, the Central Bank of Kenya (CBK) announced the roll out of a Credit Repair Framework by commercial banks, microfinance banks, and mortgage finance companies. The main objective of the Framework is to improve the credit standing of mobile phones digital borrowers who had been adversely listed with Credit Reference Bureaus (CRBs) for failing to service their mobile loans. The Framework will cover loans with a repayment period of 30 day or less, with the institutions expected to provide a discount of at least 50.0% of the non-performing mobile phone digital loans outstanding as at the end of October 2022. This initiative by the CBK has been welcomed by banks with NCBA Group and ABSA Bank already disclosed to have written off non-performing digital loans amounting to Kshs 11.5 bn and Kshs 1.8 bn, respectively. As such, this is expected to increase access to credit and other financial services by borrowers operating in personal and micro-enterprises sectors which were largely affected by the Covid-19 pandemic, and,
- Reintroduction of charges for mobile money and bank account transactions: In December 2022, the central Bank of Kenya (CBK) announced the reintroduction of charges for transactions between mobile wallets and bank accounts which were waived in March 2020, as an emergency response to facilitate use of mobile money and reduce handling of hard cash during Covid-19 pandemic period. The reintroduction of the charges will take effect as from 1st January 2023, with the CBK citing that the new charges will be significantly lower than the charges that applied before the pandemic. Notably, the reintroduced charges will have the following elements;
- The revised maximum charges for transfers from bank accounts to mobile money wallets will be reduced by on average up to 61.0%, and mobile money wallet to bank account by on average up to 47.0%,
- Tariffs for paybills that collect and disburse funds by businesses, companies and institutions will be reduced by on average 50.0%, and,
- The charges levied by banks for banks to mobile money transactions will be reduced by on average 45.0%.
- Regional Expansion through Mergers and Acquisitions: Kenyan banks are continuously looking at having an extensive regional reach and in Q3’2022, there were two acquisitions by KCB Group and Equity Group Holdings Plc as follows:
- On 2nd August 2022, KCB Group Plc, announced that it had entered into a final agreement with shareholders of Trust Merchant Bank (TMB) to acquire an 85.0% stake in the Democratic Republic of Congo (DRC)- based lender, with an option to acquire the remaining stake after two years. With the shareholder’s approval in September, the deal is nearly complete pending approvals from COMESA Competition Commission and the Central Bank of DRC. This will mark the second Kenyan banking group to enter the DRC banking market after Equity Group Holdings. For this acquisition, KCB will pay a cash consideration based on the net asset value of TMB at completion of the proposed transaction using a Price to Book (P/B) multiple of 1.5x, subject to regulatory, shareholders and other approvals. We estimate a payment of Kshs 15.7 bn by KCB at the trading multiple of 1.5x given TMB’s book valueof FC 208.4 bn (Kshs 12.4 bn) as of 2020. For more information, please see our Cytonn Weekly #31/2022 ,and,
- On 12th September 2022, Equity Group Holdings Plc through Equity Bank (Kenya) Limited, announced that it had entered into an Assets and Liabilities purchase agreement with Spire Bank Limited for purchase of certain assets and liabilities. In the deal which was anchored in Equity’s plan to support economic recovery post COVID-19, Equity Bank Kenya Limited would acquire approximately 20,000 deposit customers with deposits totaling Kshs 1.3 bn, and 3,700 loan customers. For more information, please see our Cytonn Weekly #37/2022. However, the was frozen by the Employment and Labor Relations Court following dispute over the fate of employees in Spire bank.
Below is a summary of the deals in the last 9 years that have either happened, been announced or expected to be concluded:
|
Acquirer |
Bank Acquired |
Book Value at Acquisition (Kshs bn) |
Transaction Stake |
Transaction Value (Kshs bn) |
P/Bv Multiple |
Date |
|
Equity Group |
Spire Bank |
Unknown |
Undisclosed |
Undisclosed |
N/A |
Sep-22* |
|
KCB Group PLC |
Trust Merchant Bank (TMB) |
12.4 |
85.0% |
15.7 |
1.5x |
August-22 |
|
Access Bank PLC (Nigeria) |
Sidian Bank |
4.9 |
83.4% |
4.3 |
1.1x |
June-22* |
|
KCB Group |
Banque Populaire du Rwanda |
5.3 |
100.0% |
5.6 |
1.1x |
August-21 |
|
I&M Holdings PLC |
Orient Bank Limited Uganda |
3.3 |
90.0% |
3.6 |
1.1x |
April-21 |
|
KCB Group** |
ABC Tanzania |
Unknown |
100% |
0.8 |
0.4x |
Nov-20* |
|
Co-operative Bank |
Jamii Bora Bank |
3.4 |
90.0% |
1 |
0.3x |
Aug-20 |
|
Commercial International Bank |
Mayfair Bank Limited |
1.0 |
51.0% |
Undisclosed |
N/D |
May-20* |
|
Access Bank PLC (Nigeria) |
Transnational Bank PLC. |
1.9 |
100.0% |
1.4 |
0.7x |
Feb-20* |
|
Equity Group ** |
Banque Commerciale Du Congo |
8.9 |
66.5% |
10.3 |
1.2x |
Nov-19* |
|
KCB Group |
National Bank of Kenya |
7.0 |
100.0% |
6.6 |
0.9x |
Sep-19 |
|
CBA Group |
NIC Group |
33.5 |
53%:47% |
23.0 |
0.7x |
Sep-19 |
|
Oiko Credit |
Credit Bank |
3.0 |
22.8% |
1 |
1.5x |
Aug-19 |
|
CBA Group** |
Jamii Bora Bank |
3.4 |
100.0% |
1.4 |
0.4x |
Jan-19 |
|
AfricInvest Azure |
Prime Bank |
21.2 |
24.2% |
5.1 |
1.0x |
Jan-18 |
|
KCB Group |
Imperial Bank |
Unknown |
Undisclosed |
Undisclosed |
N/A |
Dec-18 |
|
SBM Bank Kenya |
Chase Bank Ltd |
Unknown |
75.0% |
Undisclosed |
N/A |
Aug-18 |
|
DTBK |
Habib Bank Kenya |
2.4 |
100.0% |
1.8 |
0.8x |
Mar-17 |
|
SBM Holdings |
Fidelity Commercial Bank |
1.8 |
100.0% |
2.8 |
1.6x |
Nov-16 |
|
M Bank |
Oriental Commercial Bank |
1.8 |
51.0% |
1.3 |
1.4x |
Jun-16 |
|
I&M Holdings |
Giro Commercial Bank |
3.0 |
100.0% |
5.0 |
1.7x |
Jun-16 |
|
Mwalimu SACCO |
Equatorial Commercial Bank |
1.2 |
75.0% |
2.6 |
2.3x |
Mar-15 |
|
Centum |
K-Rep Bank |
2.1 |
66.0% |
2.5 |
1.8x |
Jul-14 |
|
GT Bank |
Fina Bank Group |
3.9 |
70.0% |
8.6 |
3.2x |
Nov-13 |
|
Average |
74.5% |
1.3x |
||||
|
* Announcement Date ** Deals that were dropped |
||||||
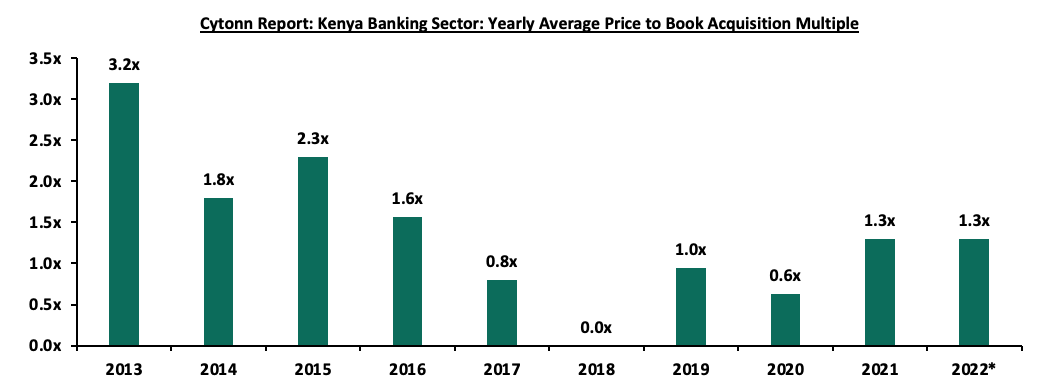
The acquisition valuations for banks have been recovering, with the valuations increasing from the average of 0.6x in 2020 to 1.3x in 2021 and 2022 each. This however still remains low compared to historical prices paid as highlighted in the chart below;
The number of commercial banks in Kenya currently stands at 38, same as in H1’2022 but lower than the 43 licensed banks in FY’2015. The ratio of the number of banks per 10 million populations in Kenya now stands at 6.9x, which is a reduction from 9.0x in FY’2015 demonstrating continued consolidation of the banking sector. However, despite the ratio improving, Kenya still remains overbanked as the number of banks remains relatively high compared to the population. To bring the ratio to 5.5x, we ought to reduce the number of banks from the current 38 banks to 30 banks. For more on this see our topical.
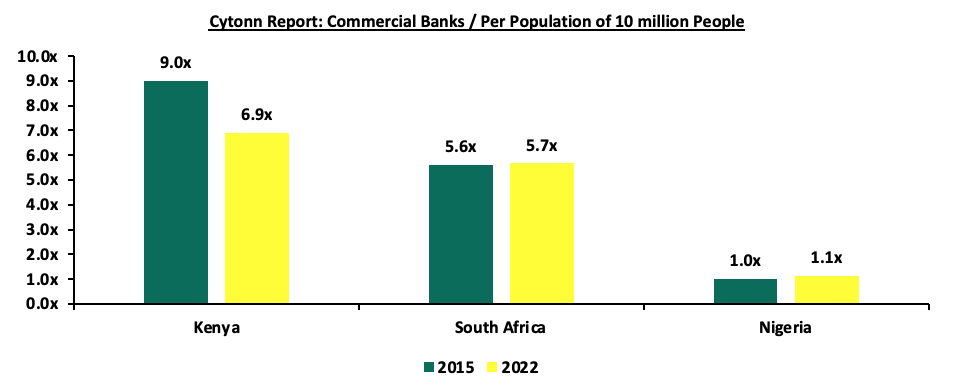
Source: World Bank, Central Bank of Kenya, South Africa Reserve Bank, Central Bank of Nigeria,
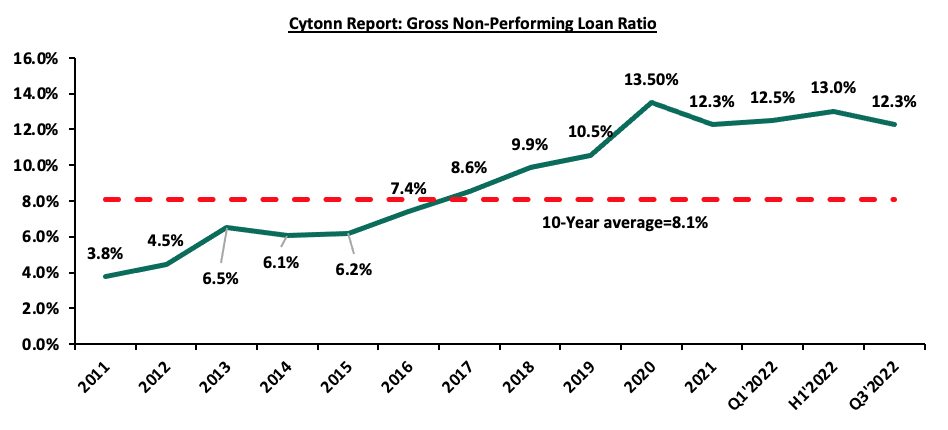
- Asset Quality: Asset quality for listed banks deteriorated in Q3’2022, with the Gross Non-Performing Loan ratio (NPL) increasing marginally by 0.1% points to 12.3%, from 12.2% in Q3’2021. The deterioration of the Assets quality was mainly skewed by an increase in KCB Group’s NPL ratio to 8% in Q3’2022, from 13.7% in Q3’2021, attributable to the continued high exposure to corporate loans at 47.8% in Q3’2022, which have been impacted by delayed recovery from COVID-19, increased inflationary pressures and pending government bills. However, according the Quarterly Economic Review Q3’2022 released by the Central Bank of Kenya, the asset quality for the entire banking sector improved, with Gross NPL ratio declining by 1.0% points to 13.7% in Q3’2022, from 14.7% recorded at the end of Q2’2022. The improvement in asset quality was mainly driven by 4.4% decline in gross Non-Performing Loans (NPLs), coupled with a 2.5% increase in gross loans in the period under review. Building and Construction, Tourism, Manufacturing, Real Estate, Financial Services, Transport and Communication and Trade sectors cumulatively registered declines in NPLs by 51.4%, translating to Kshs 24.6 bn as a result of increased repayments. Going forward, we expect credit risk to remain elevated in the short term given the soaring inflationary pressures which are expected to continue to weigh on the business environment. The chart below highlights the asset quality trend for the listed banks:
The table below highlights the asset quality for the listed banking sector:
|
|
Q3’2021 NPL Ratio** |
Q3’2022 NPL Ratio* |
% point change in NPL Ratio |
Q3’2021 NPL Coverage** |
Q3’2022 NPL Coverage* |
% point change in NPL Coverage |
|
ABSA Bank Kenya |
8.1% |
6.6% |
(1.5%) |
74.5% |
80.0% |
5.5% |
|
Equity Group |
9.5% |
9.5% |
- |
60.6% |
63.0% |
2.4% |
|
I&M Holdings |
10.2% |
9.5% |
(0.7%) |
70.6% |
75.4% |
4.8% |
|
Stanbic Bank |
11.5% |
10.1% |
(1.4%) |
54.9% |
63.4% |
8.5% |
|
NCBA Group |
17.0% |
12.6% |
(4.4%) |
70.2% |
65.3% |
(4.9%) |
|
Diamond Trust Bank |
11.9% |
12.7% |
0.8% |
40.0% |
45.2% |
5.2% |
|
Co-operative Bank of Kenya |
14.6% |
14.0% |
(0.6%) |
65.5% |
69.3% |
3.8% |
|
Standard Chartered Bank Kenya |
15.3% |
15.4% |
0.1% |
82.8% |
82.4% |
(0.4%) |
|
KCB |
13.7% |
17.8% |
4.1% |
63.4% |
52.8% |
(10.6%) |
|
HF Group |
22.0% |
20.3% |
(1.7%) |
68.9% |
77.2% |
8.3% |
|
Mkt Weighted Average |
12.2% |
12.3% |
0.1% |
65.7% |
65.7% |
(0.0%) |
|
*Market cap weighted as at 08/12/2022 |
||||||
|
**Market cap weighted as at 10/12/2021 |
||||||
Key take-outs from the table include;
- Asset quality for the listed banks deteriorated during the period, with the weighted average NPL ratio increasing by 0.1% points to a market cap weighted average of 12.3%, from an average of 12.2% in Q3’2021. The asset quality was however skewed by deterioration in KCB’s NPL ratio which increased by 4.1% points to 17.8% from 13.7% in Q3’2021,
- KCB Group had the highest NPL Ratio jump by 4.1% to 17.8% in Q3’2022 from 13.7% in Q3’2021, which was 4.3% points higher than industry average of 0.1% points, mainly attributable to the continued high exposure to corporate loans at 47.8% in Q3’2022, which have been impacted by delayed recovery from COVID-19, increased inflationary pressures and pending government bills. Additionally, the group’s asset quality was further weighed down by KCB Kenya’s NPL ratio which recorded a significant increase of 8.0% points to 19.8%, from 11.9% recorded in Q3’2021, partly attributable to loan stock by corporates due to delayed payments from government contracts. Further, despite being a y/y improvement to 24.5%, from 35.1% in Q3’2021, NBK’s NPL ratio continues to be adverse,
- NCBA Group recorded the highest improvement in its asset quality with the NPL ratio declining by 4.4% to 12.6% from 17.0% recoded in Q3’2021. The improvement in asset quality was mainly attributed to increase loan repayments during the period under review with gross non-performing loans declining by 20.9% to Kshs 36.4 bn from Kshs 46.0 bn recorded in Q3’2021, and,
- The NPL Coverage for the listed banks remained unchanged at a market cap weighted average of 65.6% in Q3’2022, similar to what was recorded in Q3’2021, mainly attributable to increased NPL coverage of Stanbic Bank, ABSA and Diamond Trust Bank (DTB-K) offsetting the reduced NPL coverage by KCB Group and NCBA Group.
- Capital Raising: In Q3’2022, listed banks continued to borrow from international institutions to not only strengthen their capital positions but also boost their ability to lend to the perceived riskier Micro Small and Medium Sized Enterprises (MSMEs) segment. In the period under review, the International Finance Corporation (IFC) disclosed that it would extend USD 150.0 mn (Kshs 18.0 bn) to KCB Group in form of a senior unsecured loan with a maturity of 7-years and a grace period of 2-years. The credit facility was aimed at supporting the growth of the bank’s climate finance portfolio which entails clients in sectors such as manufacturing, real estate and agriculture. For more information please see our Cytonn Monthly-August 2022. Additionally, the International Finance Corporation (IFC) disclosed that it would extend USD 100.0 mn (Kshs 12.2 bn) to Diamond Trust Bank (DTB) under the WCS COVID-19 FIGE response facility in form of a senior debt investment with 24-month maturity and renewable once on an aggregate of up to 36 months. For more information, please see our Cytonn Weekly #46/2022.
Section II: Summary of the Performance of the Listed Banking Sector in Q3’2022:
The table below highlights the performance of the banking sector, showing the performance using several metrics, and the key take-outs of the performance;
|
Bank |
Core EPS Growth |
Interest Income Growth |
Interest Expense Growth |
Net Interest Income Growth |
Net Interest Margin |
Non-Funded Income Growth |
NFI to Total Operating Income |
Growth in Total Fees & Commissions |
Deposit Growth |
Growth in Government Securities |
Loan to Deposit Ratio |
Loan Growth |
Return on Average Equity |
|
HF |
110.8% |
6.8% |
0.7% |
13.9% |
4.7% |
66.1% |
32.4% |
(3.6%) |
3.5% |
51.2% |
90.7% |
1.7% |
0.5% |
|
NCBA |
96.2% |
13.3% |
10.8% |
15.1% |
6.0% |
40.1% |
49.2% |
5.2% |
3.2% |
9.1% |
57.6% |
11.7% |
21.2% |
|
Co-op |
47.0% |
10.5% |
7.2% |
11.7% |
8.5% |
28.3% |
38.6% |
31.7% |
2.8% |
(5.7%) |
77.6% |
9.4% |
22.5% |
|
SCBK |
37.1% |
4.1% |
(12.6%) |
7.3% |
6.3% |
16.1% |
35.7% |
(13.4%) |
10.7% |
13.2% |
47.6% |
3.3% |
21.0% |
|
Stanbic |
36.8% |
3.1% |
19.2% |
26.8% |
6.2% |
37.5% |
44.6% |
8.1% |
25.6% |
38.3% |
88.6% |
34.1% |
25.1% |
|
ABSA |
30.1% |
24.7% |
22.4% |
25.3% |
7.6% |
16.4% |
30.4% |
(1.2%) |
4.6% |
10.5% |
103.0% |
26.4% |
23.2% |
|
Equity |
27.9% |
25.6% |
31.3% |
23.6% |
7.3% |
32.0% |
41.4% |
28.6% |
15.1% |
(0.1%) |
66.9% |
20.6% |
31.3% |
|
I&M |
25.1% |
17.3% |
20.0% |
15.6% |
6.6% |
43.0% |
35.4% |
26.0% |
6.7% |
(2.6%) |
75.1% |
11.4% |
13.9% |
|
KCB |
21.4% |
13.6% |
28.4% |
9.1% |
8.1% |
30.2% |
33.2% |
17.3% |
7.4% |
6.9% |
80.1% |
16.4% |
22.6% |
|
DTB-K |
21.1% |
15.4% |
17.2% |
43.5% |
5.7% |
43.5% |
29.0% |
24.5% |
11.1% |
17.4% |
67.7% |
18.5% |
8.0% |
|
Q3'22 Mkt Weighted Average* |
36.7% |
16.4% |
19.6% |
17.6% |
7.3% |
30.1% |
38.1% |
16.2% |
9.7% |
6.5% |
73.7% |
17.1% |
24.2% |
|
Q3'21 Mkt Weighted Average** |
102.0% |
15.9% |
14.9% |
16.9% |
7.3% |
14.3% |
35.2% |
11.4% |
14.3% |
11.7% |
69.7% |
12.4% |
18.7% |
|
*Market cap weighted as at 08/12/2022 |
|||||||||||||
|
**Market cap weighted as at 10/12/2021 |
|||||||||||||
Key takeaways from the table include:
- The listed banks recorded a 36.7% weighted average growth in core Earnings per Share (EPS), compared to a weighted growth of 102.0% recorded in Q3’2021 when the sector was recovering from a lower base. The performance during the period was mainly attributed to a 30.1% growth in non-funded income coupled with a 17.6% growth in net interest,
- The listed banks continued to implement their revenue diversification strategies as evidenced by non-funded income growth of 30.1% in Q3’2022 compared to 14.3% growth recoded in Q3’2021. The performance was mainly driven by 16.2% growth in total fees and commissions, which was an increase from 11.4% growth recorded during the same period last year,
- The Banks recorded a weighted average deposit growth of 9.7%, slower than the 14.3% growth recorded in Q3’2021, an indication of reduced investment risk in the business environment, and,
- Interest income grew by 16.4% in Q3’2022, compared to a growth of 15.9% recorded in Q3’2021 while the weighted average Yield on Interest Earning Assets (YIEA) remained relatively unchanged at 9.9%, similar to what was recorded in in Q3’2021 for the listed banking sector. Additionally, the Net Interest Margin (NIM) also remained unchanged at 7.3%, as was recorded in Q3’2021 for the whole listed banking sector
- The listed banks recorded a 24.2% weighted average Return on average Equity (RoaE), 5.5% points higher than the 18.7% weighted average recorded in Q3’2021. Additionally, the entire banking sector’s Return on Equity (ROE) recorded 5.2% points increase to 27.2% in Q3’2022, from 22.0% recorded in Q3’2021. As such, the Kenyan banking sector continues to record high profitability with ROE of 22.3% as of 2021 compared to other economies in the world where the average ROE stood at 13.7% as highlighted in the chart below:
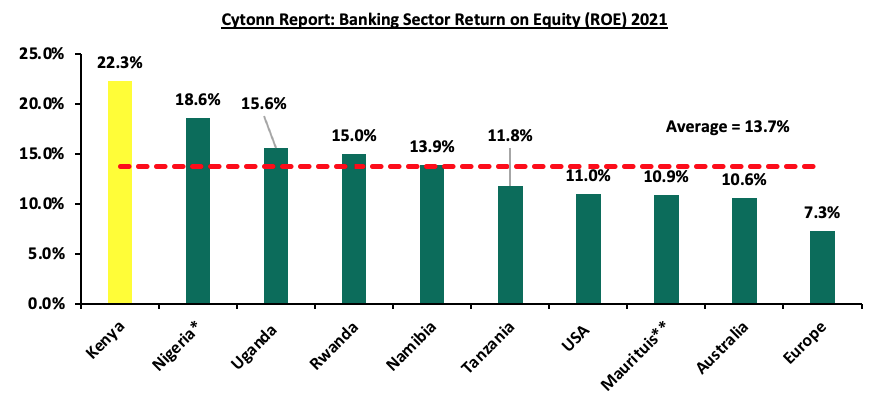
Source: Online research, *figures as of H1’2021, **figures as of Q3’2021
Section III: Outlook of the banking sector:
The banking sector continue to remain resilient despite the tough operating environment as evidenced by the increase in their profitability, with the Core Earnings Per Share (EPS) growing by 36.7%, with the increased revenue diversification continuing to bear fruit. However, we expect profitability to be weighed down in medium term as a result of expected increase in provisioning aimed at cushioning banks from the elevated credit risk arising from increased inflationary pressures. Based on the current operating environment, we believe the future performance of the banking sector will be mainly shaped by the following key factors:
- Revenue Diversification: In Q3’2022, Non-Funded Income (NFI) recorded a 30.1% weighted average growth, an increase from the 14.3% growth recorded in Q3’2021, with many banks diversifying their revenue sources. Additionally, weighted average contribution of NFI contribution to total operating income increased to 38.1% in Q3’2022, from the 35.2% weighted average contribution recorded in Q3’2021. We therefore believe that there exists an opportunity for the sector to further increase NFI contribution to revenue given the continuous adoption of digital channels by banks and their clients after the pandemic has created more revenue opportunities for the sector. Additionally, the reintroduction of charges for transactions between bank accounts and mobile money wallets as from January 2023, is expected to continue spurring NFI growth in the medium-long term due to the increased adoption of digital channels, which present an avenue for an increase in fees on transactions,
- Growth in Interest income: Going forward, we expect interest income growth to remain a key driver in the banking industry, evidenced by the 16.4% growth recorded in Q3’2022, higher than the 15.9% growth recorded in Q3’2021. Additionally, the government securities continue to witness increases in yields, as such we believe the continued allocation to government securities will lead to an increase in overall interest income. Further, we believe that as more banks continue to get approvals for their risk-based lending models, the banks will be able to effectively price their risk, expand loan books and consequently increase the interest income,
- Regional Expansion and Further Consolidation: Consolidation remains a key theme going forward with the current environment offering opportunities for larger banks with a sufficient capital base to expand and take advantage of the market's low valuations, as well as further consolidate out smaller and weaker banks. Notably, majority of the bigger banks have continued to cushion over unsystematic risks specific to the local market by expanding their operations into other African nations. Banks such as KCB and Equity Group have been leveraging on expansion and consolidation which has largely contributed to their increased asset base as well as earnings growth. As aforementioned, KCB Group recently announced the acquisition of Trust Merchant Bank (TMB) in DRC, while Equity Group is in the process of completing acquisition of Spire Bank. As such, we expect to see continued expansion trend aimed at revenue optimization. Additionally, Ethiopian government recently announced opening up of the financial sector to foreign investors, which provides a great opportunity for Kenyan banks to expand their operations into the Ethiopian market, and,
- Integration of Climate-Related Risk Management: The release of Guidance on Climate-Related Risk Management report by the Central Bank of Kenya (CBK) is driving banks to channel their long term financing into environmental-friendly assets that are more sustainable and have lower risk of damage loss as a result of climate change. Banks will also lend to clients whose activities do not pose an environmental risk and will ultimately lead to improvement of collateral quality. Key to note, Equity Group and KCB Group have sourced for loans from International Finance Corporation (IFC) aimed at supporting the growth of the bank’s climate finance portfolio.
Section IV: Brief Summary and Ranking of the Listed Banks:
As per our analysis on the banking sector from a franchise value and a future growth opportunity perspective, we carried out a comprehensive ranking of the listed banks. For the franchise value ranking, we included the earnings and growth metrics as well as the operating metrics shown in the table below in order to carry out a comprehensive review of the banks:
|
Bank |
Loan to Deposit Ratio |
Cost to Income (With LLP) |
Return on Average Capital Employed |
Deposits/ Branch (bn) |
Gross NPL Ratio |
NPL Coverage |
Tangible Common Ratio |
Non Funded Income/Revenue |
|
ABSA Bank |
103.0% |
54.7% |
26.4% |
3.4 |
6.6% |
80.0% |
12.4% |
30.4% |
|
NCBA Group |
57.6% |
58.7% |
23.4% |
4.4 |
12.6% |
65.3% |
12.8% |
49.2% |
|
Equity Bank |
66.9% |
56.6% |
29.2% |
2.8 |
9.5% |
63.0% |
10.0% |
41.4% |
|
KCB Group |
80.1% |
53.0% |
24.7% |
1.9 |
17.8% |
52.8% |
14.3% |
33.2% |
|
SCBK |
47.6% |
49.9% |
22.7% |
13.0 |
15.4% |
82.4% |
14.2% |
35.7% |
|
Coop Bank |
77.6% |
56.8% |
23.2% |
2.4 |
14.0% |
69.3% |
15.2% |
38.6% |
|
Stanbic Bank |
88.6% |
57.9% |
20.4% |
10.7 |
10.1% |
63.4% |
13.4% |
44.6% |
|
DTBK |
67.7% |
62.1% |
13.0% |
2.7 |
12.7% |
45.2% |
13.7% |
29.0% |
|
I&M Holdings |
75.1% |
59.7% |
15.3% |
3.7 |
9.5% |
75.4% |
14.6% |
35.4% |
|
HF Group |
90.7% |
96.7% |
0.9% |
1.8 |
20.3% |
77.2% |
13.8% |
32.4% |
|
Weighted Average Q3’2022 |
73.7% |
55.7% |
24.6% |
4.2 |
12.3% |
65.7% |
12.8% |
38.1% |
|
Market cap weighted as at 08/12/2022 |
||||||||
The overall ranking was based on a weighted average ranking of Franchise value (accounting for 60.0%) and intrinsic value (accounting for 40.0%). The Intrinsic Valuation is computed through a combination of valuation techniques, with a weighting of 40.0% on Discounted Cash-flow Methods, 35.0% on Residual Income and 25.0% on Relative Valuation, while the Franchise ranking is based on banks operating metrics, meant to assess efficiency, asset quality, diversification, and profitability, among other metrics. The overall Q3’2022 ranking is as shown in the table below:
|
Bank |
Franchise Value Rank |
Intrinsic Value Rank |
Weighted Rank |
H1'2022 |
Q3’2022 |
|
KCB Group Plc |
3 |
1 |
1.8 |
4 |
1 |
|
Equity Group Holdings Ltd |
4 |
2 |
2.8 |
1 |
2 |
|
Co-operative Bank of Kenya Ltd |
1 |
5 |
3.4 |
2 |
3 |
|
ABSA |
4 |
3 |
3.4 |
3 |
3 |
|
I&M Holdings |
2 |
6 |
4.4 |
5 |
5 |
|
NCBA Group Plc |
8 |
4 |
5.6 |
9 |
6 |
|
SCBK |
6 |
8 |
7.2 |
7 |
7 |
|
DTBK |
9 |
7 |
7.8 |
8 |
8 |
|
Stanbic Bank/Holdings |
7 |
9 |
8.2 |
6 |
9 |
|
HF Group Plc |
10 |
10 |
10 |
10 |
10 |
Major Changes from the Q3’2022 Ranking are:
- KCB Group’s rank improved to position 1 in Q3’2022 from position 4 in H1’2022, majorly driven by a strong intrinsic score as well as an improvement in the group’s management quality with the Cost to income ratio without LLPs declining to 45.1% from 45.7%, coupled with an improvement in the Group’s NPL ratio to 17.8%, from 21.4% in Q1’2022,
- Equity Group’s rank declined to position 2 in Q3’2022 from position 1 in H1’2022 attributable to a deterioration in Cost to Income without LLPs to 47.1%, from 46.7% recorded in H1’2022, coupled with an increase the Gross NPL ratio to 9.5% in Q3’2022 from 8.8% in H1’2022. Additionally, the Group’s performance was weighed down by the reduction in the Gross NPL Coverage to 63.0%, from 64.1% recorded in H1’2022 which led to a decline in the bank’s franchise value score, and,
- NCBA Group’s rank improved to position 6 in Q3’2022, from position 9 H1’2022, mainly attributable to 1.0% points decline in the Group’s NPL ratio to 12.6%, from 13.6% recorded in H1’2022 as well as an increase in the Group’s Return on Average Equity to 21.2% from 17.3% in H1’2022. Additionally, the Group’s Net Interest Margin increased to 6.0%, from the 5.9% recorded in H1’2022.
For more information, see our Cytonn Q3’2022 Listed Banking Sector Review
Disclaimer: The views expressed in this publication are those of the writers where particulars are not warranted. This publication, which is in compliance with Section 2 of the Capital Markets Authority Act Cap 485A, is meant for general information only and is not a warranty, representation, advice or solicitation of any nature. Readers are advised in all circumstances to seek the advice of a registered investment advisor.


