Following the release of the FY’2022 results by Kenyan listed banks, the Cytonn Financial Services Research Team undertook an analysis on the financial performance of the listed banks and identified the key factors that shaped the performance of the sector. For the earnings notes of the various banks, click the links below:
- Equity Group FY’2022 Earnings Note;
- KCB Group FY’2022 Earnings Note;
- Standard Chartered Bank Kenya FY’2022 Earnings Note;
- ABSA Bank Kenya FY’2022 Earnings Note;
- NCBA Group FY’2022 Earnings Note;
- Co-operative Bank FY’2022 Earnings Note;
- Diamond Trust Bank Kenya (DTB-K) FY’2022 Earnings Note;
- I&M Group Holdings FY’2022 Earnings Note;
- Stanbic Holdings FY’2022 Earnings Note;
- HF Group FY’2022 Earnings Note;
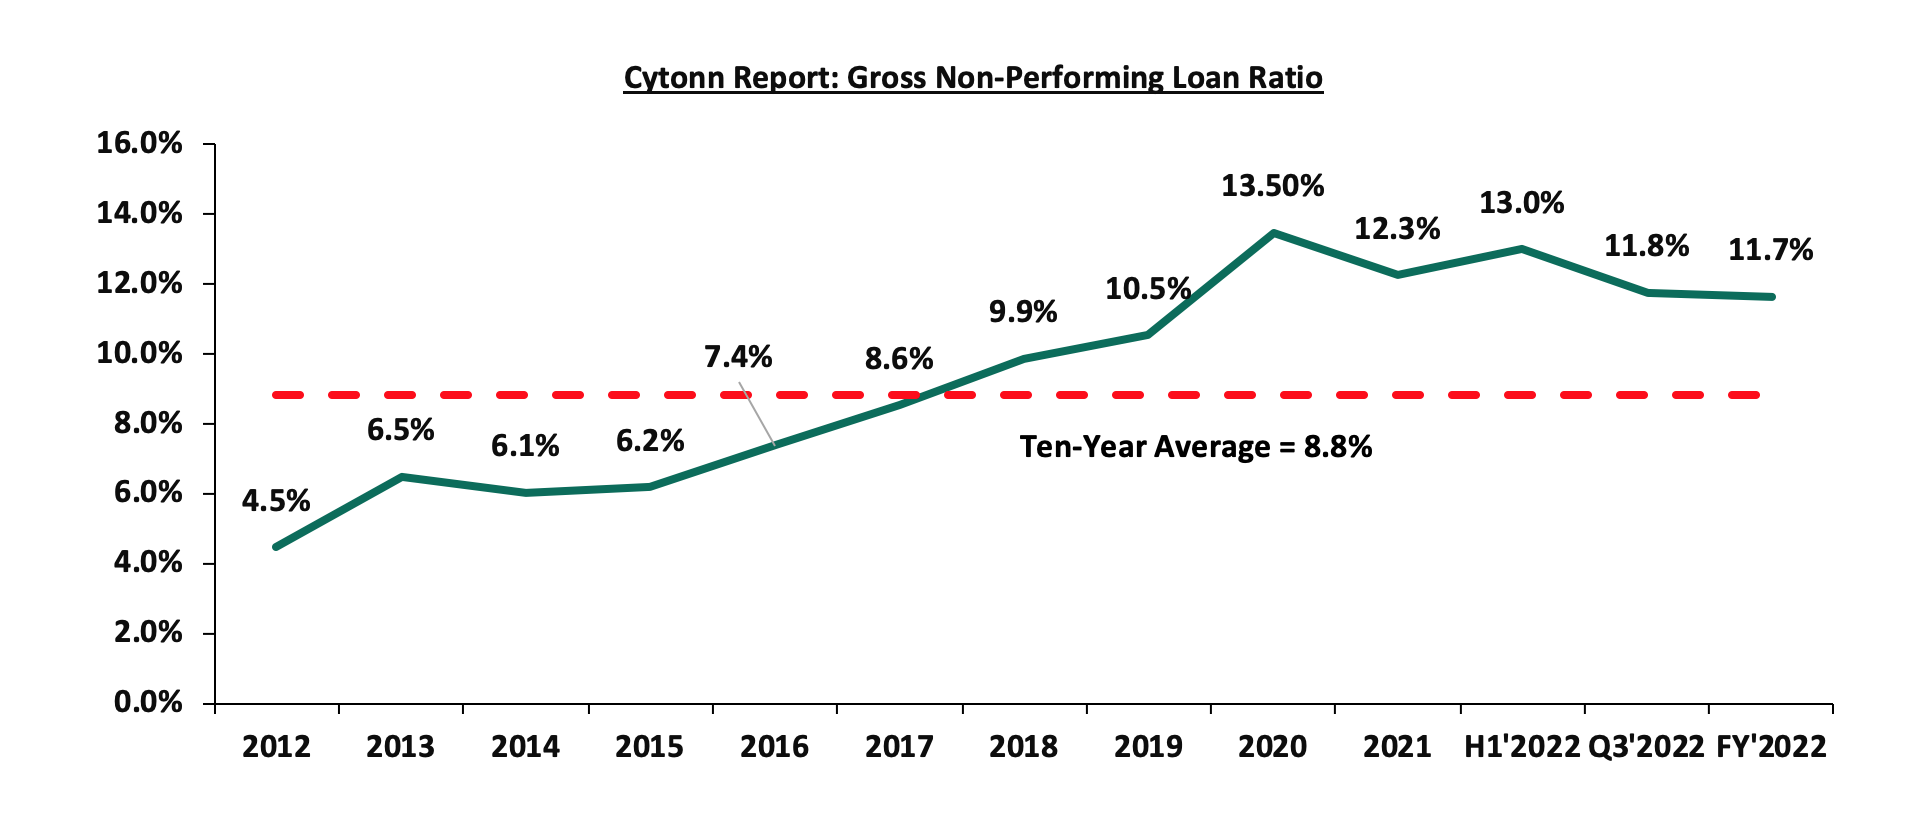
The Core Earnings per Share (EPS) for the listed banks recorded a weighted growth of 26.6% in FY’2022, compared to a weighted growth of 82.9% recorded in FY’2021, indicating the banking sector’s continued resilience despite the tough operating business environment occasioned by elevated inflationary pressures. The performance in FY’2022 was mainly attributable to a 31.6% growth in non-funded income coupled with a 19.2% growth in net interest income. Additionally, the listed banks’ Asset Quality improved with weighted average NPL ratio declining by 0.6% points to 11.7% in FY’2022, from 12.3% in FY’2021. We however note that despite this improvement in the asset quality, the NPL ratio remains higher than the 10-year average of 8.8%.
The report is themed “Banks Maintain Strong Profitability Despite Challenging Business Environment” where we assess the key factors that influenced the performance of the banking sector in FY’2022, the key trends, the challenges banks faced, and areas that will be crucial for growth and stability of the banking sector going forward. As such, we shall address the following:
- Key Themes that Shaped the Banking Sector Performance in FY’2022,
- Summary of the Performance of the Listed Banking Sector in FY’2022,
- The Focus Areas of the Banking Sector Players Going Forward, and,
- Brief Summary and Ranking of the Listed Banks based on the outcome of our analysis.
Section I: Key Themes That Shaped the Banking Sector Performance in FY’2022
Below, we highlight the key themes that shaped the banking sector in FY’2022 which include; regulation, regional expansion through mergers and acquisitions, asset quality and capital raising for onward lending:
- Regulation:
- Risk-based Lending: The Central Bank of Kenya has been working on a risk-based lending model to price loans since the Interest Cap law was repealed in 2019. The model’s main goal is to allow banks to lend in line with the estimated risks of each borrower. Additionally, this is a shift from negative listing of defaulters to a new system of credit score rating that does not deny borrowers credit on the strength of their credit bureau reference scores. The model targets borrowers who are deemed risker with majority operating in micro, small and medium enterprises that have been struggling to access formal credit. Notably, as of November 2022, at least 23 of the banks had their models approved by the CBK, with Equity Bank being the first commercial bank to roll out the risked-based lending. However, the approval rate for the models has been gradual in a bid to avoid causing distress to customers through high interest rates. Additionally, the full implementation has also been slowed down as a result of insufficient data to assess client’s risk profile, and,
- Regulation of Digital Lenders. In March 2022, the Central Bank of Kenya (CBK) gazetted the digital lenders regulationspaving way for the CBK to oversee licensing, governance and lending practices of Digital Credit Providers (DCPs). The regulations focus on addressing public concerns given the significance growth in number of digital lenders as well protecting borrowers from uncharacterized practices of unregulated digital credit providers, particularly their high costs, unethical debt collection practices, and misuse of personal information. Some of the Key take-outs from the regulations include;
-
- Digital Credit Provides (DCPs) shall not invite or collect deposits in any form, including the taking of cash collateral as security for loans, in the course of carrying out digital credit business,
- Lenders are forbidden from sharing customer information with any other person except with the customer’s consent, or seek permission under any written law,
- DCPs are not allowed to submit negative credit information of a customer or any other person to a Credit Reference Bureau where the outstanding amount relating to the credit information does not exceed Kshs 1,000.0, and,
- In a move to combat money laundering, all digital credit providers to issue evidence and sources of funds invested or proposed to be invested in the business and demonstrate that the funds are not proceeds of crime
Since the gazettement of the regulation last year, CBK has received a total of 401 applications, with only 32 DCPS having been licensed as of March 2023, while the other applicants are at different stages of approval process. The application period for licensing elapsed in September 2022 and the authority noted that all unregulated DCPs and those which did not apply for licensing will cease operations.
- Credit Repair Framework: In November 2022, the Central Bank of Kenya (CBK) announced the roll out of a Credit Repair Framework by commercial banks, microfinance banks, and mortgage finance companies. The main objective of the Framework is to improve the credit standing of mobile phones digital borrowers who had been adversely listed with Credit Reference Bureaus (CRBs) for failing to service their mobile loans. The Framework covers loans with a repayment period of 30 day or less, with the institutions expected to provide a discount of at least 50.0% of the non-performing mobile phone digital loans outstanding as at the end of October 2022. This initiative by the CBK has been welcomed by banks with NCBA Group and ABSA Bank disclosing writing off non-performing digital loans amounting to Kshs 11.5 bn and Kshs 1.8 bn, respectively. As such, this is expected to increase access to credit and other financial services by borrowers operating in personal and micro-enterprises sectors which are yet to fully recover from adverse effects the Covid-19 pandemic, and,
- Reinstatement of mobile money and bank account transactions charges: In December 2022, the central Bank of Kenya (CBK) announced the reinstatement of charges for transactions between mobile wallets and bank accounts which were waived in March 2020, as an emergency response to facilitate use of mobile money and reduce handling of hard cash during Covid-19 pandemic period. The reinstatement of the charges took effect on 1 January 2023. Notably, the reintroduced charges have the following elements;
-
- The revised maximum charges for transfers from bank accounts to mobile money wallets reduced by on average up to 61.0%, and mobile money wallet to bank account by on average up to 47.0%,
- Tariffs for pay bills that collect and disburse funds by businesses, companies and institutions were reduced by on average 50.0%, and,
- The charges levied by banks for banks to mobile money transactions were reduced by on average 45.0%.
The following are developments that happened after FY’2022:
- The Central Bank of Kenya announced the issuanceof the Foreign Exchange Code (the FX Code) on 22 March 2023 to commercial banks, in a move to regulate wholesale transactions of the foreign exchange market in Kenya. The measure was in response to the wide variation of exchange rate spread in the market, as discussed in our currency review note. The FX Code aims to promote a robust and transparent foreign currency market through the following reporting guidelines;
- Compliance with FX Code- All market participants (commercial banks and foreign exchange brokers) will be required to conduct a self-assessment and submit to the CBK a report on an institution’s level of compliance with the FX Code by 30 April 2023. Further, all market participants will be required to submit to CBK a detailed compliance implementation plan that is approved by its Board by 30 June 2023, and each participant must be fully compliant with the aforementioned code by 31 December 2023,
- Reporting Mechanism- All market participants will be required to submit a quarterly report to CBK, on the level of compliance to the FX Code within 14 days after the end of every calendar quarter, with the first report due by July 14, 2023,
- In the event of non-compliance, CBK may take appropriate enforcement and other administrative action including monetary penalties as provided for under the Banking Act against any market participant, and,
- Prohibitive Practices- The FX Code is majorly to identify practices that are geared towards market disruptions such as price quotations or manipulating price movements creating artificial delays, or false impression on market depth and liquidity by any market participants will result in heavy penalties. Additionally, market participants are not to engage in position or points parking (artificial transactions to conceal positions or transfer profits or losses).
- Regional Expansion through Mergers and Acquisitions: Kenyan banks are continuously looking at having an extensive regional reach and in FY’2022, there was one completed acquisition done by KCB Group as follows:
On 14 December 2022, KCB Group announcedthat it had completed acquisition of the 85.0% stake in Trust Merchant Bank (TMB), after receiving all the regulatory approvals. This came after KCB Group entered into a definitive agreement with the shareholders of TMB in August 2022 to acquire 85.0% of the shares in the Democratic Republic of Congo (DRC)- based lender, with an option to acquire the remaining stake after two years. This acquisition made KCB Group the second Kenyan banking group to enter the DRC banking market after Equity Group Holdings, with KCB Group now having its presence in seven countries. For this acquisition, KCB Group had not disclosed the actual value of the deal but as highlighted in our Cytonn Weekly 31/2022, KCB Group had cited that they would pay a cash consideration based on the net asset value of TMB at completion of the proposed transaction using a Price to Book (P/B) multiple of 1.5x.
The following are Mergers and Acquisitions that happened after FY’2022:
- On 30 January 2023, the Central Bank of Kenya (CBK) announcedthat Commercial International Bank (Egypt) S.A.E (CIB) had completed acquisition of additional 49.0% shareholding of Mayfair CIB Bank Limited (MBL) at Kshs 5.0 bn following the earlier acquisition of 51.0% stake in MBL announced in April 2020. As such, MBL is now a fully owned subsidiary of CIB,
- On 31 January 2023, Equity Group Holdings PLc, through Equity Bank Kenya Limited (EBKL) announced that it had completed the acquisition of certain assets and liabilities of the troubled local Bank, Spire Bank Limited after obtaining all the required regulatory approvals. The completion of the acquisition followed the Assets and Liabilities Purchase Agreement, which was announced in September 2022, as highlighted in our Cytonn Weekly #37/2022. As such, Equity Bank Kenya Limited took over Spire Banks’s 12 branches as well as all existing depositors in Spire Bank, other than remaining deposits from its largest shareholder, Mwalimu Sacco. For more information, please see our Unit Trust Funds (UTFs) Performance, Q3’2022, &Cytonn Monthly-January 2023, and,
- On 17 March 2023 the Central Bank of Kenya (CBK) announced that Premier Bank Limited Somalia (PBLS) had completed acquisition of 62.5% shareholding of First Community Bank Limited (FCB) effective 27 March 2023. This came after receiving regulatory approvals from the CBK and the Cabinet Secretary for the National Treasury. FCB, which has been in operation since June 2008, is classified as a tier 3 bank in Kenya with 18 branches and a market share of 0.3% as at December 2022. The acquisition by Premier Bank Limited Somalia (PBLS), came at a time when FCB has been struggling to meet regulatory Capital adequacy requirements. For more information, please see our Cytonn Weekly #11/2023, and,
Below is a summary of the deals in the last 9 years that have either happened, been announced or expected to be concluded:
|
Cytonn Report: Summary of Acquisition Deals |
||||||
|
Acquirer |
Bank Acquired |
Book Value at Acquisition (Kshs bn) |
Transaction Stake |
Transaction Value (Kshs bn) |
P/Bv Multiple |
Date |
|
Equity Group |
Spire Bank |
0.01 |
Undisclosed |
Undisclosed |
N/A |
Sep-22* |
|
KCB Group PLC |
Trust Merchant Bank (TMB) |
12.4 |
85.0% |
15.7 |
1.5x |
August-22 |
|
Access Bank PLC (Nigeria) |
Sidian Bank |
4.9 |
83.4% |
4.3 |
1.1x |
June-22* |
|
KCB Group |
Banque Populaire du Rwanda |
5.3 |
100.0% |
5.6 |
1.1x |
August-21 |
|
I&M Holdings PLC |
Orient Bank Limited Uganda |
3.3 |
90.0% |
3.6 |
1.1x |
April-21 |
|
KCB Group** |
ABC Tanzania |
Unknown |
100% |
0.8 |
0.4x |
Nov-20* |
|
Co-operative Bank |
Jamii Bora Bank |
3.4 |
90.0% |
1 |
0.3x |
Aug-20 |
|
Commercial International Bank |
Mayfair Bank Limited |
1.0 |
100.0% |
Undisclosed |
N/D |
May-20* |
|
Access Bank PLC (Nigeria) |
Transnational Bank PLC. |
1.9 |
100.0% |
1.4 |
0.7x |
Feb-20* |
|
Equity Group ** |
Banque Commerciale Du Congo |
8.9 |
66.5% |
10.3 |
1.2x |
Nov-19* |
|
KCB Group |
National Bank of Kenya |
7.0 |
100.0% |
6.6 |
0.9x |
Sep-19 |
|
CBA Group |
NIC Group |
33.5 |
53%:47% |
23.0 |
0.7x |
Sep-19 |
|
Oiko Credit |
Credit Bank |
3.0 |
22.8% |
1 |
1.5x |
Aug-19 |
|
CBA Group** |
Jamii Bora Bank |
3.4 |
100.0% |
1.4 |
0.4x |
Jan-19 |
|
AfricInvest Azure |
Prime Bank |
21.2 |
24.2% |
5.1 |
1.0x |
Jan-18 |
|
KCB Group |
Imperial Bank |
Unknown |
Undisclosed |
Undisclosed |
N/A |
Dec-18 |
|
SBM Bank Kenya |
Chase Bank Ltd |
Unknown |
75.0% |
Undisclosed |
N/A |
Aug-18 |
|
DTBK |
Habib Bank Kenya |
2.4 |
100.0% |
1.8 |
0.8x |
Mar-17 |
|
SBM Holdings |
Fidelity Commercial Bank |
1.8 |
100.0% |
2.8 |
1.6x |
Nov-16 |
|
M Bank |
Oriental Commercial Bank |
1.8 |
51.0% |
1.3 |
1.4x |
Jun-16 |
|
I&M Holdings |
Giro Commercial Bank |
3.0 |
100.0% |
5.0 |
1.7x |
Jun-16 |
|
Mwalimu SACCO |
Equatorial Commercial Bank |
1.2 |
75.0% |
2.6 |
2.3x |
Mar-15 |
|
Centum |
K-Rep Bank |
2.1 |
66.0% |
2.5 |
1.8x |
Jul-14 |
|
GT Bank |
Fina Bank Group |
3.9 |
70.0% |
8.6 |
3.2x |
Nov-13 |
|
Average |
78.9% |
1.2x |
||||
|
* Announcement Date ** Deals that were dropped |
||||||
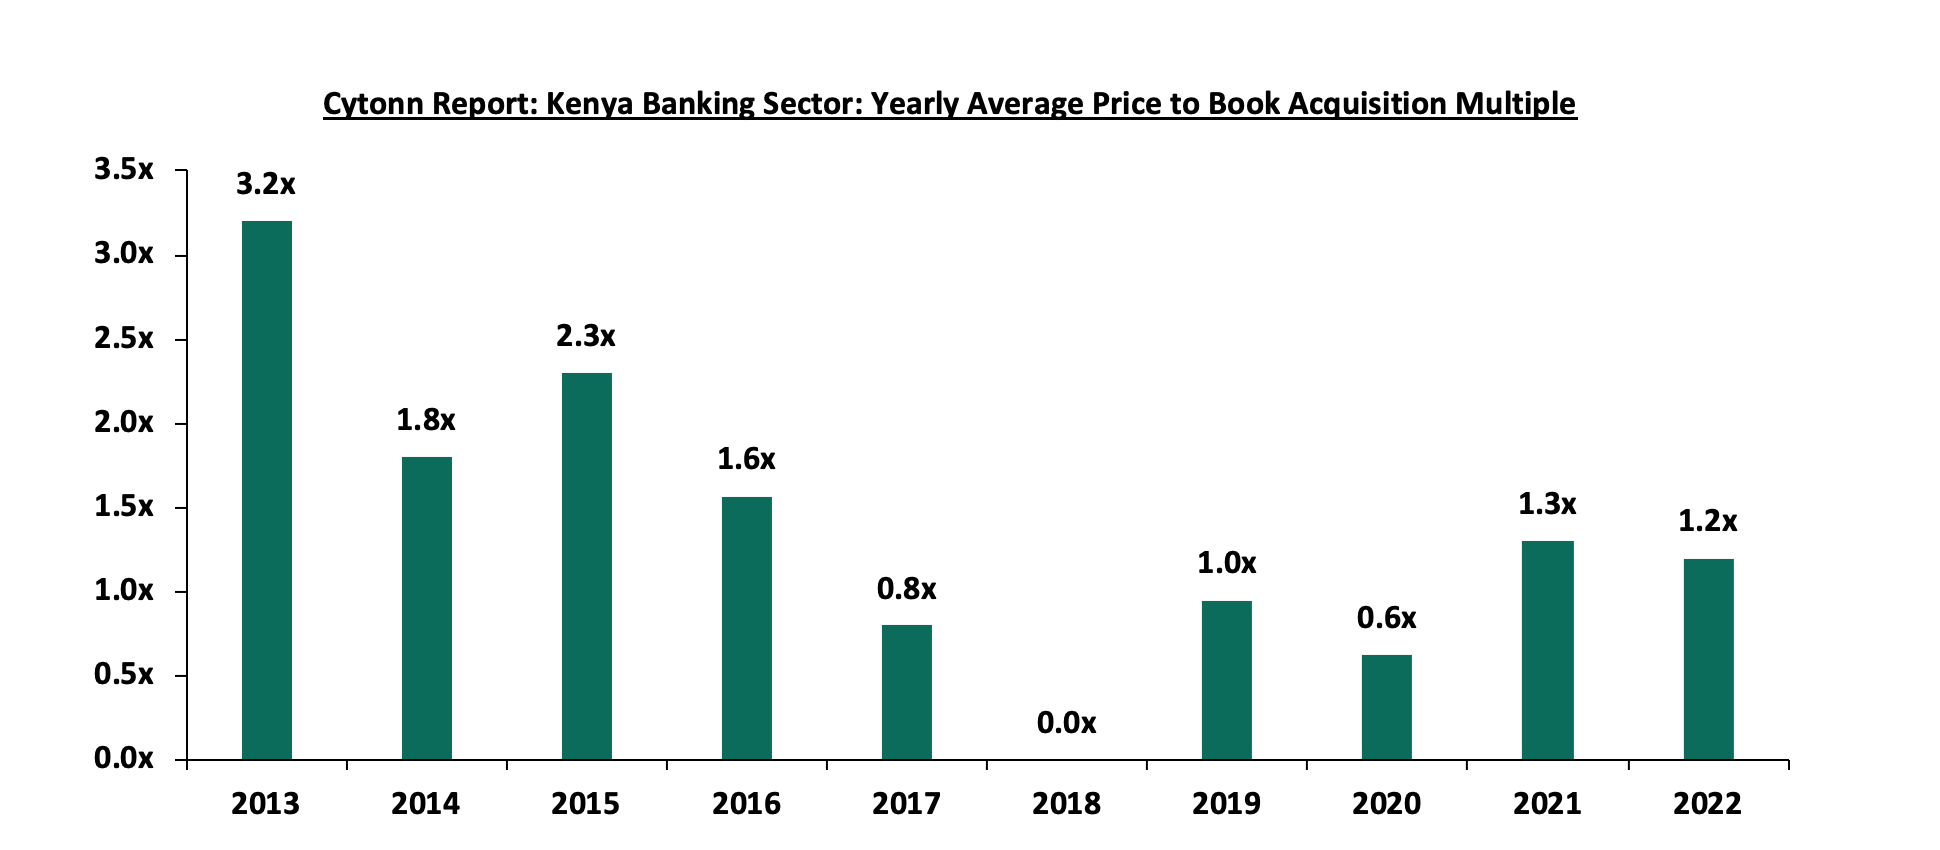
In 2022 the acquisition valuations for banks dropped to 1.2x from 1.3x recorded in 2021. As such, the valuations still remain low compared to historical prices paid as highlighted in the chart below;
As at the end of FY’2022, the number of commercial banks in Kenya stood at 38, same as in FY’2021 but lower than 43 licensed banks in FY’2015, respectively. The ratio of the number of banks per 10 million populations in Kenya now stands at 6.7x, which is a reduction from 9.0x in FY’2015 demonstrating continued consolidation in the banking sector. However, despite the ratio improving, Kenya still remains overbanked as the number of banks remains relatively high compared to the African major economies. To bring the ratio to 5.5x, we ought to reduce the number of banks from the current 38 banks to 32 banks. For more on this see our topical.
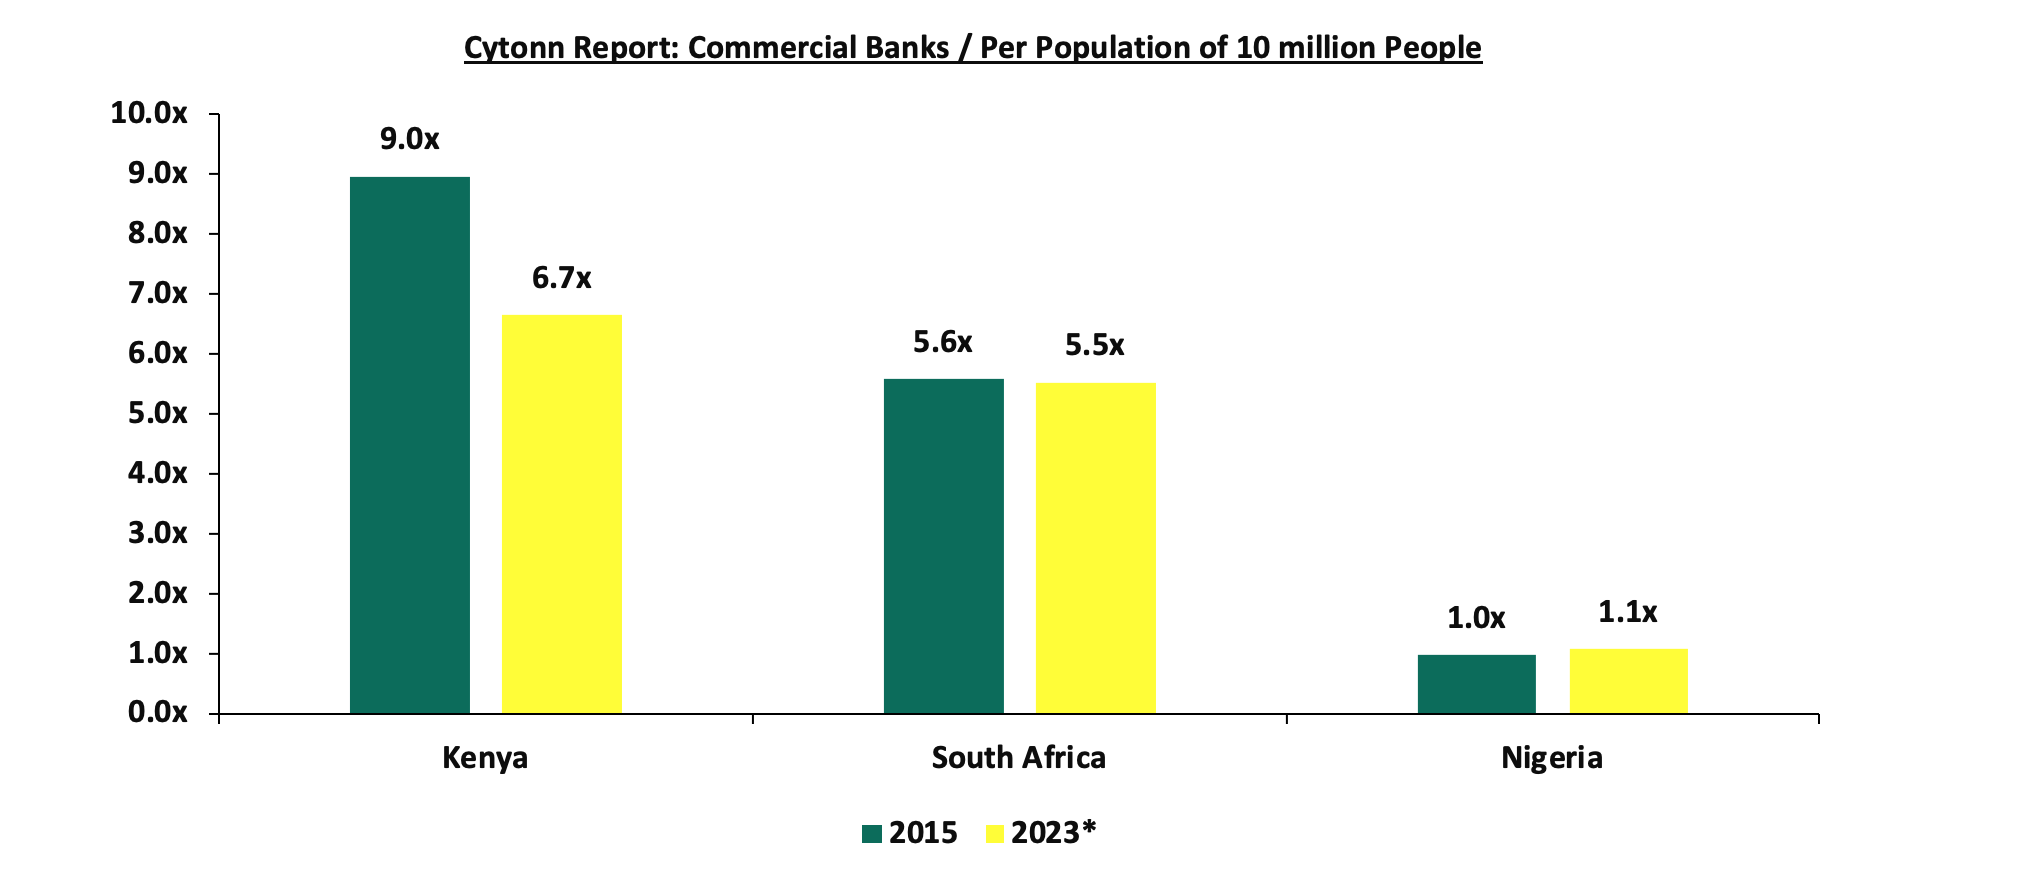
Source: World Bank, Central Bank of Kenya, South Africa Reserve Bank, Central Bank of Nigeria; * Data as of March 2023
- Asset Quality: Asset quality for listed banks improved in FY’2022, with the weighted average Gross Non-Performing Loan ratio (NPL) declining by 0.6% points to 11.7%, from 12.3% recorded in FY’2021. However, the performance remained 2.9% points above the ten-year average of 8.8%. The improvement in asset quality in FY’2022 was mainly driven by 3.0% points decline in NCBA Group’s NPL ratio to 13.0% in FY’2022, from 16.0% in FY’2021 coupled with 1.8% points decline in Standard Chartered Bank- Kenya NPL ratio to 14.2% from 16.0% in FY’2022. The significant improvement in NCBA Group’s asset quality was mainly attributable to an 11.7% decline in gross non-performing loans to Kshs 39.1 bn in FY’2022 from Kshs 44.3 bn in FY’2021 coupled with a 9.1% increase in gross loans to Kshs 301.8 bn in FY’2022 from 276.7 bn in FY’2021. However, the improvement in asset quality was weighed down by 0.7% points increase in Stanbic bank’s NPL ratio to 10.0% from 9.3% in FY’2021, attributable to 26.4% increase in Gross non-performing loans to Kshs 28.4 bn, from Kshs 22.5 bn in FY’2021. A total of seven out of the ten listed Kenyan banks recorded improvement in asset quality, despite the deterioration of the general business environment which was evidenced by the average Purchasing Managers Index coming at 49.2 in FY’2022, 1.6 points lower than the average of 50.8 recorded in 2021. However, according to the March 2023 MPC Press Release, the NPL ratio for the entire banking sector stood at 13.3% in December 2022, a 0.2% points increase from 13.1% recorded in December 2021, signifying a deterioration in asset quality of the sector FY’2022. Going forward, we expect credit risk to remain elevated in the short term mainly as a result of the sustained inflationary pressures reflected in deterioration of general business environment in Q1’2023, with the average Purchasing Manager’s Index in the quarter coming in at 49.3, compared to 50.3 recorded in a similar period in 2022, on the back of elevated commodity prices, which have resulted in reduced consumer spending. The chart below highlights the asset quality trend for the listed banks:
The table below highlights the asset quality for the listed banking sector:
|
Cytonn Report: Listed Banks Asset Quality |
||||||
|
|
FY'2022 NPL Ratio* |
FY'2021 NPL Ratio** |
% point change in NPL Ratio |
FY'2022 NPL Coverage* |
FY'2021 NPL Coverage** |
% point change in NPL Coverage |
|
ABSA |
7.5% |
7.9% |
(0.4%) |
80.5% |
77.7% |
2.8% |
|
Equity |
8.4% |
8.6% |
(0.2%) |
70.5% |
68.7% |
1.8% |
|
I&M |
9.7% |
9.5% |
0.2% |
71.9% |
71.4% |
0.5% |
|
Stanbic |
10.0% |
9.3% |
0.7% |
63.1% |
58.1% |
5.0% |
|
DTB-K |
12.0% |
12.9% |
(0.9%) |
46.3% |
41.8% |
4.5% |
|
NCBA |
13.0% |
16.0% |
(3.0%) |
58.5% |
73.6% |
(15.1%) |
|
Co-op |
14.0% |
14.6% |
(0.6%) |
65.1% |
62.6% |
2.5% |
|
SCB-K |
14.2% |
16.0% |
(1.8%) |
87.1% |
84.4% |
2.7% |
|
KCB |
17.0% |
16.6% |
0.4% |
52.4% |
52.9% |
(0.5%) |
|
HF |
19.7% |
21.1% |
(1.4%) |
78.8% |
73.6% |
5.2% |
|
Mkt Weighted Average |
11.7% |
12.3% |
(0.6%) |
67.4% |
65.5% |
1.9% |
|
*Market cap weighted as at 20/04/2022 |
||||||
|
**Market cap weighted as at 14/04/2021 |
||||||
Key take-outs from the table include;
- Asset quality for the listed banks improved during the year, with market weighted average NPL ratio declining by 0.6% points to 11.7%, from 12.3% in FY’2021. The improvement was largely driven by an improvement in NCBA Group’s, Standard Chartered Bank Kenya’s and HF Group’s asset quality with their NPL ratios declining by 3.0%, 1.8% and 1.4%% points to 13.0%, 14.2% and 19.7% respectively in FY’2022, from 16.0%, 16.0%, and 21.1%, respectively in FY’2021,
- Stanbic Bank had the highest NPL Ratio jump by 0.7% to 10.0% in FY’2022 from 9.3% in FY’2021, attributable to 26.4% increase in Gross non-performing loans to Kshs 28.4 bn, from Kshs 22.5 bn in FY’2021, which outpaced the 17.5% increase in gross loans to Kshs 284.8 bn, from Kshs 242.4 bn recorded in FY’2021,
- NCBA Group recorded the highest improvement in its asset quality with the NPL ratio declining by 3.0% points to 13.0% from 16.0% recoded in FY’2021. The improvement in asset quality was mainly attributable to an 11.7% decline in gross non-performing loans to Kshs 39.1 bn in FY’2022 from Kshs 44.3 bn in FY’2021 coupled with a 9.1% increase in gross loans to Kshs 301.8 bn in FY’2022 from 276.7 bn in FY’2021, and,
- Market weighted average NPL Coverage for the listed banks increased by 1.9% points to 67.4% in FY’2022, from 65.5% recorded in FY’2021, majorly on the back of increased NPL coverage recorded Co-operative Bank of Kenya, HF Group and Stanbic Holdings of 6.7%, 5.2% and 5.0% respectively. However, NCBA Group’s NPL coverage declined by 15.1% points to 58.5% in FY’2022 from 73.6% in FY’2021, owing to a decline of 36.1% in General Loan Loss Provisions to Kshs 15.6 bn, from Kshs 24.4 bn in FY’2021, an indication of reducing credit risk in the bank loan portfolio.
- Capital Raising: In FY’2022, listed banks continued to borrow from international institutions to not only strengthen their capital positions but also boost their ability to lend to the perceived riskier Micro Small and Medium Sized Enterprises (MSMEs) segment. In the period under review;
-
- Equity Group received USD 165.0 mn (Kshs 18.6 bn) facility from the International Finance Corporation (IFC) to Equity Bank Kenya in January 2022. For more information see our Weekly #19/2022,
- The International Finance Corporation (IFC) disclosed a USD 150.0 mn (Kshs 18.0 bn) credit facility to KCB Group in form of a senior unsecured loan with a maturity of 7-years and a grace period of 2-years. The credit facility was aimed at supporting the growth of the bank’s climate finance portfolio which entails clients in sectors such as manufacturing, real estate and agriculture. For more information please see our Cytonn Monthly-August 2022, and,
- The International Finance Corporation (IFC) disclosedthat it would extend USD 100.0 mn (Kshs 12.2 bn) to Diamond Trust Bank (DTB) under the WCS COVID-19 FIGE response facility in form of a senior debt investment with 24-month maturity and renewable once on an aggregate of up to 36 months. For more information, please see our Cytonn Weekly #46/2022.
Section II: Summary of the Performance of the Listed Banking Sector in FY’2022:
The table below highlights the performance of the banking sector, showing the performance using several metrics, and the key take-outs of the performance;
|
Cytonn Report: Listed Banks Performance in FY’2022 |
|||||||||||||
|
Bank |
Core EPS Growth |
Interest Income Growth |
Interest Expense Growth |
Net Interest Income Growth |
Net Interest Margin |
Non-Funded Income Growth |
NFI to Total Operating Income |
Growth in Total Fees & Commissions |
Deposit Growth |
Growth in Government Securities |
Loan to Deposit Ratio |
Loan Growth |
Return on Average Equity |
|
HF Group |
138.9% |
8.8% |
0.7% |
18.2% |
5.0% |
63.5% |
28.9% |
(1.9%) |
5.5% |
30.4% |
91.2% |
4.6% |
3.1% |
|
DTB-K |
53.9% |
18.2% |
23.5% |
14.5% |
5.3% |
43.5% |
28.3% |
19.9% |
16.9% |
5.8% |
66.5% |
15.1% |
10.0% |
|
NCBA |
34.8% |
12.7% |
11.5% |
13.5% |
5.9% |
36.8% |
49.7% |
5.0% |
7.0% |
4.8% |
55.5% |
14.3% |
17.2% |
|
I&M |
34.3% |
12.9% |
18.0% |
9.9% |
6.3% |
45.7% |
35.7% |
20.7% |
5.3% |
(9.9%) |
76.4% |
13.3% |
15.3% |
|
ABSA |
34.2% |
27.5% |
25.9% |
27.9% |
8.2% |
17.2% |
29.7% |
0.3% |
13.0% |
0.7% |
93.4% |
21.1% |
24.3% |
|
SCB-K |
34.0% |
14.3% |
(6.5%) |
18.1% |
7.0% |
13.5% |
34.6% |
(17.7%) |
5.1% |
10.6% |
50.0% |
10.7% |
22.1% |
|
CO-OP |
33.2% |
10.9% |
11.0% |
10.9% |
8.9% |
32.7% |
36.1% |
32.7% |
3.9% |
(5.9%) |
80.1% |
9.4% |
21.2% |
|
Stanbic |
25.7% |
27.3% |
15.2% |
31.8% |
5.9% |
23.7% |
40.9% |
(0.5%) |
19.5% |
42.9% |
87.8% |
16.4% |
15.3% |
|
KCB |
19.5% |
15.3% |
27.1% |
11.5% |
7.5% |
39.8% |
33.3% |
18.6% |
35.6% |
2.7% |
76.0% |
27.8% |
22.0% |
|
Equity |
15.1% |
26.8% |
31.7% |
25.0% |
7.2% |
34.5% |
41.1% |
26.2% |
9.7% |
(4.1%) |
67.2% |
20.2% |
26.7% |
|
FY'22 Mkt Weighted Average* |
26.6% |
19.7% |
20.1% |
19.2% |
7.2% |
31.6% |
37.7% |
13.8% |
13.7% |
3.1% |
71.8% |
18.1% |
21.8% |
|
FY'21 Mkt Weighted Average** |
82.9% |
13.8% |
11.5% |
15.2% |
7.1% |
10.9% |
34.7% |
16.6% |
13.5% |
18.1% |
69.7% |
13.5% |
20.2% |
|
*Market cap weighted as at 20/04/2023 |
|||||||||||||
|
**Market cap weighted as at 14/04/2021 |
|||||||||||||
Key takeaways from the table include:
- The listed banks recorded a 26.6% growth in core Earnings per Share (EPS) in FY’2022, compared to the weighted average growth of 82.9% in FY’2021, an indication of sustained performance despite the tough operating environment experienced in FY’2022. The performance during the period was mainly driven by a 31.6% weighted average growth in non-funded income coupled with a 19.2% weighted average growth in net interest income,
- The listed banks continued to implement their revenue diversification strategies as evidenced by non-funded income weighted average growth of 31.6% in FY’2022 compared to a weighted average growth of 10.9% recoded in FY’2021. The performance was largely supported by increase in foreign exchange income recorded by the banks during the year as a result of increased dollar demand in the country,
- Listed banks investments in government securities slowed down in FY’2022 having recorded a market weighted average growth of 3.1% compared to a 18.1% growth recorded in FY’2021. The slowed growth of investment in Kenya government securities was partly attributable to the increased perceived risk of default by the government coupled with high debt sustainability concerns given the current high public debt stock as well as the upcoming Eurobond maturity in the next fiscal year,
- The listed banks Net loans and advances to customers recorded a weighted average growth of 18.1% in FY’2022 compared to 13.5% in FY’2021, an indication of increased lending despite the elevated credit risk,
- Interest income recorded a weighted average growth of 19.7% in FY’2022, compared to 13.8% in FY’2021. Similarly, interest expenses recorded a market weighted average growth of 20.1% in FY’2022 compared to a growth of 11.5% in FY’2022. As such, the net interest income recorded a weighted average growth of 19.2% in FY’2022 compared to 15.2% in FY’2022,
The listed banks recorded a 21.8% weighted average Return on average Equity (RoaE), 1.6% points higher than the 20.2% weighted average recorded in FY’2021. Additionally, the entire banking sector’s Return On Equity (ROE) recorded6% points increase to 25.2% in FY’2022, from 21.6% recorded in FY’2021. As such, the Kenyan banking sector continues to record high profitability compared to other economies in the world as highlighted in the chart below: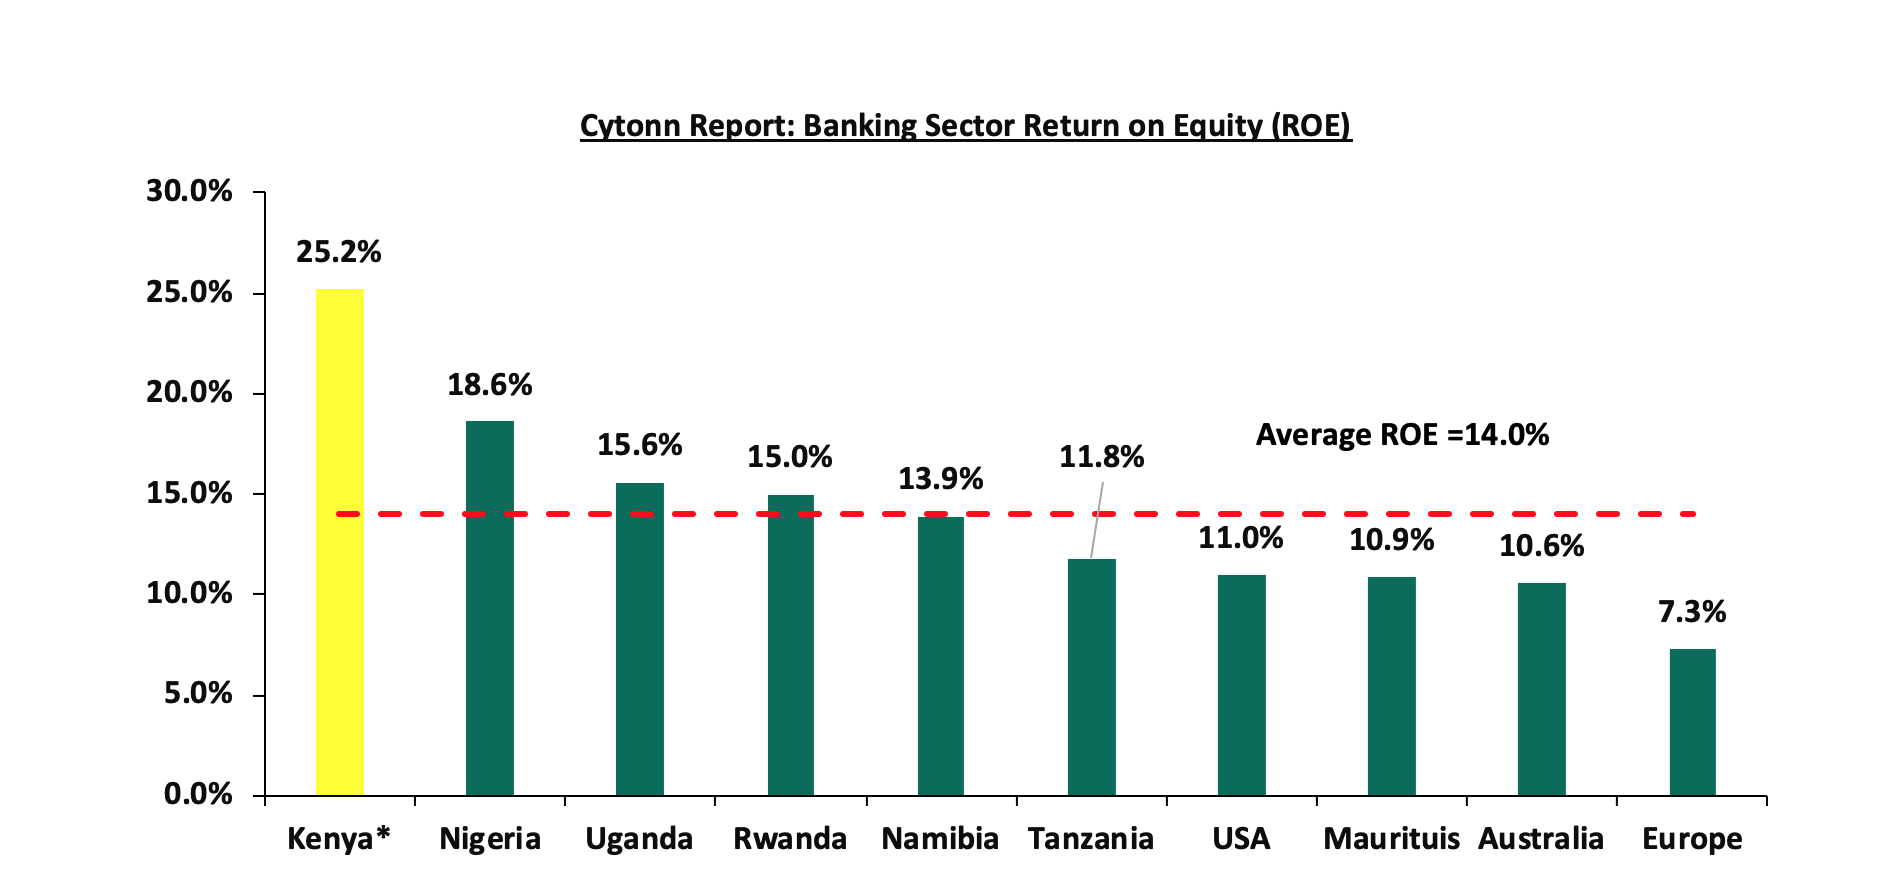
Source: Online research, * Figure as of FY’2022
Section III: Outlook of the banking sector:
The banking sector continue to remain resilient despite the tough operating environment occasioned by elevated inflationary pressures, as evidenced by the increase in their profitability, with the Core Earnings Per Share (EPS) growing by 26.6%, majorly supported by the continued diversification of revenue by banks. However, we expect profitability to be weighed down in the short to medium term as a result of expected increase in provisioning aimed at cushioning banks from the elevated credit risk arising from persistent inflationary pressures. As such, we expect the future performance of the banking sector to be mainly supported by the following key factors:
- Growth in Interest income: Going forward, we expect interest income growth to remain a key driver in the banking industry, evidenced by the weighted average growth of 19.7% in FY’2022, compared to 13.8% recorded in FY’2021. Additionally, the continued approval of banks risk-based lending models, will be enable banks to effectively price their risk, expand loan books and consequently increase the interest income,
- Revenue Diversification: In FY’2022, Non-Funded Income (NFI) recorded a 31.6% weighted average growth compared to a 10.9% weighted growth in FY’2021, with many banks diversifying their revenue sources. Consequentially, weighted average contribution of NFI contribution to total operating income came at 37.7% in FY’2022, 3.0% points higher than 34.7% weighted average growth contribution recorded in FY’2021. As such, there exists an opportunity for the sector to further increase NFI contribution to revenue given the continuous adoption of digitization. Additionally, the reinstatement of charges for transactions between bank accounts and mobile money wallets is also expected to continue spurring NFI growth due to the increased adoption of digital channels, and,
- Regional Expansion and Further Consolidation: Consolidation remains a key theme going forward with the current environment offering opportunities for well capitalized banks to expand and take advantage of the market's low valuations, as well as further consolidate out smaller and less capitalized banks. Notably, majority of the bigger banks have continued to cushion over unsystematic risks specific to the local market by expanding their operations into other African nations. Banks such as KCB and Equity Group have been leveraging on expansion and consolidation which has largely contributed to their increased asset base as well as earnings growth. As such, we expect to see continued expansion trend aimed at revenue optimization. Additionally, Ethiopian government opened up the financial sector to foreign investors which provide a great opportunity for Kenyan banks to expand their operations into the untapped market.
Section IV: Brief Summary and Ranking of the Listed Banks:
As per our analysis on the banking sector from a franchise value and a future growth opportunity perspective, we carried out a comprehensive ranking of the listed banks. For the franchise value ranking, we included the earnings and growth metrics as well as the operating metrics shown in the table below in order to carry out a comprehensive review of the banks:
|
Cytonn Report: Listed Banks Earnings, Growth and Operating Metrics |
||||||||
|
Bank |
Loan to Deposit Ratio |
Cost to Income (With LLP) |
Return on Average Capital Employed |
Deposits/ Branch (bn) |
Gross NPL Ratio |
NPL Coverage |
Tangible Common Ratio |
Non Funded Income/Revenue |
|
ABSA Bank |
93.4% |
54.7% |
34.7% |
3.7 |
7.5% |
80.5% |
13.2% |
29.7% |
|
NCBA Group |
55.5% |
62.2% |
28.1% |
5.0 |
13.0% |
58.5% |
12.5% |
49.7% |
|
Equity Bank |
67.2% |
59.0% |
34.7% |
3.0 |
8.4% |
70.5% |
11.4% |
41.1% |
|
KCB Group |
76.0% |
55.9% |
30.8% |
2.3 |
17.0% |
52.4% |
11.7% |
33.3% |
|
SCBK |
50.0% |
49.7% |
31.3% |
8.7 |
14.2% |
87.1% |
13.8% |
34.6% |
|
Coop Bank |
80.1% |
59.3% |
28.3% |
2.3 |
14.0% |
65.1% |
16.9% |
36.1% |
|
Stanbic Bank |
87.7% |
62.1% |
20.5% |
10.1 |
10.0% |
63.1% |
13.3% |
40.9% |
|
DTBK |
65.5% |
69.1% |
14.0% |
3.0 |
12.0% |
46.3% |
12.9% |
28.3% |
|
I&M Holdings |
76.4% |
59.8% |
20.5% |
3.8 |
9.7% |
71.9% |
16.2% |
35.7% |
|
HF Group |
91.2% |
91.6% |
2.2% |
1.8 |
19.7% |
78.8% |
14.9% |
28.9% |
|
Weighted Average FY’2022 |
71.8% |
58.0% |
30.0% |
4.2 |
11.7% |
67.4% |
13.1% |
37.7% |
|
Market cap weighted as at 20/04/2022 |
||||||||
The overall ranking was based on a weighted average ranking of Franchise value (accounting for 60.0%) and intrinsic value (accounting for 40.0%). The Intrinsic Valuation is computed through a combination of valuation techniques, with a weighting of 40.0% on Discounted Cash-flow Methods, 35.0% on Residual Income and 25.0% on Relative Valuation, while the Franchise ranking is based on banks operating metrics, meant to assess efficiency, asset quality, diversification, and profitability, among other metrics. The overall FY’2022 ranking is as shown in the table below:
|
Cytonn Report: Listed Banks FY’2022 Rankings |
|||||
|
Bank |
Franchise Value Rank |
Intrinsic Value Rank |
Weighted Rank |
FY'2021 |
FY’2022 |
|
ABSA |
1 |
4 |
2.8 |
4 |
1 |
|
Equity Group Holdings Ltd |
4 |
3 |
3.4 |
4 |
2 |
|
KCB Group Plc |
7 |
1 |
3.4 |
3 |
3 |
|
Co-operative Bank of Kenya Ltd |
3 |
5 |
4.2 |
2 |
4 |
|
I&M Holdings |
2 |
6 |
4.4 |
1 |
5 |
|
NCBA Group Plc |
8 |
2 |
4.4 |
8 |
6 |
|
SCBK |
5 |
8 |
6.8 |
6 |
7 |
|
Stanbic Bank/Holdings |
6 |
9 |
7.8 |
7 |
8 |
|
DTBK |
9 |
7 |
7.8 |
9 |
9 |
|
HF Group Plc |
10 |
10 |
10 |
10 |
10 |
Major Changes from the FY’2022 Ranking are:
- ABSA Bank’s rank improved to position 1 in FY’2022 from position 4 in FY’2021, majorly driven by a strong franchise score driven by improvement in the Bank’s management quality with Cost to income ratio with LLPs declining by 3.2% to 54.7% in FY'2022, from 57.9% in FY'2021 while Cost to income ratio without LLPs declined by 4.5% points to 40.6% in FY’2022, from 45.1% in FY’2021. Additionally, the Bank’s Asset quality improved with the NPL ratio declining to 7.5%, from 7.9% in FY’2021,
- NCBA Group’s rank improved to position 6 in FY’2022, from position 8 H1’2022, mainly attributable to 3.0% points decline in the Group’s NPL ratio to 13.0%, from 16.0% recorded in FY’2021 as well as an increase in the Group’s Return on Average Equity to 17.2%, from 13.6% in FY’2021. Additionally, the Group’s Net Interest Margin increased to 5.9%, from the 5.7% recorded in FY’2021, and,
- I&M Group’s rank declined to position 5 in FY’2022, from position 1 in FY’2021, mainly due to a deterioration in the Group’s asset quality, as the Gross NPL ratio rose to 9.7%, from the 9.5% recorded in FY’2021.
For more information, see our Cytonn FY’2022 Listed Banking Sector Review
Disclaimer: The views expressed in this publication are those of the writers where particulars are not warranted. This publication, which is in compliance with Section 2 of the Capital Markets Authority Act Cap 485A, is meant for general information only and is not a warranty, representation, advice or solicitation of any nature. Readers are advised in all circumstances to seek the advice of a registered investment advisor.


