Following the release of the FY’2024 results by Kenyan listed banks, the Cytonn Financial Services Research Team undertook an analysis on the financial performance of the listed banks and identified the key factors that shaped the performance of the sector. For the earnings notes of the various banks, click the links below:
- Equity Group FY’2024 Earnings Note
- KCB Group FY’2024 Earnings Note
- Standard Chartered Bank Kenya FY’2024 Earnings Note
- ABSA Bank Kenya FY’2024 Earnings Note
- NCBA Group FY’2024 Earnings Note
- Co-operative Bank FY’2024 Earnings Note
- Stanbic Holdings FY’2024 Earnings Note
- I&M Group Holdings FY’2024 Earnings Note
- Diamond Trust Bank Kenya FY’2024 Earnings Note
- HF Group FY’2024 Earnings Note
The core earnings per share (EPS) for the listed banks recorded a weighted growth of 25.7% in FY’2024, compared to a weighted growth of 11.4% recorded in FY’2023, an indication of sustained performance supported by improved operating environment experienced in FY’2024 on the back of easing inflationary pressures and a strengthening Shilling. Notably, the inflation rate in FY’2024 averaged 4.5%, 3.2% points lower than the 7.7% average in FY’2023, with the Kenyan Shilling having appreciated by 17.4% against the USD in FY’2024, compared to a 26.8% depreciation in FY’2023. The performance in FY’2024 was supported by a 16.6% growth in net interest income coupled with a 12.2% growth in non-funded income, however lower than the 20.6% and 16.4% growth in net interest income and in non-funded income respectively in FY’2023, attributable to the increased interest rates that dampened borrowing and transaction activity. However, credit risk increased with the asset quality of listed banks deteriorating in FY’2024, with the weighted average Gross Non-Performing Loan ratio (NPL) increasing by 0.6% points to 13.2%, from 12.6% recorded in FY’2023. The performance remained 2.1% points above the ten-year average of 11.1%.
The report is themed “Banks Recalibrating for Growth Amid Macroeconomic Shifts” where we assess the key factors that influenced the performance of the banking sector in FY’2024, the key trends, the challenges banks faced, and areas that will be crucial for growth and stability of the banking sector going forward. As such, we shall address the following:
- Key Themes that Shaped the Banking Sector Performance in FY’2024,
- Summary of the Performance of the Listed Banking Sector in FY’2024,
- The Focus Areas of the Banking Sector Players Going Forward, and,
- Brief Summary and Ranking of the Listed Banks based on the outcome of our analysis
Section I: Key Themes That Shaped the Banking Sector Performance in FY’2024
In this section, we will highlight the main factors influencing the banking sector in FY’2024. These include regulation, digitization, interest rates, regional expansion through mergers and acquisitions, and asset quality:
- Regulation:
- Higher capital requirements: Following the enactment of The Business Laws (Amendment) Act 2024 the Central Bank of Kenya increased the minimum core capital requirement for commercial banks to Kshs 10.0 bn from the previous Kshs 1.0 bn that had been in effect since 2012. To facilitate compliance, lenders below this threshold were directed to incrementally grow the figure over a 5-year period, required to close 2025 with a minimum core capital of Kshs 3.0 bn, rising to Kshs 5.0 bn by the end of 2026, Kshs 7.0 bn by the end of 2027, Kshs 8.0 bn by the end of 2028 and full compliance at Kshs 10.0 bn by the end of 2029. This substantial increase aims to enhance the financial resilience of banks and ensure that new entrants are well-capitalized to support Kenya's economic development. In December, HF Group raised Kshs 6.0 bn through a rights issue to help boost its capital levels, as it was among the 12 banks with core capital below Kshs 3.0 billion required by end of 2025. Other banks in this category included Access Bank Kenya, Consolidated Bank of Kenya, UBA Kenya, Middle East Bank of Kenya, Development Bank of Kenya, Credit Bank, Paramount Bank, M-Oriental Bank Kenya, Commercial International Bank (CIB), Premier Bank Kenya, and Habib Bank AG Zurich. Consequently, banks have been asked to submit their plans for meeting the Kshs 10.0 bn core capital requirement, not just the first year. To meet the new core capital requirements, these banks may pursue rights issues, equity sales, mergers, or acquisitions.
- Lifting of moratorium on licensing of new commercial banks: Recently in a significant policy shift, on April 16, 2025, the Central Bank of Kenya (CBK), announced that with effect from July 1, 2025, it will lift the moratorium on licensing of new commercial banks that had been in place since November 2015. The moratorium was introduced in response to governance, risk management, and operational issues within the banking sector, aiming to create room for reforms. Since then, Kenya’s banking sector has seen notable progress, including stronger legal and regulatory frameworks, increased mergers and acquisitions, and the entry of new local and international strategic investors. With the moratorium now lifted, new entrants into Kenya’s banking sector must prove their ability to meet the revised minimum core capital requirement of Kshs 10.0 bn. This move opens the door for investors to apply for greenfield licenses, unlike the previous arrangement where entry was heavily reliant on mergers and acquisitions.
- Risk-based Lending: Over the years, the government has used various policy tools to curb the increasing interest rates and promote access to credit by the private sector. As such, after the repeal of the Interest Cap Law in 2019, the Central Bank of Kenya (CBK) intervened administratively by halting banks from repricing their loans. Instead, banks were required to develop and submit new risk-based lending formulas for approval. The model's primary purpose is to instil fairness and transparency in the credit pricing decisions as it allows Banks to price based on a customer’s risk profile. This represents a shift from the traditional practice of rejecting loan applicants solely based on their credit scores. The new credit scoring system primarily targets borrowers with higher risks, many of whom are micro, small, and medium-sized enterprises facing challenges in accessing traditional credit. As of September 2024, all 38 banks in the country had their models approved by the CBK, with Equity Bank being the first commercial bank to implement risk-based lending. However, the approval process of the models has been gradual in a bid to avoid causing distress to customers through high interest rates. Further, the full deployment has been slowed due to inadequate data to analyse the client's risk profile,
- Digitization: In FY’2024, digitization continued to be a transformative force in the banking sector, significantly improving how banks operate and deliver services. There has been a significant increase in the adoption of mobile and online banking platforms as customers now prefer to perform banking transactions from the comfort of their homes, leading to a decline in the use of physical branches. For instance, most of the listed banks disclosed that the majority of transactions were conducted through alternative channels, with Equity Group and KCB Group reporting that 85.9% and 99.0% of their transactions, respectively, were done through non-branch channels as of end of FY’2024,
- Interest Rates: Interest rates soared to historical highs in 2024 compared to 2023. Notably, the yields on Kenyan government securities were on an upward trajectory during the period under review, with the yield on the 91-day paper averaging 15.2% during the year, 3.0% points higher than the average of 12.2% in FY’2023, peaking at 16.7% for in month of April 2024. However, yields on the Kenyan government securities were on a downward trajectory in the second half of FY’2024, with the yield on the 91-day paper averaging 14.3% during the second half of the year and closing the year at 9.9% from 15.9% recorded at the close of 2023. The significant declines in rates towards the year end, especially in Q4’2024 led to a decrease in the listed bank’s interest income growth, softening to a weighted average growth of 21.1% in FY’2024, from a weighted average growth of 30.5% in FY’2023. Additionally, interest expense grew by a weighted average of 43.6% in FY’2024, down from 52.4% in FY’2023,
- Regional Expansion through Mergers and Acquisitions: Kenyan banks are increasingly expanding their regional footprint, with subsidiaries contributing significantly to overall profitability. For instance, Equity Group reported that, regional subsidiaries contributed 51.0% of the Group’s Profit Before Tax (PBT) in FY’2024, up from 50.0% in the same period last year, demonstrating the growing importance of these subsidiaries to the group’s earnings. Additionally, KCB Group's subsidiaries contributed 36.6% of the group's PBT in FY’2024. In 2024, there was one acquisition agreement announcement between Access Bank plc and KCB Group:
- On April 14, 2025, the Central Bank of Kenya announced the acquisition of 100.0% shareholding of National Bank of Kenya Limited (NBK) by Access Bank Plc from KCB Group Plc, following CBK’s approval on April 4, 2025 under Section 13 (4) of the Banking Act, and approval by the Cabinet Secretary for the National Treasury and Economic Planning on April 10, 2025, pursuant to Section 9 of the Banking Act. As part of the transaction, CBK, on April 4, 2025, further approved the transfer of certain assets and liabilities of National Bank of Kenya Limited to KCB Bank Kenya Limited pursuant to section 9 of the Banking Act. The acquisition and transfer shall take effect upon completion of the transaction in accordance with the terms of the Agreement between the parties.
- On March 20, 2024 Access Bank Plc announced that it had entered into a share purchase agreement with KCB Group Plc that would allow Access Bank Plc to acquire 100% shareholding in National Bank of Kenya Limited (NBK) from KCB. Access Bank Plc is a wholly owned subsidiary of Access Holdings Plc listed on the Nigerian Exchange as Access Corporation. Notably, KCB Bank had acquired the National Bank of Kenya back in 2019 in a rescue deal that was supervised by the Central Bank of Kenya. The announcement followed the release of the FY’2023 results for the KCB group, which revealed a decline in earnings with its Core earnings per share (EPS) declining by 8.3% to Kshs 11.7, from Kshs 12.7 in FY’2022. The transaction represents an important milestone for Access Bank as it moves closer to the achievement of its five-year strategic plan through increased scale in the Kenyan market. In the signed deal, Access Bank will pay multiples of 1.3x the book value of NBK, which stood at Kshs 10.6 bn as of end December 2023. This values the deal at about Kshs 13.3 bn with the actual figure to be announced when the transaction is completed.
- In April 2024, Sidian Bank disclosed that the founders of the bank and other nine individual shareholders relinquished a combined stake of 728,525 shares representing 16.6% stake to Pioneer General Insurance Limited, pioneer Life Investments Limited, Wizro Enterprises Limited, Afrah Limited, and Telesec Africa Limited. The transaction amounted to Kshs 0.8 bn translating to a price to book multiple (p/bv) of 1.0x. This follows an earlier transaction executed on October 2023 when Pioneer General Insurance, Wizpro Enterprise and Afram Limited bought 38.9% stake in the lender following a shareholders’ resolution passed on 20th September 2023 approving the sale.
The following are Mergers and Acquisitions that were completed in 2023:
- On January 30, 2023, the Central Bank of Kenya (CBK) announced that Commercial International Bank (Egypt) S.A.E (CIB) had completed the acquisition of an additional 49.0% shareholding of Mayfair CIB Bank Limited (MBL) at Kshs 5.0 bn following the earlier acquisition of 51.0% stake in MBL announced in April 2020. Consequently, MBL is now a fully owned subsidiary of CIB,
- On January 30, 2023, Equity Group Holdings , through Equity Bank Kenya Limited (EBKL) announced that it had completed the acquisition of certain assets and liabilities of the local Bank, Spire Bank Limited after obtaining all the required regulatory approvals. The completion of the acquisition followed the Assets and Liabilities Purchase Agreement, which was announced in September 2022, as highlighted in our Cytonn Weekly #37/2022. As such, Equity Bank Kenya Limited took over Spire Bank’s 12 branches as well as all existing depositors in Spire Bank, other than remaining deposits from its largest shareholder, Mwalimu Sacco. For more information, please see our Cytonn Monthly-January 2023,
- On March 17, 2023, the Central Bank of Kenya (CBK) announced that Premier Bank Limited Somalia (PBLS) had completed the acquisition of 62.5% shareholding of First Community Bank Limited (FCB) effective 27 March 2023. This came after receiving regulatory approvals from the CBK and the Cabinet Secretary for the National Treasury. FCB, which has been in operation since June 2008, is classified as a tier 3 bank in Kenya with 18 branches and a market share of 0.3% as at December 2022. The acquisition by Premier Bank Limited Somalia (PBLS), came at a time when FCB has been struggling to meet regulatory Capital adequacy requirements. For more information, please see our Cytonn Weekly #11/2023,
- On May 22, 2023, the Central Bank of Kenya (CBK) announced that Shorecap III, LP, a Private Equity fund governed by the laws of Mauritius, had acquired a 20.0% stake in Credit Bank Plc. The fund is managed by Equator Capital Partners LLC, and the acquisition took effect from June 15, 2023. While the CBK initially did not reveal the value of the deal, it has since been disclosed that Shorecap III, LP paid Ksh 0.7 billion for the 20.0% stake, valuing the bank at Ksh 3.64 bn. Shorecap III, LP assumed control of 7,289,928 ordinary shares, which make up 20.0% of the Bank’s ordinary shares. The funds helped lift Credit Bank from a regulatory capital breach. For additional details, refer to our Cytonn Weekly #21/2023,
- On December 1, 2023 Equity Group Holdings Plc (EGH) announced that it had successfully completed the acquisition of its Rwandan Subsidiary, Compagnie Générale de Banque (Cogebanque) Plc, marking a significant milestone in its regional expansion strategy. Equity Group now holds 198,250 shares representing 99.1% of the issued share capital of COGEBANQUE, following receipt of all regulatory and corporate approvals, officially making COGEBANQUE its subsidiary. EGH made the announcement it had entered into a binding agreement with the Government of Rwanda, Rwanda Social Security Board, and other investors of Compagnie Generale De Banque (Cogebanque) Plc Limited to acquire a 91.9% stake in the Rwanda based lender on June 14, 2023. Notably, EGH signed a share purchase agreement with the Sellers on July 28, 2023, committing to buy 183,854 shares at a rate of 297,406 Rwandan Francs per share upon completion on December 1, 2023, giving EGH ownership of 99.1% of the issued share capital. Concurrently, EGH proposed to purchase all outstanding shares from the other shareholders of Cogebanque, aiming to own up to 100% of Cogebanque’s issued shares,
Below is a summary of the deals in the last 10 years that have either happened, been announced or expected to be concluded:
|
Cytonn Report: Banking Sector Deals and Acquisitions |
||||||
|
Acquirer |
Bank Acquired |
Book Value at Acquisition (Kshs bn) |
Transaction Stake |
Transaction Value (Kshs bn) |
P/Bv Multiple |
Date |
|
Access Bank PLC (Nigeria) |
National Bank of Kenya |
10.6 |
100.00% |
13.3 |
1.3x |
Apr-25 |
|
Pioneer General Insurance and four other companies |
Sidian Bank |
5.0 |
16.57% |
0.8 |
1.0x |
Apr-24 |
|
Pioneer General Insurance and two other companies |
Sidian Bank |
5.0 |
38.91% |
2.0 |
1.0x |
Oct-23 |
|
Equity Group |
Cogebanque PLC ltd |
5.7 |
91.13% |
6.7 |
1.3x |
Dec-23 |
|
Shorecap III |
Credit Bank Plc |
3.6 |
20.00% |
0.7 |
1.0x |
Jun-23 |
|
Premier Bank Limited |
First Community Bank |
2.8 |
62.50% |
Undisclosed |
N/A |
Mar-23 |
|
KCB Group PLC |
Trust Merchant Bank (TMB) |
12.4 |
85.00% |
15.7 |
1.5x |
Dec-22 |
|
Equity Group |
Spire Bank |
Unknown |
Undisclosed |
Undisclosed |
N/A |
Sep-22* |
|
Access Bank PLC (Nigeria)* |
Sidian Bank |
4.9 |
83.40% |
4.3 |
1.1x |
June-22* |
|
KCB Group |
Banque Populaire du Rwanda |
5.3 |
100.00% |
5.6 |
1.1x |
Aug-21 |
|
I&M Holdings PLC |
Orient Bank Limited Uganda |
3.3 |
90.00% |
3.6 |
1.1x |
Apr-21 |
|
KCB Group** |
ABC Tanzania |
Unknown |
100.00% |
0.8 |
0.4x |
Nov-20* |
|
Co-operative Bank |
Jamii Bora Bank |
3.4 |
90.00% |
1 |
0.3x |
Aug-20 |
|
Commercial International Bank |
Mayfair Bank Limited |
1.0 |
51.00% |
Undisclosed |
N/A |
May-20* |
|
Access Bank PLC (Nigeria) |
Transnational Bank PLC. |
1.9 |
100.00% |
1.4 |
0.7x |
Feb-20* |
|
Equity Group ** |
Banque Commerciale Du Congo |
8.9 |
66.50% |
10.3 |
1.2x |
Nov-19* |
|
KCB Group |
National Bank of Kenya |
7.0 |
100.00% |
6.6 |
0.9x |
Sep-19 |
|
CBA Group |
NIC Group |
33.5 |
53%.47% |
23 |
0.7x |
Sep-19 |
|
Oiko Credit** |
Credit Bank |
3.0 |
22.80% |
1 |
1.5x |
Aug-19 |
|
CBA Group** |
Jamii Bora Bank |
3.4 |
100.00% |
1.4 |
0.4x |
Jan-19 |
|
AfricInvest Azure |
Prime Bank |
21.2 |
24.20% |
5.1 |
1.0x |
Jan-18 |
|
KCB Group |
Imperial Bank |
Unknown |
Undisclosed |
Undisclosed |
N/A |
Dec-18 |
|
SBM Bank Kenya |
Chase Bank Ltd |
Unknown |
75.00% |
Undisclosed |
N/A |
Aug-18 |
|
DTBK |
Habib Bank Kenya |
2.4 |
100.00% |
1.8 |
0.8x |
Mar-17 |
|
SBM Holdings |
Fidelity Commercial Bank |
1.8 |
100.00% |
2.8 |
1.6x |
Nov-16 |
|
M Bank |
Oriental Commercial Bank |
1.8 |
51.00% |
1.3 |
1.4x |
Jun-16 |
|
I&M Holdings |
Giro Commercial Bank |
3.0 |
100.00% |
5 |
1.7x |
Jun-16 |
|
Mwalimu SACCO |
Equatorial Commercial Bank |
1.2 |
75.00% |
2.6 |
2.3x |
Mar-15 |
|
Centum |
K-Rep Bank |
2.1 |
66.00% |
2.5 |
1.8x |
Jul-14 |
|
GT Bank |
Fina Bank Group |
3.9 |
70.00% |
8.6 |
3.2x |
Nov-13 |
|
Average |
|
|
73.3% |
|
1.3x |
|
|
Average: 2013 to 2018 |
|
|
73.5% |
|
1.7x |
|
|
Average: 2019 to 2024 |
|
|
73.2% |
|
1.0x |
|
|
* Announcement Date ** Deals that were dropped |
||||||
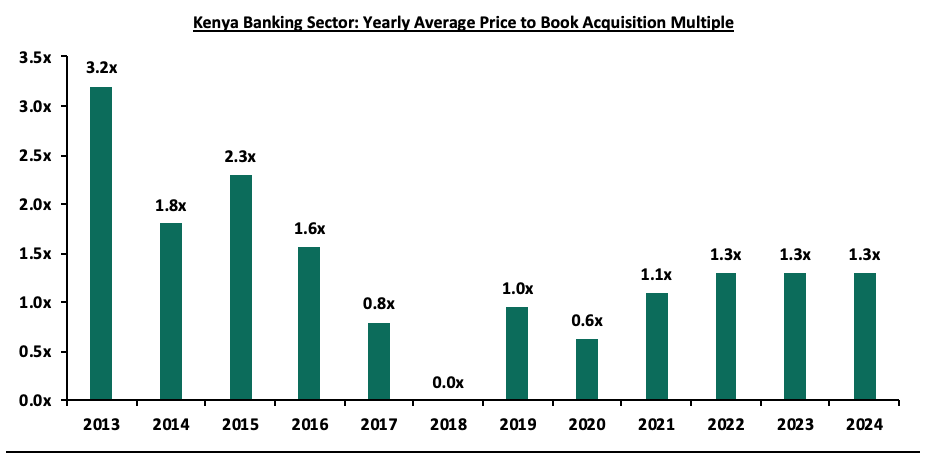
In 2024, the average acquisition valuations for banks have remained unchanged at 1.3x, similar to what was recorded in 2023. As such, the valuations still remain low compared to historical prices paid, as highlighted in the chart below;
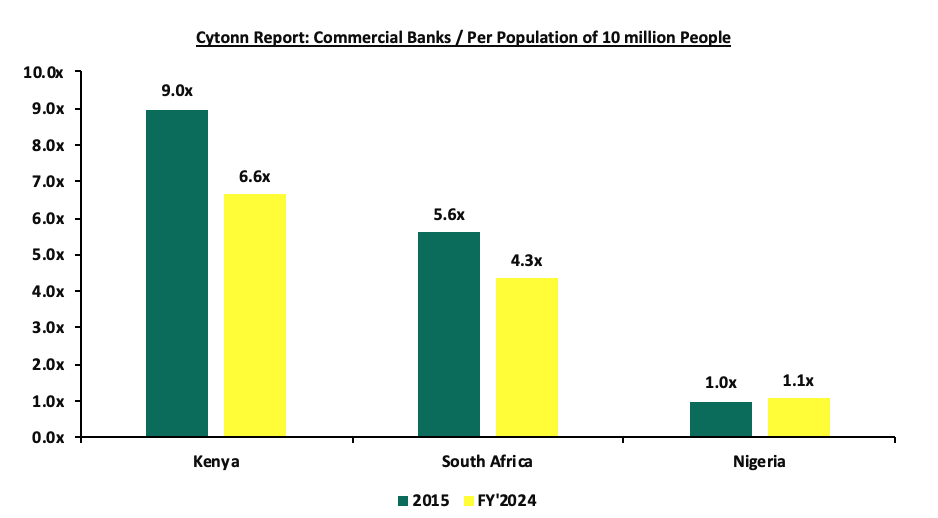
As at the end of FY’2024, the number of commercial banks in Kenya stood at 38, same as in FY’2023, but lower than the 43 licensed banks in FY’2015. The ratio of the number of banks per 10 million population in Kenya now stands at 6.6x, which is a reduction from 9.0x in FY’2015, demonstrating continued consolidation in the banking sector. However, despite the ratio improving, Kenya still remains overbanked as the number of banks remains relatively high compared to the African major economies. To bring the ratio to 5.6x, we ought to reduce the number of banks from the current 38 banks to about 30 banks. This ongoing trend is expected to accelerate following the enactment of The Business Laws (Amendment) Act 2024 that mandated a significant increase in the minimum core capital for banks to Kshs 10.0 bn from the previous Kshs 1.0 bn that had been in effect since 2012. To facilitate compliance, lenders below this threshold were directed to incrementally grow the figure over a 5-year period, required to close 2025 with a minimum core capital of Kshs 3.0 bn, rising to Kshs 5.0 bn by the end of 2026, and full compliance at Kshs 10.0 bn by the end of 2029. The new capital requirement is likely to trigger further mergers and acquisitions (M&As), especially for smaller lenders that may struggle to meet the threshold, potentially reducing the number of banks even further. The chart below shows the commercial bank ratio per 10 million people across select African nations in comparison to Kenya;
Source: World Bank, Central Bank of Kenya, South Africa Reserve Bank, Central Bank of Nigeria
Additionally, on April 16, 2024, the Central Bank of Kenya (CBK), announced that with effect from July 1, 2025, it will lift the moratorium on licensing of new commercial banks that had been in place since November 2015. The moratorium was introduced in response to governance, risk management, and operational issues within the banking sector, aiming to create room for reforms. Since then, Kenya’s banking sector has seen notable progress, including stronger legal and regulatory frameworks, increased mergers and acquisitions, and the entry of new local and international strategic investors. With the moratorium now lifted, new entrants into Kenya’s banking sector must prove their ability to meet the revised minimum core capital requirement of Kshs 10.0 bn. This move opens the door for investors to apply for greenfield licenses, unlike the previous arrangement where entry was heavily reliant on mergers and acquisitions. Over the past decade, the moratorium contributed to a reduction in the number of banks in Kenya, to 38 currently from 43 in 2015.
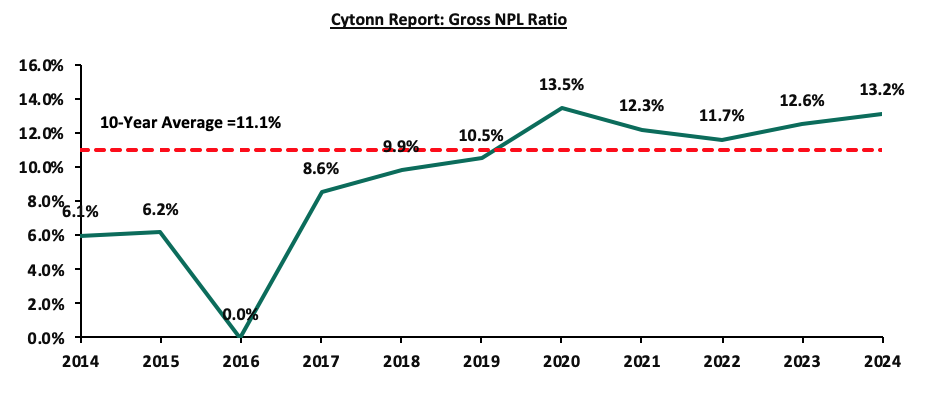
- Asset Quality: Asset quality for listed banks deteriorated in FY’2024, with the weighted average Gross Non-Performing Loan ratio (NPL) increasing by 0.6% points to 13.2%, from 12.6% recorded in FY’2023. The performance remained 2.1% points above the ten-year average of 11.1%. Notably, 6 out of the 10 listed banks recorded an increase in the NPL ratio, mainly driven by increased borrowing costs, and a decline in lending due to elevated credit risk. As such, non-performing loans in the banking industry increased by 8.3% to Kshs 672.6 bn in December 2024 from Kshs 621.3 bn in December 2023, with the industry’s gross NPL ratio increasing by 1.6% points to 16.4% in December 2024 from 14.8% in December 2023. Additionally, KCB Group’s NPL ratio rose the most by 2.9% points to 19.8%, from 17.0% in FY’2023, while Absa Group’s NPL ratio increased by 2.7% points to 12.6%, from 9.9% in FY’2023. KCB Group’s asset quality worsened due to an 8.4% rise in Gross Non-Performing Loans to Kshs 225.7 bn in FY’2024 from Kshs 208.3 bn in FY’2023, compared to a 7.2% decline in gross loans to Kshs 1,137.2 bn from Kshs 1,226.1 bn in FY’2023. The chart below highlights the asset quality trend for the listed banks:
However, the deterioration in listed banks' asset quality was mitigated by an improvement in Standard Chartered Bank’s asset quality, with the Gross NPL ratio decreasing by 2.3% points to 7.4% in FY’2024 from 9.7% in FY’2023. This was attributable to the 30.2% decrease in gross non-performing loans to Kshs 12.0 bn from Kshs 17.2 bn in FY’2023, outpacing the 8.9% decrease in gross loans to Kshs 161.5 bn from Kshs 177.2 bn in FY’2023. A total of six out of the ten listed Kenyan banks recorded a deterioration in asset quality, driven by the elevated borrowing costs, and a decline in lending due to elevated credit risk. In a bid to curb inflation and support the Shilling the Monetary Policy Committee (MPC) had adopted a tight monetary policy stance, raising the Central Bank Rate (CBR) to 13.00% in February 2024 and maintaining it at that rate for its two subsequent sittings up to July 2024. As a result of the high interest rates, the private sector credit growth was severely constrained recording contractions of 1.1% and 1.4% in the months of November and December 2024 respectively. The chart below shows the private sector credit growth:
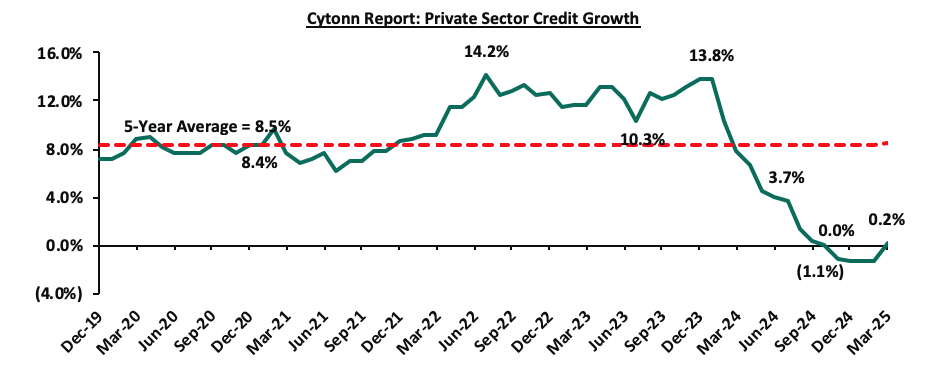
However, the Central Bank of Kenya lowered the Central Bank Rate (CBR) by a cumulative 175 basis points to 11.25% in December 2024 from 13.00% in July 2024 in the year, and further by 125 bps to 10.00% in March 2025, signalling a gradual easing of monetary policy, noting that its previous measures had stabilized the currency and anchored inflation. This reduction in CBR is expected to support credit growth and ease financial pressures on borrowers. Hence, going forward, we expect credit risk to decline gradually but remain at relatively elevated levels compared to previous years, owing to the improved business environment, eased inflationary pressures, and the appreciation of the Kenya shilling.
The table below highlights the asset quality for the listed banking sector:
|
Cytonn Report: Listed Banks Asset Quality |
||||||
|
|
FY’2024 NPL Ratio* |
FY’2023 NPL Ratio** |
% point change in NPL Ratio |
FY’2024 NPL Coverage* |
FY’2023 NPL Coverage** |
% point change in NPL Coverage |
|
KCB Group |
19.8% |
17.0% |
2.9% |
65.1% |
62.5% |
2.6% |
|
Absa Bank Kenya |
12.6% |
9.9% |
2.7% |
66.0% |
65.6% |
0.4% |
|
HF Group |
25.3% |
23.1% |
2.2% |
70.3% |
74.9% |
(4.6%) |
|
Equity Group |
13.6% |
12.1% |
1.5% |
63.7% |
52.4% |
11.3% |
|
I&M Group |
11.5% |
10.7% |
0.8% |
62.3% |
55.8% |
6.5% |
|
Co-operative Bank of Kenya |
17.0% |
16.2% |
0.7% |
63.9% |
57.2% |
6.8% |
|
Stanbic Holdings |
9.1% |
9.5% |
(0.4%) |
78.4% |
70.4% |
8.0% |
|
Diamond Trust Bank |
12.6% |
13.4% |
(0.8%) |
39.9% |
41.4% |
(1.6%) |
|
NCBA |
11.5% |
12.3% |
(0.9%) |
59.2% |
55.2% |
4.0% |
|
Standard Chartered Bank |
7.4% |
9.7% |
(2.3%) |
81.8% |
81.6% |
0.3% |
|
Mkt Weighted Average* |
13.2% |
12.6% |
0.7% |
66.8% |
60.7% |
6.1% |
|
*Market cap weighted as at 17/04/2025 |
||||||
|
**Market cap weighted as at 18/04/2024 |
||||||
Key take-outs from the table include;
- Asset quality for the listed banks deteriorated in FY’2024, with market weighted average NPL increasing by 0.6% points to 13.2% from a 12.6% in FY’2023. The worsening of asset quality was mainly driven by a deterioration in KCB Group, Absa Group, HF Group, Equity Group, I&M Group and Coop Bank’s asset quality with their NPL ratio increasing by 2.9%, 2.7%, 2.2%, 1.5%, 0.8% and 0.7% points respectively,
- KCB Group and Absa Group had the highest NPL ratio jumps by 2.9% and 2.7% points respectively to 19.8% and 12.6%, from 9.9% and 17.0% respectively in FY’2023. KCB Group’s asset quality worsened due to a 8.4% rise in Gross Non-Performing Loans to Kshs 225.7 bn in FY’2024 from Kshs 208.3 bn in FY’2023, outpacing a 7.2% decline in gross loans to Kshs 1,137.2 bn from Kshs 1,226.1 bn in FY’2023. Similarly, Absa Group’s asset quality worsened due to a 20.1% rise in Gross non-performing loans to Kshs 42.5 bn in FY’2024 from Kshs 35.4 bn in FY’2023, outpacing a 6.1% decline in gross loans to Kshs 337.1 bn from Kshs 358.9 bn in FY’2023, and,
- Market weighted average NPL Coverage for the listed banks increased by 6.1% points to 66.8% in FY’2024, from 60.7% recorded in FY’2023, majorly on the back of increased NPL coverage recorded by Equity Group, Stanbic Holdings, Co-op Bank, I&M Group, NCBA Bank, KCB Group, Absa Group and Standard Chartered Bank by 11.3%, 8.0%, 6.8%, 6.5%, 4.0%, 2.6%, 0.4% and 0.3% points respectively in FY’2024. However, the NPL coverage ratio of HF Group and Diamond Trust Bank Kenya decreased by 4.6% and 1.6% points respectively in FY’2024.
Section II: Summary of the Performance of the Listed Banking Sector in FY’2024:
The table below highlights the performance of the banking sector, showing the performance using several metrics, and the key take-outs of the performance;
|
Cytonn Report: Kenyan Listed Banks Performance FY’2024 |
|||||||||||||||
|
Bank |
Core EPS Growth |
Interest Income Growth |
Interest Expense Growth |
Net Interest Income Growth |
Net Interest Margin |
Non-Funded Income Growth |
NFI to Total Operating Income |
Growth in Total Fees & Commissions |
Deposit Growth |
Growth in Government Securities |
Loan to Deposit Ratio |
Loan Growth |
Return on Average Equity |
COF |
YIEA |
|
KCB Group |
64.9% |
26.9% |
25.0% |
28.0% |
7.8% |
16.6% |
33.0% |
10.1% |
(18.3%) |
(43.6%) |
71.7% |
(9.6%) |
24.6% |
4.6% |
12.4% |
|
Standard Chartered Bank |
45.0% |
20.0% |
83.4% |
13.4% |
9.5% |
40.4% |
34.4% |
11.9% |
(13.8%) |
34.7% |
51.3% |
(7.1%) |
30.1% |
1.7% |
11.1% |
|
Diamond Trust Bank Kenya |
28.2% |
12.0% |
21.6% |
3.0% |
5.5% |
7.3% |
31.5% |
15.8% |
(8.0%) |
5.5% |
63.8% |
(7.5%) |
11.3% |
6.3% |
11.5% |
|
Absa Bank Kenya |
27.5% |
19.3% |
30.1% |
15.4% |
10.1% |
10.8% |
25.8% |
1.7% |
1.2% |
37.2% |
84.2% |
(7.9%) |
27.0% |
4.5% |
14.2% |
|
I&M Group |
21.9% |
35.0% |
39.9% |
31.2% |
7.7% |
(2.8%) |
26.7% |
15.6% |
(1.1%) |
31.0% |
69.6% |
(7.8%) |
16.9% |
6.7% |
15.4% |
|
Stanbic Holdings |
12.8% |
37.8% |
105.7% |
(5.1%) |
5.9% |
(1.7%) |
38.8% |
(13.1%) |
(2.8%) |
67.9% |
71.6% |
(11.6%) |
19.1% |
7.1% |
12.6% |
|
Equity Group |
11.0% |
9.2% |
20.3% |
3.7% |
7.0% |
10.7% |
43.9% |
12.9% |
3.1% |
22.0% |
58.5% |
(7.7%) |
22.1% |
4.1% |
10.9% |
|
Co-operative Bank of Kenya |
9.8% |
24.9% |
45.7% |
13.9% |
8.3% |
10.1% |
36.1% |
3.2% |
12.1% |
15.1% |
73.8% |
(0.1%) |
19.7% |
6.4% |
13.9% |
|
NCBA Group |
1.9% |
16.0% |
34.5% |
(0.3%) |
5.7% |
(3.1%) |
45.0% |
5.5% |
(13.4%) |
(11.1%) |
60.2% |
(10.4%) |
21.2% |
7.4% |
12.5% |
|
HF Group |
(10.8%) |
23.1% |
41.0% |
4.4% |
5.0% |
21.2% |
36.1% |
36.1% |
8.3% |
75.3% |
81.9% |
0.2% |
4.3% |
7.5% |
12.0% |
|
FY'24 Mkt Weighted Average* |
25.7% |
21.1% |
43.6% |
11.7% |
7.7% |
12.2% |
36.3% |
7.3% |
(4.4%) |
15.4% |
66.3% |
(7.7%) |
22.9% |
5.0% |
12.5% |
|
FY'23 Mkt Weighted Average** |
11.4% |
30.5% |
52.4% |
20.6% |
7.5% |
16.4% |
37.0% |
18.4% |
25.0% |
2.2% |
69.0% |
9.5% |
21.2% |
4.0% |
11.2% |
|
*Market cap weighted as at 17/04/2025 |
|||||||||||||||
|
**Market cap weighted as at 18/04/2024 |
|||||||||||||||
Key takeaways from the table include:
- The listed banks recorded an 25.7% growth in core Earnings per Share (EPS) in FY’2024, compared to the weighted average growth of 11.4% in FY’2023, an indication of sustained performance supported by improved operating environment experienced in FY’2024 on the back of easing inflationary pressures and a strengthening Shilling. The performance during the period was mainly supported by a 11.7% weighted average growth in net interest income, coupled with a 12.2% weighted average growth in non-funded income,
- Investments in government securities investments by listed banks increased significantly in FY’2024, having recorded a market-weighted average growth of 15.4%, from the 2.2% increase recorded in FY’2023, with 8 of the 10 listed banks recording increases in government securities investments. HF Group and Stanbic Holdings recorded the largest increases of 75.3% and 67.9% respectively. However, 2 of the 10 listed banks recorded decreases in government securities investments of 43.6% and 11.1% for KCB Group and NCBA Group respectively,
- The listed banks’ Net loans and advances to customers recorded a weighted average decline of 7.7% in FY’2024, a significant decline from the 9.5% growth recorded in FY’2023, an indication of decreased lending attributable to the elevated credit risk due to high borrowing costs witnessed during the period,
- Interest income recorded a weighted average growth of 21.1% in FY’2024, compared to 30.5% in FY’2023. Similarly, interest expenses recorded a market-weighted average growth of 43.6% in FY’2024 compared to a growth of 52.4% in FY’2023. Consequently, net interest income recorded a weighted average growth of 11.7% in FY’2024, albeit lower than the 20.6% growth recorded in FY’2023,
- Notably, non-funded income growth softened during the year, as evidenced by non-funded income weighted average growth of 12.2% in FY’2024 compared to a weighted average growth of 16.4% in FY’2023. The performance was largely attributable to the decrease in foreign exchange income recorded by the banks during the period as a result of decreased dollar demand in the country. Additionally, listed banks recorded a weighted average growth of 7.3% in total fees and commissions income in FY’2024 compared to a weighted growth of 18.4% in FY’2023, and,
- The listed banks recorded a 22.9% weighted average growth on return on average equity (RoaE), 1.7% points lower than the 21.2% growth registered in FY’2023. Additionally, the entire banking sector’s Return On Equity (ROE) stood at 0% as of December 2024, a 2.9% points decrease from the 24.9% recorded in September 2024. On a global level, the Kenyan banking sector continues to record high profitability compared to other economies in the world, as highlighted in the chart below:
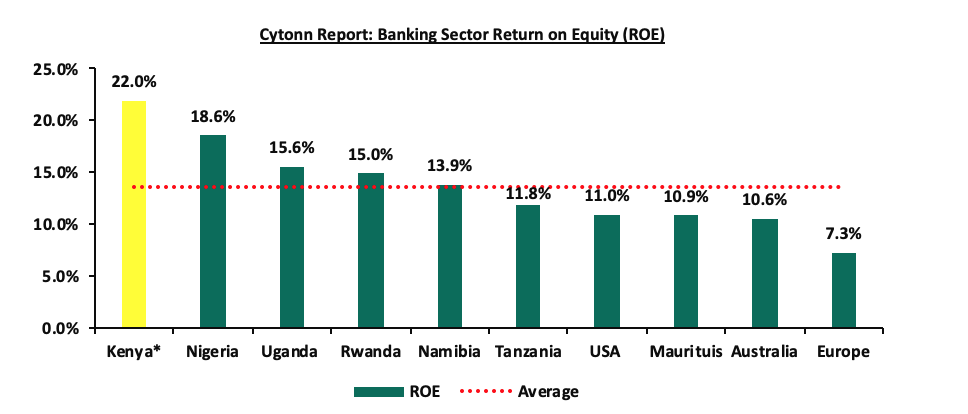
Source: Cytonn research
* Figure as of December 2024
Section III: The Focus Areas of the Banking Sector Players Going Forward:
The banking sector continues to remain resilient as evidenced by the increase in their profitability, with the Core Earnings Per Share (EPS) growing by 25.7%, as banks continued to implement their revenue diversification strategies. Notably, all the 10 listed banks recorded a growth in their Non-funded income in FY’2024. Additionally, we believe that the possibly improved business environment occasioned by ease in inflationary pressures, an ease in the monetary policy following a decrease in the CBR and a stronger Shilling, will see banks start to decrease their provisioning to cushion themselves from credit risk. To note, growth in general provisions for the listed banks recorded a reduced weighted growth of 3.2% in FY’2024, compared to a growth of 20.3% in FY’2023. Based on the current operating environment, we believe the future performance of the banking sector will be shaped by the following key factors:
- Growth in Interest income: Going forward, we expect interest income growth to remain a key driver in the banking industry, evidenced by the 21.1% growth recorded in FY’2024, albeit lower than the 30.5% growth recorded in FY’2023, partly on the back of high borrowing costs experienced during the year. However, the recent easing of monetary policy by the Central Bank of Kenya, which lowered the Central Bank Rate (CBR) by 75 basis points to 10.00% in April 2025, signals a gradual reduction in borrowing costs. This is likely to support an increase in credit uptake, expanding banks' loan books and consequently boosting interest income. Additionally, the continued use of banks' risk-based lending models will enable banks to effectively price their risk, further contributing to the growth of interest income.,
- Revenue Diversification: In FY’2024, non-funded income (NFI) recorded a 12.2% weighted average growth, slower than the 16.4% weighted growth in FY’2023, majorly attributable to a decline in foreign exchange income resulting from reduced demand for the USD following the appreciation and the relative stability of the currency. Notably, this deceleration occurred despite all the 10 listed Banks recording an increase in their non-funded income. As a result of the slower growth in non-funded income (NFI) the weighted average contribution of NFI to total operating income came in at 36.3% in FY’2024, 0.7% points lower than the 37.0% weighted average growth contribution recorded in FY’2023 and as such, there still exists an opportunity for the sector to further increase NFI contributions to revenue given the continuous adoption of digitization,
- Growth in Loans and Advances: While 1 of the listed banks, HF Group, experienced positive loan growth of 0.2%, 9 out of the 10 listed banks recorded negative growth in loans and advances to customers, majorly due to increased credit risk and the elevated borrowing costs. However, with the consistent ease in the Central Bank Rate (CBR) recently, borrowing costs are expected to decline. This reduction is anticipated to support credit growth by encouraging increased borrowing by the private sector and easing financial pressures on borrowers. To drive further loan growth, banks must leverage opportunities such as risk-based lending models, improved customer segmentation, and expanding access to credit in underserved sectors, and,
- Regional Expansion and Further Consolidation: Consolidation remains a key theme going forward with the current environment offering opportunities for larger banks with a sufficient capital base to expand and take advantage of the market's low valuations, as well as further consolidate out smaller and weaker banks. Notably, the majority of the bigger banks have continued to cushion over unsystematic risks specific to the local market by expanding their operations into other African nations. Banks such as KCB and Equity Group have been leveraging on expansion and consolidation, which has largely contributed to their increased asset base as well as earnings growth. Additionally, we expect the increased capital requirements imposed on banks to further accelerated consolidation, as only well-capitalized banks are able to meet these thresholds while pursuing expansion opportunities. As such, we expect to see a continued expansion trend aimed at revenue optimization.
Section IV: Brief Summary and Ranking of the Listed Banks:
As per our analysis of the banking sector from a franchise value and a future growth opportunity perspective, we carried out a comprehensive ranking of the listed banks. For the franchise value ranking, we included the earnings and growth metrics as well as the operating metrics shown in the table below in order to carry out a comprehensive review of the banks:
|
Cytonn Report: Listed Banks Earnings, Growth and Operating Metrics FY’2024 |
||||||||
|
Bank |
Loan to Deposit Ratio |
Cost to Income (With LLP) |
Return on Average Capital Employed |
Deposits/ Branch (bn) |
Gross NPL Ratio |
NPL Coverage |
Tangible Common Ratio |
Non Funded Income/Revenue |
|
Absa Bank |
84.2% |
52.3% |
27.0% |
4.3 |
12.6% |
66.0% |
16.6% |
25.8% |
|
HF Group |
81.9% |
89.5% |
4.3% |
2.2 |
25.3% |
70.3% |
22.0% |
36.1% |
|
Coop Bank |
73.8% |
57.9% |
19.7% |
2.4 |
17.0% |
63.9% |
19.0% |
36.1% |
|
KCB Group |
71.7% |
60.0% |
24.6% |
2.6 |
19.8% |
65.1% |
13.3% |
33.0% |
|
Stanbic Bank |
71.6% |
52.3% |
19.1% |
10.7 |
9.1% |
78.4% |
16.4% |
38.8% |
|
I&M Holdings |
69.6% |
61.2% |
16.9% |
3.9 |
11.5% |
62.3% |
15.2% |
26.7% |
|
DTBK |
63.8% |
72.8% |
11.3% |
2.8 |
12.6% |
39.9% |
13.9% |
31.5% |
|
NCBA Group |
60.2% |
60.0% |
21.2% |
4.2 |
11.5% |
59.2% |
15.5% |
45.0% |
|
Equity Bank |
58.5% |
68.7% |
22.1% |
3.5 |
13.6% |
63.7% |
12.2% |
43.9% |
|
SCBK |
51.3% |
44.3% |
30.1% |
12.9 |
7.4% |
81.8% |
17.5% |
34.4% |
|
Weighted Average FY'2024 |
66.3% |
58.3% |
22.9% |
5.3 |
13.2% |
66.8% |
15.3% |
36.3% |
|
Market cap weighted as at 17/04/2025 |
||||||||
The overall ranking was based on a weighted average ranking of Franchise value (accounting for 60.0%) and intrinsic value (accounting for 40.0%). The Intrinsic Valuation is computed through a combination of valuation techniques, with a weighting of 40.0% on Discounted Cash-flow Methods, 35.0% on Residual Income, and 25.0% on Relative Valuation, while the Franchise ranking is based on a bank’s operating metrics, meant to assess efficiency, asset quality, diversification, and profitability, among other metrics. The overall FY’2024 ranking is as shown in the table below:
|
Cytonn Report: Listed Banks FY’2024 Rankings |
|||||
|
Bank |
Franchise Value Rank |
Intrinsic Value Rank |
Weighted Rank Score |
FY'2023 Rank |
FY'2024 Rank |
|
Absa Bank |
2 |
3 |
2.4 |
1 |
1 |
|
KCB Group |
5 |
1 |
3.4 |
9 |
2 |
|
SCBK |
1 |
7 |
3.4 |
5 |
3 |
|
I&M Holdings |
6 |
2 |
4.4 |
5 |
4 |
|
Coop Bank |
4 |
6 |
4.8 |
2 |
5 |
|
Stanbic Bank |
3 |
10 |
5.8 |
3 |
6 |
|
Equity Bank |
8 |
5 |
6.8 |
4 |
7 |
|
NCBA Group |
6 |
8 |
6.8 |
8 |
7 |
|
DTBK |
10 |
4 |
7.6 |
7 |
9 |
|
HF Group |
9 |
9 |
9.0 |
10 |
10 |
Major Take-outs from the FY’2024 Ranking are:
- ABSA Bank retained to position 1 in FY’2024, similar to FY’2023, mainly supported by strong franchise value score, attributable to improvement in the bank’s management quality and earning quality, with the cost-to-income ratio with LLPs declining by 4.3% points to 52.3% in FY’2024, from 56.6% in FY’2023, and cost-to-income without LLPs declined by 2.0% points to 37.7% in FY’2024, from 39.7% in FY’2023. Notably, the bank’s Net Interest Margin increased by 1.0% points to 10.1% in FY’2024 from 9.1% in FY’2023,
- KCB Group climbed up 7 places to rank at position 2 in FY’2024, up from position 9 in FY’2023 supported by significant improvement in intrinsic value score. Its performance was driven by 10.7% points decline in cost-to-income ratio with LLPs to 60.0% in FY’2024, from 70.7% in FY’2023, while cost-to-income ratio without LLPs declined by 5.0% points to 45.4% in FY’2024, from 50.3% in FY’2023. Notably, the bank’s Net Interest Margin increased by 1.2% points to 7.8% in FY’2024 from 6.6% in FY’2023,
- Equity Group slid 3 places to rank at position 7 in FY’2024, down from position 4 in FY’2023, attributable a decline in franchise value score mainly on the back of 6.4% points increase Cost of income without LLPs to 58.2% in FY’2024 from the 51.9% recorded in FY’2023, coupled with the 0.5% points decline in the net interest margin to 7.0% in FY’2024, from 7.4% in FY’2023. The bank’s performance was however supported by 2.8% points decline in cost-to-income ratio with LLPs to 68.7% in FY’2024, from 71.4% in FY’2023.
For more information, see our Cytonn FY’2024 Listed Banking Sector Review full report.
Disclaimer: The views expressed in this publication are those of the writers where particulars are not warranted. This publication is meant for general information only and is not a warranty, representation, advice or solicitation of any nature. Readers are advised in all circumstances to seek the advice of a registered investment advisor.


