Following the release of the Q3’2025 results by Kenyan listed banks, the Cytonn Financial Services Research Team undertook an analysis on the financial performance of the listed banks and identified the key factors that shaped the performance of the sector. For the earnings notes of the various banks, click the links below:
- Equity Group Q3’2025 Earnings Note
- KCB Group Q3’2025 Earnings Note
- Standard Chartered Bank Kenya Q3’2025 Earnings Note
- ABSA Bank Kenya Q3’2025 Earnings Note
- NCBA Group Q3’2025 Earnings Note
- Co-operative Bank Q3’2025 Earnings Note
- Stanbic Holdings Q3’2025 Earnings Note
- I&M Group Holdings Q3’2025 Earnings Note
- Diamond Trust Bank Kenya Q3’2025 Earnings Note
- HF Group Q3’2025 Earnings Note
The core earnings per share (EPS) for the listed banks recorded a weighted growth of 7.6% in Q3’2025, compared to a weighted growth of 24.6% recorded in Q3’2024, an indication of deteriorated performance mainly on the back of a 3.3% decline in non-funded income in Q3’2025, compared to a growth of 5.4% in Q3’2024, despite an improvement in loan book expansion. The decline in non-funded income was majorly attributable to a decline in foreign exchange income due to reduced dollar demand coupled with lower transaction volumes which weighing down on fees and commissions income. Notably, the inflation rate in Q3’2025 averaged 4.4%, 0.3% points higher than the 4.1% average in Q3’2024, with the Kenyan Shilling remaining stable against the US Dollar, gaining slightly by 0.2 bps in Q3’2025, to remain relatively unchanged at the Kshs 129.2 recorded at the beginning of the quarter. The performance was however supported by a 13.4% growth in net interest income, higher than the 12.5% growth in Q3’2024. Similarly, credit risk decreased with the asset quality of listed banks improving slightly in Q3’2025, with the weighted average Gross Non-Performing Loan ratio (NPL) decreasing by 0.3% points to 13.2%, from 13.5% recorded in Q3’2024. The NPL performance remained 1.3% points above the ten-year average of 11.9%.
The report is themed “Earnings resilience tested as interest income softens” where we assess the key factors that influenced the performance of the banking sector in Q3’2025, the key trends, the challenges banks faced, and areas that will be crucial for growth and stability of the banking sector going forward. As such, we shall address the following:
- Key Themes that Shaped the Banking Sector Performance in Q3’2025,
- Summary of the Performance of the Listed Banking Sector in Q3’2025,
- The Focus Areas of the Banking Sector Players Going Forward, and,
- Brief Summary and Ranking of the Listed Banks based on the outcome of our analysis
Section I: Key Themes That Shaped the Banking Sector Performance in Q3’2025
In this section, we will highlight the main factors influencing the banking sector in Q3’2025. These include regulation, digitization, interest rates, regional expansion through mergers and acquisitions, and asset quality:
- Regulation:
- Risk-based Lending: Over the years, the government has deployed various policy tools to manage interest rates and improve private sector access to credit. Following the repeal of the Interest Rate Cap Law in 2019, the Central Bank of Kenya (CBK) directed banks to adopt risk-based lending models that price loans according to borrower risk profiles, improving fairness and transparency for MSMEs. Although the CBK introduced a revised pricing framework in August 2025 anchored on the Kenya Shilling Overnight Interbank Average (KESONIA), a benchmark derived from actual overnight interbank transactions meant to replace the Central Bank Rate (CBR) for shilling-denominated variable loans, most commercial banks have opted to continue using the CBR as their reference rate under the new model. Institutions such as KCB, Equity, Absa, NCBA, and DTB have issued public notices indicating that, from December 1, 2025, they are applying CBR plus a customer-specific risk premium, despite having previously rejected CBR as a benchmark and championed the creation of KESONIA. Banks cite ongoing systems testing and the need for operational readiness as the reason for delaying adoption of KESONIA, whose higher volatility would also require more frequent lending-rate adjustments and additional regulatory approvals. Only Co-operative Bank and Kingdom Bank have so far committed to using the interbank-based rate. While CBK continues publishing KESONIA, currently higher than the 9.0% CBR, to prepare the market for eventual transition, banks are expected to migrate all pre-December 1 loan facilities to the new risk-based model by February 28, 2026. Overall, although the revised framework is intended to strengthen monetary policy transmission, align Kenya with global benchmarks such as SOFR and SONIA, and enhance transparency through mandatory disclosure of lending rates, premiums, and fees, its impact will vary: borrowers with strong credit profiles may benefit from more competitive pricing, while higher-risk customers could face steeper charges, and lending rates are likely to become more responsive, but also more volatile, once full adoption of KESONIA eventually takes effect.
- Higher capital requirements: Following the enactment of the Business Laws (Amendment) Act, 2024, the Central Bank of Kenya (CBK) increased the minimum core capital requirement for commercial banks to Kshs 10.0 bn from the previous Kshs 1.0 bn, which had been in effect since 2012. The new framework requires lenders to comply gradually, Kshs 3.0 bn by end-2025, Kshs 5.0 bn by 2026, Kshs 6.0 bn by 2027, Kshs 8.0 bn by 2028, and full compliance at Kshs 10.0 bn by 2029. As of September, 2025, 10 banks were below the Kshs 3.0 bn threshold and needed a combined Kshs 14.4 bn to meet the December 2025 deadline. The table below shows the core capital requirement gap of the ten banks as of September 2025;
|
Cytonn Report: Selected Banks Core Capital Requirement Gap |
|||
|
No |
Bank |
Core Capital (Kshs Bn) |
Gap (Kshs Bn) |
|
1 |
Acess Bank Kenya Plc |
(0.8) |
3.8 |
|
2 |
Consolidated Bank of Kenya |
(0.7) |
3.7 |
|
3 |
Credit Bank Plc |
1.2 |
1.8 |
|
4 |
UBA Kenya Bank |
1.5 |
1.5 |
|
5 |
Development Bank of Kenya |
2.1 |
0.9 |
|
6 |
Middle East Bank Kenya |
2.1 |
0.9 |
|
7 |
Premier Bank Limited |
2.2 |
0.8 |
|
8 |
M-Oriental |
2.5 |
0.5 |
|
9 |
ABC Bank Kenya |
2.6 |
0.4 |
|
10 |
CIB International Bank |
2.8 |
0.2 |
|
Total |
|
14.4 |
|
source: Company Financials
Several banks have since made progress: Paramount Bank raised Kshs 332.0 mn through a rights issue, pushing its core capital to Kshs 3.1 bn and achieving compliance even as it remains linked to a potential takeover by Nigeria’s Zenith Bank. ABC Bank has also launched a rights issue targeting at least Kshs 0.4 bn to bridge its shortfall from the June core capital level of Kshs 2.6 bn. Credit Bank is seeking Kshs 4.5 bn through a private placement and has already secured commitments of Kshs 2.0 bn from key shareholders, ShoreCap III LP and Sansora Group, sufficient to meet the December Kshs 3.0 bn requirement, with an additional convertible note planned for supplementary capital. Other lenders are pursuing similar measures; M-Oriental Bank is seeking to waive pre-emptive rights to bring in new investors beyond its current Kshs 2.5 bn core, while foreign-owned banks including Access Bank Kenya, UBA Kenya Bank, CIB International Bank, which recently received a Kshs 1.0 bn capital injection from its Egyptian parent, and Ecobank Kenya are relying on support from their parent institutions. Consolidated Bank remains the most distressed, with a negative core capital of approximately Kshs 701.0–731.0 mn, requiring over Kshs 3.7 bn to meet the 2025 minimum amid ongoing plans for a rights issue and long-delayed government support. A recent CBK stress test warned that under a severe scenario where the non-performing loans (NPL) ratio rises to 27.4%, up to 12 banks, mainly Tier III, could be undercapitalized, requiring a combined Kshs 19.8 bn by December 2025, highlighting limited capacity to rely solely on retained earnings for recapitalization. To address these gaps, the regulator outlined options including downgrading chronically non-compliant lenders to microfinance status, extending the 2025 deadline, or adopting tiered capital requirements as used in other markets. Earlier in the year, CBK requested 24 banks whose capital remains below the ultimate Kshs 10.0 bn target to submit capital-raising plans, with 22 already presenting strategies that include capital injections, rights issues, strategic partnerships, mergers, and organic growth. Although the Kenya Bankers Association (KBA) does not expect significant merger and acquisition activity in 2025, arguing that most banks can meet the Kshs 3.0 bn threshold individually, it anticipates heightened consolidation pressure from 2026 onward as capital requirements rise to Kshs 5.0 bn and beyond. CBK is currently reviewing the submitted capital plans and monitoring ongoing efforts as banks race to achieve compliance ahead of the phased deadlines.
- Lifting of moratorium on licensing of new commercial banks: In a significant policy shift, the Central Bank of Kenya (CBK) lifted the moratorium on licensing new commercial banks on July 1, 2025, ending a restriction that had been in place since November 2015. The moratorium had been introduced to address governance, risk management, and operational weaknesses in the sector, providing space for reforms. Over the past decade, the industry has undergone substantial strengthening, with improvements in legal and regulatory frameworks, a wave of mergers and acquisitions, and the entry of new strategic investors. With the moratorium now lifted, early indications point to renewed investor interest, particularly from regional financial groups and non-bank financial institutions seeking to upgrade to full banking licenses. While no large-scale greenfield entries have yet materialized, the policy shift is expected to stimulate competition, product innovation, and capital inflows over the coming year, especially as potential entrants assess compliance with the revised minimum core capital requirement of Kshs 10.0 bn. In the near term, the move is likely to deepen financial sector resilience and broaden consumer choice, although the pace of new licensing is expected to remain measured as CBK maintains a cautious, risk-based approval approach.
- Digitization: In Q3’2025, digitization continued to be a transformative force in the banking sector, significantly improving how banks operate and deliver services. There has been a significant increase in the adoption of mobile and online banking platforms as customers now prefer to perform banking transactions from the comfort of their homes, leading to a decline in the use of physical branches. For instance, most of the listed banks disclosed that the majority of transactions were conducted through alternative channels, with Equity Group and KCB Group reporting that 0% and 99.0% of their transactions, respectively, were done through non-branch channels as of end of Q3’2025,
- Interest Rates: Interest rates were on a downward trajectory during the period under review. Notably, the yields on Kenyan government securities declined during the period under review, with the yield on the 91-day paper averaging 8.0% during the period, 7.8% points lower than the average of 15.9% in Q3’2024. The significant declines in rates in Q3’2025 led to a decrease in the listed bank’s interest income growth, softening to a weighted average drop of 2.6% in Q3’2025, from a weighted average growth of 25.5% in Q3’2024. However, the lower interest rate environment led to a substantial reduction in interest expense which declined by a weighted average of 21.7% in Q3’2025, compared to the 52.9% growth in Q3’2024 this decline in funding cost helped support overall profitability contributing to a 13.4% growth in net interest income in Q3’2025,
- Regional Expansion through Mergers and Acquisitions: Kenyan banks are increasingly expanding their regional footprint, with subsidiaries contributing significantly to overall profitability. For instance, Equity Group reported that regional subsidiaries contributed 45.0% of the Group’s Profit Before Tax (PBT) in Q3’2025, down from 53.0% in the same period last year, demonstrating the continued importance of these subsidiaries to the Group’s earnings. Additionally, KCB Group’s subsidiaries contributed 32.4% of the Group’s Profit After Tax (PAT) in Q3’2025. In terms of consolidation activity, 2024 saw one confirmed acquisition agreement between Access Bank Plc and KCB Group for the acquisition of National Bank of Kenya. More recently, there have been reports of ongoing talks between Standard Bank Group’s Kenyan subsidiary, Stanbic Holdings Plc, and NCBA Group Plc regarding a potential acquisition. If concluded, the transaction would create Kenya’s third-largest bank by assets, underscoring the likelihood of further consolidation in the sector following higher minimum capital requirements and renewed regulatory support for stronger, well-capitalized institutions.
- On April 14, 2025, the Central Bank of Kenya announced the acquisition of 100.0% shareholding of National Bank of Kenya Limited (NBK) by Access Bank Plc from KCB Group Plc, following CBK’s approval on April 4, 2025 under Section 13 (4) of the Banking Act, and approval by the Cabinet Secretary for the National Treasury and Economic Planning on April 10, 2025, pursuant to Section 9 of the Banking Act. As part of the transaction, CBK, on April 4, 2025, further approved the transfer of certain assets and liabilities of National Bank of Kenya Limited to KCB Bank Kenya Limited pursuant to Section 9 of the Banking Act. The acquisition and completion of the transaction was finalised on 30th May 2025 in accordance with the terms of the Agreement between the parties.
- On March 20, 2024 Access Bank Plc announced that it had entered into a share purchase agreement with KCB Group Plc that would allow Access Bank Plc to acquire 100% shareholding in National Bank of Kenya Limited (NBK) from KCB. Access Bank Plc is a wholly owned subsidiary of Access Holdings Plc listed on the Nigerian Exchange as Access Corporation. Notably, KCB Bank had acquired the National Bank of Kenya back in 2019 in a rescue deal that was supervised by the Central Bank of Kenya. The announcement followed the release of the Q1’2024 results for the KCB group, which revealed a decline in earnings with its Core earnings per share (EPS) declining by 8.3% to Kshs 11.7, from Kshs 12.7 in FY’2022. The transaction represents an important milestone for Access Bank as it moves closer to the achievement of its five-year strategic plan through increased scale in the Kenyan market. In the signed deal, Access Bank will pay multiples of 1.3x the book value of NBK, which stood at Kshs 10.6 bn as of end December 2023. This values the deal at about Kshs 13.3 bn with the actual figure to be announced when the transaction is completed.
- In April 2024, Sidian Bank disclosed that the founders of the bank and other nine individual shareholders relinquished a combined stake of 728,525 shares representing 16.6% stake to Pioneer General Insurance Limited, pioneer Life Investments Limited, Wizro Enterprises Limited, Afrah Limited, and Telesec Africa Limited. The transaction amounted to Kshs 0.8 bn translating to a price to book multiple (p/bv) of 1.0x. This follows an earlier transaction executed on October 2023 when Pioneer General Insurance, Wizpro Enterprise and Afram Limited bought 38.9% stake in the lender following a shareholders’ resolution passed on 20th September 2023 approving the sale.
The following are Mergers and Acquisitions that were completed in 2023:
- On January 30, 2023, the Central Bank of Kenya (CBK) announcedthat Commercial International Bank (Egypt) S.A.E (CIB) had completed the acquisition of an additional 49.0% shareholding of Mayfair CIB Bank Limited (MBL) at Kshs 5.0 bn following the earlier acquisition of 51.0% stake in MBL announced in April 2020. Consequently, MBL is now a fully owned subsidiary of CIB,
- On January 30, 2023, Equity Group Holdings , through Equity Bank Kenya Limited (EBKL) announced that it had completed the acquisition of certain assets and liabilities of the local Bank, Spire Bank Limited after obtaining all the required regulatory approvals. The completion of the acquisition followed the Assets and Liabilities Purchase Agreement, which was announced in September 2022, as highlighted in our Cytonn Weekly #37/2022. As such, Equity Bank Kenya Limited took over Spire Bank’s 12 branches as well as all existing depositors in Spire Bank, other than remaining deposits from its largest shareholder, Mwalimu Sacco. For more information, please see our Cytonn Monthly-January 2023,
- On March 17, 2023, the Central Bank of Kenya (CBK) announced that Premier Bank Limited Somalia (PBLS) had completed the acquisition of 62.5% shareholding of First Community Bank Limited (FCB) effective 27 March 2023. This came after receiving regulatory approvals from the CBK and the Cabinet Secretary for the National Treasury. FCB, which has been in operation since June 2008, is classified as a tier 3 bank in Kenya with 18 branches and a market share of 0.3% as at December 2022. The acquisition by Premier Bank Limited Somalia (PBLS), came at a time when FCB has been struggling to meet regulatory Capital adequacy requirements. For more information, please see our Cytonn Weekly #11/2023,
- On May 22, 2023, the Central Bank of Kenya (CBK) announced that Shorecap III, LP, a Private Equity fund governed by the laws of Mauritius, had acquired a 20.0% stake in Credit Bank Plc. The fund is managed by Equator Capital Partners LLC, and the acquisition took effect from June 15, 2023. While the CBK initially did not reveal the value of the deal, it has since been disclosed that Shorecap III, LP paid Ksh 0.7 billion for the 20.0% stake, valuing the bank at Ksh 3.64 bn. Shorecap III, LP assumed control of 7,289,928 ordinary shares, which make up 20.0% of the Bank’s ordinary shares. The funds helped lift Credit Bank from a regulatory capital breach. For additional details, refer to our Cytonn Weekly #21/2023,
- On December 1, 2023 Equity Group Holdings Plc (EGH) announced that it had successfully completed the acquisition of its Rwandan Subsidiary, Compagnie Générale de Banque (Cogebanque) Plc, marking a significant milestone in its regional expansion strategy. Equity Group now holds 198,250 shares representing 99.1% of the issued share capital of COGEBANQUE, following receipt of all regulatory and corporate approvals, officially making COGEBANQUE its subsidiary. EGH made the announcement it had entered into a binding agreement with the Government of Rwanda, Rwanda Social Security Board, and other investors of Compagnie Generale De Banque (Cogebanque) Plc Limited to acquire a 91.9% stake in the Rwanda based lender on June 14, 2023. Notably, EGH signed a share purchase agreement with the Sellers on July 28, 2023, committing to buy 183,854 shares at a rate of 297,406 Rwandan Francs per share upon completion on December 1, 2023, giving EGH ownership of 99.1% of the issued share capital. Concurrently, EGH proposed to purchase all outstanding shares from the other shareholders of Cogebanque, aiming to own up to 100% of Cogebanque’s issued shares,
Below is a summary of the deals in the last 10 years that have either happened, been announced or expected to be concluded:
|
Cytonn Report: Banking Sector Deals and Acquisitions |
||||||
|
Acquirer |
Bank Acquired |
Book Value at Acquisition (Kshs bn) |
Transaction Stake |
Transaction Value (Kshs bn) |
P/Bv Multiple |
Date |
|
Access Bank PLC (Nigeria) |
National Bank of Kenya |
10.6 |
100.00% |
13.3 |
1.3x |
Apr-25 |
|
Pioneer General Insurance and four other companies |
Sidian Bank |
5.0 |
16.57% |
0.8 |
1.0x |
Apr-24 |
|
Pioneer General Insurance and two other companies |
Sidian Bank |
5.0 |
38.91% |
2.0 |
1.0x |
Oct-23 |
|
Equity Group |
Cogebanque PLC ltd |
5.7 |
91.13% |
6.7 |
1.3x |
Dec-23 |
|
Shorecap III |
Credit Bank Plc |
3.6 |
20.00% |
0.7 |
1.0x |
Jun-23 |
|
Premier Bank Limited |
First Community Bank |
2.8 |
62.50% |
Undisclosed |
N/A |
Mar-23 |
|
KCB Group PLC |
Trust Merchant Bank (TMB) |
12.4 |
85.00% |
15.7 |
1.5x |
Dec-22 |
|
Equity Group |
Spire Bank |
Unknown |
Undisclosed |
Undisclosed |
N/A |
Sep-22* |
|
Access Bank PLC (Nigeria)* |
Sidian Bank |
4.9 |
83.40% |
4.3 |
1.1x |
June-22* |
|
KCB Group |
Banque Populaire du Rwanda |
5.3 |
100.00% |
5.6 |
1.1x |
Aug-21 |
|
I&M Holdings PLC |
Orient Bank Limited Uganda |
3.3 |
90.00% |
3.6 |
1.1x |
Apr-21 |
|
KCB Group** |
ABC Tanzania |
Unknown |
100.00% |
0.8 |
0.4x |
Nov-20* |
|
Co-operative Bank |
Jamii Bora Bank |
3.4 |
90.00% |
1 |
0.3x |
Aug-20 |
|
Commercial International Bank |
Mayfair Bank Limited |
1.0 |
51.00% |
Undisclosed |
N/A |
May-20* |
|
Access Bank PLC (Nigeria) |
Transnational Bank PLC. |
1.9 |
100.00% |
1.4 |
0.7x |
Feb-20* |
|
Equity Group ** |
Banque Commerciale Du Congo |
8.9 |
66.50% |
10.3 |
1.2x |
Nov-19* |
|
KCB Group |
National Bank of Kenya |
7.0 |
100.00% |
6.6 |
0.9x |
Sep-19 |
|
CBA Group |
NIC Group |
33.5 |
53%.47% |
23 |
0.7x |
Sep-19 |
|
Oiko Credit** |
Credit Bank |
3.0 |
22.80% |
1 |
1.5x |
Aug-19 |
|
CBA Group** |
Jamii Bora Bank |
3.4 |
100.00% |
1.4 |
0.4x |
Jan-19 |
|
AfricInvest Azure |
Prime Bank |
21.2 |
24.20% |
5.1 |
1.0x |
Jan-18 |
|
KCB Group |
Imperial Bank |
Unknown |
Undisclosed |
Undisclosed |
N/A |
Dec-18 |
|
SBM Bank Kenya |
Chase Bank Ltd |
Unknown |
75.00% |
Undisclosed |
N/A |
Aug-18 |
|
DTBK |
Habib Bank Kenya |
2.4 |
100.00% |
1.8 |
0.8x |
Mar-17 |
|
SBM Holdings |
Fidelity Commercial Bank |
1.8 |
100.00% |
2.8 |
1.6x |
Nov-16 |
|
M Bank |
Oriental Commercial Bank |
1.8 |
51.00% |
1.3 |
1.4x |
Jun-16 |
|
I&M Holdings |
Giro Commercial Bank |
3.0 |
100.00% |
5 |
1.7x |
Jun-16 |
|
Mwalimu SACCO |
Equatorial Commercial Bank |
1.2 |
75.00% |
2.6 |
2.3x |
Mar-15 |
|
Centum |
K-Rep Bank |
2.1 |
66.00% |
2.5 |
1.8x |
Jul-14 |
|
GT Bank |
Fina Bank Group |
3.9 |
70.00% |
8.6 |
3.2x |
Nov-13 |
|
Average |
|
|
73.3% |
|
1.3x |
|
|
Average: 2013 to 2018 |
|
|
73.5% |
|
1.7x |
|
|
Average: 2019 to 2024 |
|
|
73.2% |
|
1.0x |
|
|
* Announcement Date ** Deals that were dropped |
||||||
In Q3’2025, the average acquisition valuations for banks have remained unchanged at 1.3x, similar to what was recorded in a similar period in 2024. As such, the valuations still remain low compared to historical prices paid, as highlighted in the chart below;
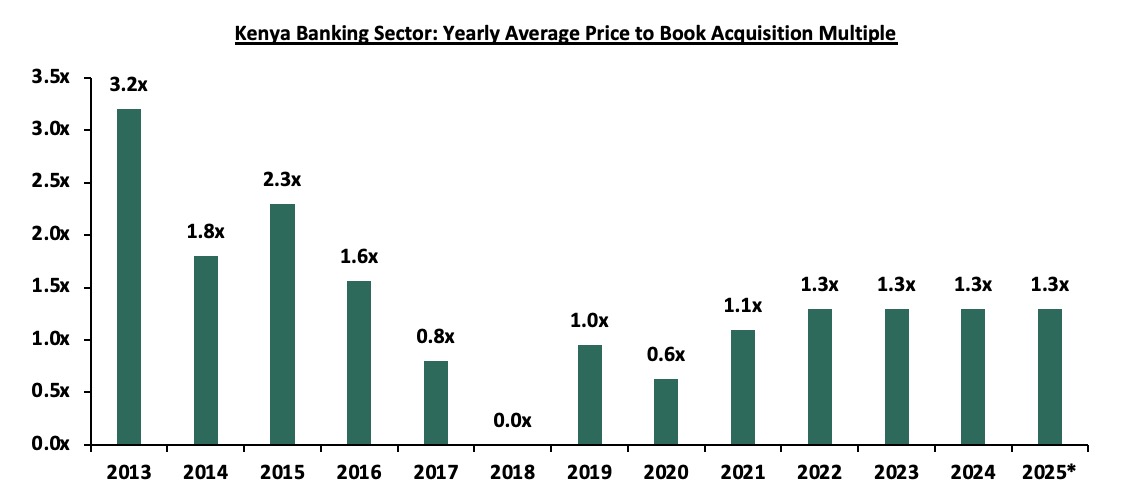
2025* data as of end of Q3’2025
As at the end of Q3’2025, the number of commercial banks in Kenya stood at 38, same as in Q3’2024, but lower than the 43 licensed banks in FY’2015. The ratio of the number of banks per 10 million population in Kenya now stands at 6.6x, which is a reduction from 9.0x in FY’2015, demonstrating continued consolidation in the banking sector. However, despite the ratio improving, Kenya still remains overbanked as the number of banks remains relatively high compared to the African major economies. To bring the ratio to 5.6x, we ought to reduce the number of banks from the current 38 banks to about 30 banks. This is partly expected to be supported by the enactment of The Business Laws (Amendment) Act 2024 that mandated a significant increase in the minimum core capital for banks to Kshs 10.0 bn from the previous Kshs 1.0 bn that had been in effect since 2012. To facilitate compliance, lenders below this threshold were directed to incrementally grow the figure over a 5-year period, required to close 2025 with a minimum core capital of Kshs 3.0 bn, rising to Kshs 5.0 bn by the end of 2026, and full compliance at Kshs 10.0 bn by the end of 2029. The new capital requirement is likely to trigger further mergers and acquisitions (M&As), especially for smaller lenders that may struggle to meet the threshold, potentially reducing the number of banks even further. However, the effect could be muted by the lifting of the moratorium which ended on 1st July 2025. The chart below shows the commercial bank ratio per 10 million people across select African nations in comparison to Kenya;
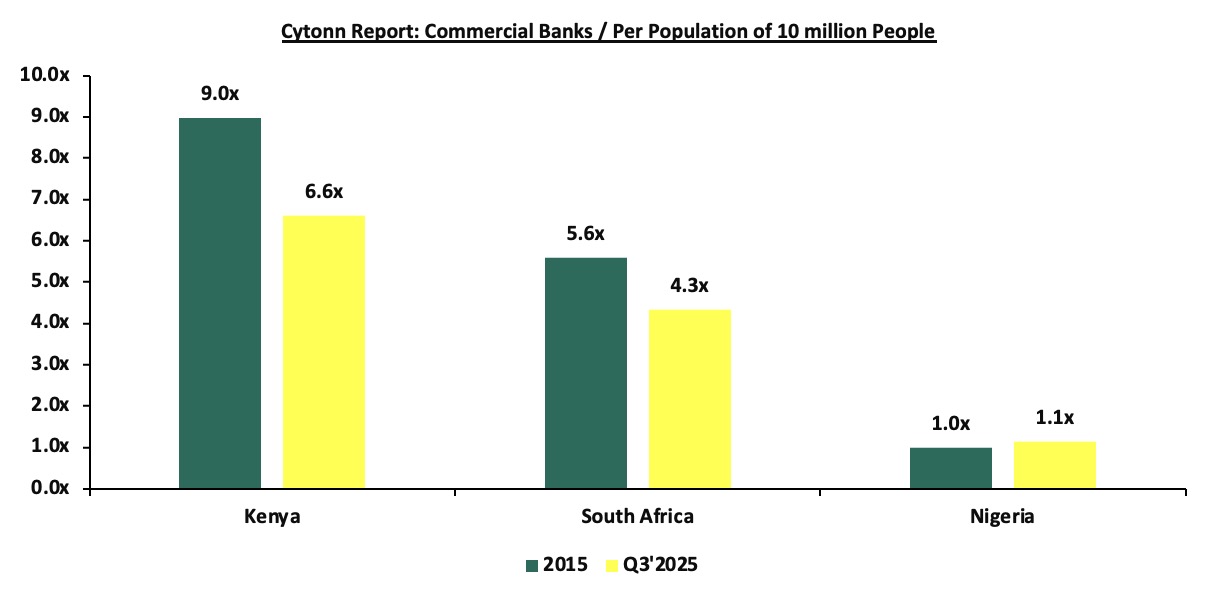
Source: World Bank, Central Bank of Kenya, South Africa Reserve Bank, Central Bank of Nigeria
Additionally, on April 16, 2025, the Central Bank of Kenya (CBK), announced that with effect from July 1, 2025, it will lift the moratorium on licensing of new commercial banks that had been in place since November 2015. The moratorium was introduced in response to governance, risk management, and operational issues within the banking sector, aiming to create room for reforms. Since then, Kenya’s banking sector has seen notable progress, including stronger legal and regulatory frameworks, increased mergers and acquisitions, and the entry of new local and international strategic investors. With the moratorium now lifted, new entrants into Kenya’s banking sector must prove their ability to meet the revised minimum core capital requirement of Kshs 10.0 bn. This move opens the door for investors to apply for greenfield licenses, unlike the previous arrangement where entry was heavily reliant on mergers and acquisitions. Over the past decade, the moratorium contributed to a reduction in the number of banks in Kenya, to 38 currently from 43 in 2015.
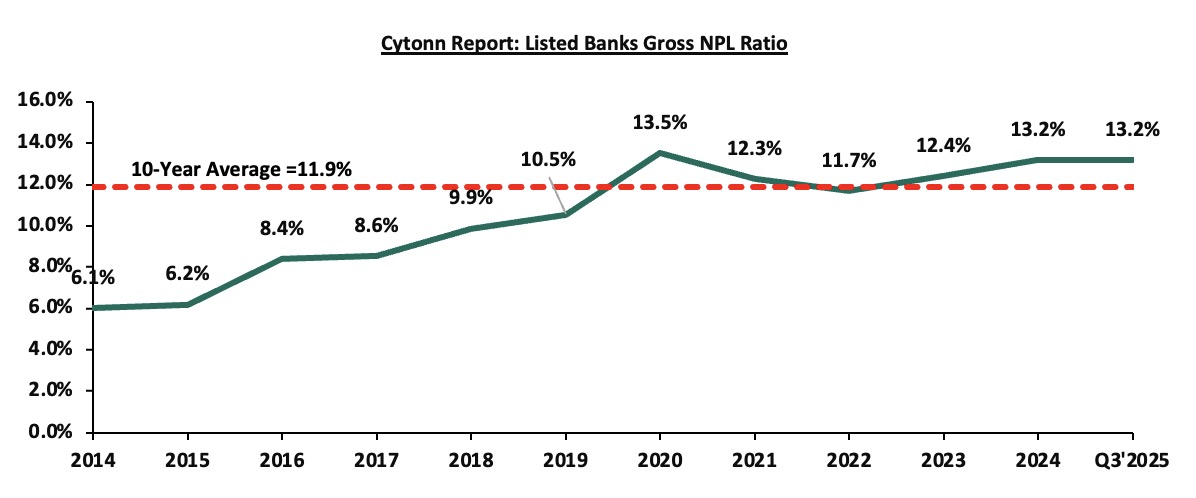
- Asset Quality: Asset quality for listed banks improved in Q3’2025, with the weighted average Gross Non-Performing Loan ratio (NPL) decreasing by 0.3% points to 13.2%, from 13.5% recorded in Q3’2024. The performance remained 1.3 points above the ten-year average of 11.9%. Notably, 8 out of the 10 listed banks recorded a decrease in their NPL ratios, signalling an improvement in asset quality even as credit risk remains elevated, albeit showing signs of moderation following recent monetary policy easing and improving lending conditions. Similarly, most banks experienced a decline in gross non-performing loans coupled with growth in gross loans. As a result, the overall gross non-performing loans (NPL) ratio in the banking industry decreased by 1.3 percentage points, falling to 16.9% in September 2025 from 17.6% in June 2025. Additionally, Stanbic’s NPL ratio declined the most by 2.1% points to 8.4%, from 10.4% in Q3’2024, while Standard Chartered bank’s NPL ratio decreased by 1.6% points to 5.9%, from 7.5% in Q3’2024. Stanbic’s asset quality improved due to an 8.3% decrease in Gross Non-Performing Loans to Kshs 22.8 bn in Q3’2025 from Kshs 24.8 bn in Q3’2024, relative to the 17.5% increase in gross loans to Kshs 279.4 bn from Kshs 237.7 bn in Q3’2024. Similarly, Standard Chartered bank’s asset quality improved due to a 24.8% decrease in Gross Non-Performing Loans to Kshs 9.1 bn in Q3’2025 from Kshs 12.1 bn in Q3’2024, which outpaced the 4.6% decrease in gross loans to Kshs 154.2 bn from Kshs 161.6 bn in Q3’2024. The chart below highlights the asset quality trend for the listed banks:
However, the improvement in listed banks' asset quality was weighed down by a deterioration in Co-operative Bank’s asset quality, with the Gross NPL ratio increasing by 0.8% points to 17.3% in Q3’2025 from 16.5% in Q3’2024. This was attributable to the 12.7% increase in gross non-performing loans to Kshs 78.9 bn from Kshs 70.0 bn in Q3’2024, which outpaced the 7.8% increase in gross loans to Kshs 456.8 bn from Kshs 423.7 bn in Q3’2024. Absa bank’s asset quality deteriorated with the Gross NPL ratio increasing by 0.5% points to 13.0% in Q3’2025 from 12.6% in Q3’2024. This was attributable to a 3.6% increase in Gross non-performing loans to Kshs 44.2 bn, from Kshs 42.7 bn in Q3’2024, relative to the 0.01% increase in gross loans to Kshs 339.4 bn, from Kshs 339.3 bn recorded in Q3’2024. A total of eight out of the ten listed Kenyan banks recorded an improvement in asset quality, supported by enhanced credit risk management and early signs of economic recovery as the recent Central Bank Rate (CBR) cuts begin to filter through the economy, following the credit challenges experienced in 2024, despite an overall increase in lending during the period. In a bid to curb inflation and support the Shilling the Monetary Policy Committee (MPC) had adopted a tight monetary policy stance, raising the Central Bank Rate (CBR) to 13.00% in February 2024 and maintaining it at that rate for its two subsequent sittings up to July 2024. As a result of the high interest rates, the private sector credit growth was severely constrained recording contractions of 1.1% and 1.4% in the months of November and December 2024 respectively. The chart below shows the private sector credit growth:
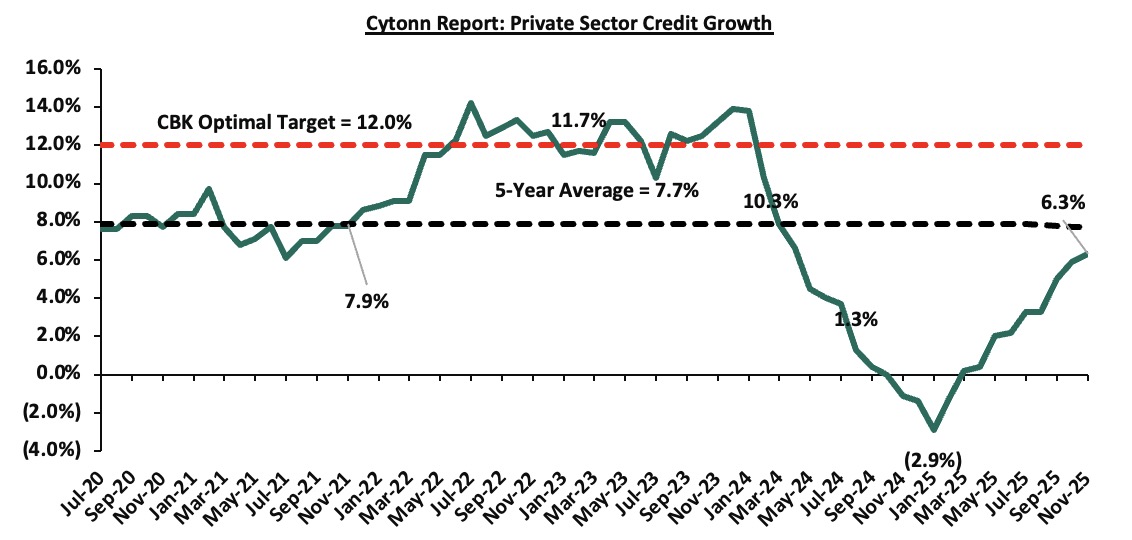
However, the Central Bank of Kenya has lowered the Central Bank Rate (CBR) by a cumulative 400 basis points, from 13.0% in July 2024 to 9.0% in December 2025, signalling a gradual easing of monetary policy following the successful stabilization of the currency and anchoring of inflation. This reduction in CBR is expected to continue to support credit growth and ease financial pressures on borrowers. Notably, growth in private sector credit grew by 6.3% in November 2025 from 5.9% in October 2025 and a contraction of 2.9% in January 2025, reflecting improved demand for credit in line with the declining lending interest rates. Going forward, we expect credit risk to decline gradually but remain at relatively elevated levels compared to previous years, owing to the improving business environment and a stronger and stable Shilling.
The table below highlights the asset quality for the listed banking sector:
|
Cytonn Report: Listed Banks Asset Quality |
||||||
|
Q3'2025 NPL Ratio* |
Q3'2024 NPL Ratio** |
% point change in NPL Ratio |
Q3'2025 NPL Coverage* |
Q3'2024 NPL Coverage** |
% point change in NPL Coverage |
|
|
Cooperative Bank |
17.3% |
16.5% |
0.8% |
63.7% |
60.5% |
3.2% |
|
Absa Bank Kenya |
13.0% |
12.6% |
0.5% |
67.1% |
65.3% |
1.8% |
|
NCBA Bank |
12.1% |
12.5% |
(0.4%) |
68.9% |
59.7% |
9.2% |
|
Equity Group |
13.6% |
14.4% |
(0.8%) |
71.1% |
56.8% |
14.4% |
|
HF Group |
23.3% |
24.1% |
(0.8%) |
74.3% |
74.4% |
(0.2%) |
|
KCB Group |
17.2% |
18.1% |
(0.9%) |
67.9% |
63.8% |
4.1% |
|
Diamond Trust Bank |
12.4% |
13.5% |
(1.0%) |
52.1% |
39.1% |
13.0% |
|
I&M Group |
10.2% |
11.8% |
(1.6%) |
69.5% |
61.3% |
8.2% |
|
Standard Chartered Bank |
5.9% |
7.5% |
(1.6%) |
85.1% |
85.3% |
(0.1%) |
|
Stanbic Holdings |
8.4% |
10.4% |
(2.1%) |
83.2% |
76.5% |
6.7% |
|
Mkt Weighted Average* |
13.2% |
13.5% |
(0.4%) |
70.6% |
64.5% |
6.2% |
|
*Market cap weighted as at 11/12/2025 |
||||||
|
**Market cap weighted as at 11/12/2024 |
||||||
Key take-outs from the table include;
- Asset quality for the listed banks improved in Q3’2025, with market weighted average NPL decreasing by 0.4% points to 13.2% from a 13.5% in Q3’2024. The improvement in the asset quality was mainly driven by an Improvement in Stanbic bank, Standard Chartered, I&M Group, DTB-K, KCB group, Equity group, HF group and NCBA bank’s asset quality with their NPL ratio decreasing by 2.1%, 1.6%, 1.6%, 1.0%, 0.9%, 0.8%, 0.8% and 0.4% points respectively,
- Co-operative bank and Absa group had the highest NPL ratio jumps by 0.8% and 0.5% points respectively to 17.3% and 13.0%, from 16.5% and 12.6% respectively in Q3’2024. Co-operative bank’s asset quality worsened due to a 12.7% rise in Gross Non-Performing Loans to Kshs 78.9 bn in Q3’2025 from Kshs 70.0 bn in Q3’2024, relative to the the 7.8% increase in gross loans to Kshs 456.8 bn from Kshs 423.7 bn in Q3’2024. Similarly, Absa bank’s asset quality worsened due to a 3.6% increase in Gross non-performing loans to Kshs 44.2 bn, from Kshs 42.7 bn in Q3’2024, relative to the 0.01% increase in gross loans to Kshs 339.4 bn, from Kshs 339.3 bn recorded in Q3’2024, and,
- Market weighted average NPL Coverage for the listed banks increased by 6.2% points to 70.6% in Q3’2025, from 64.5% recorded in Q3’2024, majorly on the back of increased NPL coverage recorded by Equity Group, Diamond Trust Bank Kenya, NCBA Bank, I&M Group, Stanbic Bank, KCB Group, Co-operative Bank and Absa Group by 14.4%, 13.0%, 9.2%, 8.2%, 6.7%, 4.1%, 3.2% and 1.8% points respectively in Q3’2025. However, the NPL coverage ratio of HF Group and Standard Chartered Bank Kenya decreased by 0.2% and 0.1% points respectively in Q3’2025.
Section II: Summary of the Performance of the Listed Banking Sector in Q3’2025:
The table below highlights the performance of the banking sector, showing the performance using several metrics, and the key take-outs of the performance;
|
Cytonn Report: Kenyan Listed Banks Performance Q3’2025 |
|||||||||||||||
|
Bank |
Core EPS Growth |
Interest Income Growth |
Interest Expense Growth |
Net Interest Income Growth |
Net Interest Margin |
Non-Funded Income Growth |
NFI to Total Operating Income |
Growth in Total Fees & Commissions |
Deposit Growth |
Growth in Government Securities |
Loan to Deposit Ratio |
Loan Growth |
Return on Average Equity |
COF |
YIEA |
|
Equity Group |
32.7% |
2.9% |
(20.7%) |
16.1% |
7.9% |
2.5% |
40.1% |
7.6% |
2.2% |
19.9% |
63.9% |
7.5% |
24.5% |
3.7% |
11.3% |
|
I&M Group |
24.2% |
0.6% |
(23.1%) |
21.1% |
8.3% |
17.9% |
26.0% |
15.7% |
10.2% |
65.2% |
66.2% |
7.3% |
19.2% |
5.3% |
13.1% |
|
Absa Bank Kenya |
14.7% |
(9.6%) |
(21.9%) |
(4.6%) |
9.6% |
11.2% |
29.2% |
16.3% |
9.2% |
71.1% |
80.6% |
(0.6%) |
26.8% |
3.8% |
12.9% |
|
Diamond Trust Bank |
12.3% |
0.9% |
(14.6%) |
17.9% |
6.2% |
(5.8%) |
26.7% |
10.7% |
15.5% |
22.9% |
58.1% |
7.8% |
11.2% |
5.5% |
11.7% |
|
Co-operative Bank |
12.3% |
10.0% |
(9.0%) |
22.8% |
8.7% |
(0.8%) |
32.8% |
1.6% |
6.7% |
20.7% |
74.1% |
6.6% |
18.8% |
5.4% |
13.4% |
|
NCBA Group |
8.5% |
(11.8%) |
(42.3%) |
27.4% |
7.3% |
(1.9%) |
40.0% |
2.5% |
(5.3%) |
3.0% |
60.0% |
(3.5%) |
21.0% |
5.3% |
12.1% |
|
KCB Group |
0.7% |
1.1% |
(17.6%) |
12.4% |
8.4% |
(10.1%) |
30.2% |
(1.5%) |
(0.8%) |
6.1% |
74.7% |
8.2% |
22.7% |
4.0% |
12.2% |
|
Stanbic Group |
(7.7%) |
(17.2%) |
(41.4%) |
8.0% |
6.3% |
(24.5%) |
27.6% |
1.1% |
4.9% |
32.8% |
73.6% |
15.7% |
18.5% |
4.5% |
11.1% |
|
Standard Chartered Bank |
(38.2%) |
(13.5%) |
(9.2%) |
(10.3%) |
9.3% |
(28.6%) |
31.3% |
(6.9%) |
(0.3%) |
55.9% |
51.7% |
(3.2%) |
21.5% |
1.5% |
10.6% |
|
HF Group |
(58.3%) |
19.4% |
(12.4%) |
63.3% |
6.6% |
28.6% |
28.8% |
(10.1%) |
21.6% |
94.3% |
71.7% |
2.8% |
7.7% |
6.1% |
12.3% |
|
Q3'2025 Mkt Weighted Average* |
7.6% |
(2.6%) |
(21.7%) |
13.4% |
8.2% |
(3.3%) |
33.1% |
4.1% |
3.2% |
29.9% |
67.9% |
4.8% |
21.7% |
4.2% |
12.0% |
|
Q3’2024 Mkt Weighted Average** |
24.6% |
25.5% |
52.9% |
14.7% |
7.9% |
14.5% |
36.9% |
10.0% |
2.3% |
10.4% |
66.3% |
(2.3%) |
23.5% |
4.9% |
12.5% |
|
*Market cap weighted as at 11/12/2025 |
|||||||||||||||
|
**Market cap weighted as at 11/12/2024 |
|||||||||||||||
Key takeaways from the table include:
- The listed banks recorded a 7.6% growth in core Earnings per Share (EPS) in Q3’2025, compared to the weighted average growth of 24.6% in Q3’2024, an indication of weaker performance on the back of a 3% decline in non-funded income in Q3’2025, compared to a growth of 14.5% in Q3’2024. This was majorly attributable to a decline in foreign exchange income due to reduced dollar demand and lower transaction volumes weighing down on fees and commissions income growth which declined by 5.9% points to 4.1% in Q3’2025 from 10.0% in Q3’2024. The performance during the period was mainly weighed down by a 3.3% weighted average decline in non-funded income, but however supported by a 13.4% weighted average growth in net interest income,
- Investments in government securities investments by listed banks increased significantly in Q3’2025, having recorded a market-weighted average growth of 29.9%, from the 10.4% growth recorded in Q3’2024, with all of the listed banks recording increases in government securities investments. HF Group and Absa Bank Kenya recorded the largest increases of 94.3% and 71.1% respectively.
- The listed banks’ Net loans and advances to customers recorded a weighted average growth of 4.8% in Q3’2025, an increase from the 2.3% decline recorded in Q3’2024, an indicating increased lending activity supported by easing borrowing costs, as a result of declining lending interest rates.
- Interest income recorded a weighted average decline of 2.6% in Q3’2025, compared to a growth of 25.5% in Q3’2024. Similarly, interest expenses recorded a market-weighted average decline of 21.7% in Q3’2025 compared to a growth of 52.9% in Q3’2024. Consequently, net interest income recorded a weighted average growth of 13.4% in Q3’2025, slightly lower than the 14.7% growth recorded in Q3’2024, on the back of easing monetary policy leading to lower lending and deposit rates,
- Notably, non-funded income growth softened during the year, as evidenced by non-funded income weighted average decline of 3.3% in Q3’2025 compared to a weighted average growth of 14.5% in Q3’2024. The performance was largely attributable to the decrease in foreign exchange income recorded by the banks during the period as a result of decreased dollar demand in the country. Additionally, listed banks recorded a weighted average growth of 4.1% in total fees and commissions income in Q3’2025 compared to a weighted growth of 10.0% in Q3’2024, and,
- The listed banks recorded a 21.7% weighted average growth on return on average equity (RoaE), 1.8% points lower than the 23.5% growth registered in Q3’2024. Similarly, the entire banking sector’s Return On Equity (ROE) stood at 2% as of September 2025, a 0.8% points decrease from the 23.0% recorded in June 2025 and a 2.7% points decrease from the 24.9% recorded in September 2024 . On a global level, the Kenyan banking sector continues to record high profitability compared to other economies in the world, as highlighted in the chart below:
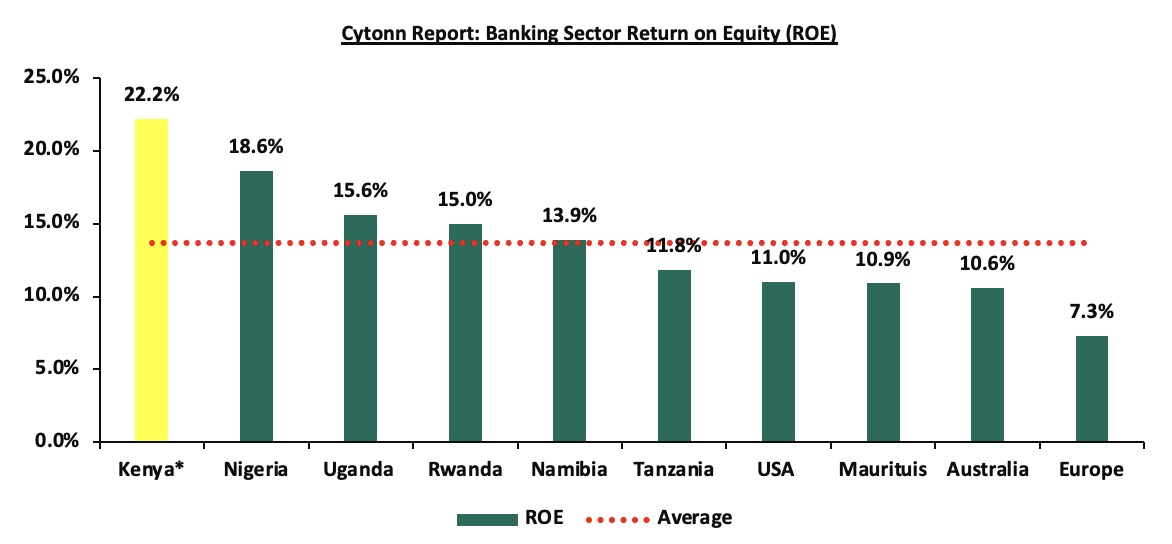
Source: Cytonn research
* Figure as of September 2025
Section III: The Focus Areas of the Banking Sector Players Going Forward:
The banking sector witnessed a slowdown in profitability during the period under review, with the Core Earnings Per Share (EPS) increasing by 7.6% compared to the 24.6% growth registered last year in a similar period, this is primarily due to a 3.3% decline in non-funded income in Q3’2025, compared to a growth of 14.5% in Q3’2024. This was majorly attributable to a decline in foreign exchange income due to reduced dollar demand and lower transaction volumes weighing down on fees and commissions income Notably, all six of the ten listed banks recorded a decline in non-funded income in Q3’2025, highlighting the sector’s continued reliance on Interest income. This concentration has exposed banks to earnings pressure in an increasingly interest-rate-sensitive environment. While there were expectations of an improved operating environment following continued monetary policy easing, evidenced by a lower Central Bank Rate (CBR) of 9.0% as of December 2025 and a relatively stable Shilling, the broader economic performance has yet to translate into meaningful revenue diversification or asset quality improvement. Consequently, profitability remains constrained, and it is uncertain whether banks will reduce provisioning levels in the near term. Any moderation in provisioning will largely depend on sustained economic recovery and a material easing of credit risk. Notably, general provisions among listed banks recorded a higher weighted growth of 12.1% in Q3’2025, compared to 7.0% in Q3’2024, underscoring persistent asset quality concerns despite the more accommodative monetary policy stance. Based on the current operating environment, we believe the future performance of the banking sector will be shaped by the following key factors:
- Growth in Interest income: Going forward, we expect interest income growth to remain a key driver in the banking industry. With the recent easing of monetary policy by the Central Bank of Kenya, which lowered the Central Bank Rate (CBR) by 25 basis points to 9.0% in December 2025, signals a gradual reduction in borrowing costs. This is likely to support an increase in credit uptake, expanding banks' loan books and consequently boosting interest income. Additionally, the continued use of banks' risk-based lending models will enable banks to effectively price their risk, further contributing to the growth of interest income.,
- Revenue Diversification: In Q3’2025, non-funded income (NFI) recorded a 3.3% weighted average decline, a reversal from the 14.5% weighted growth in Q3’2024. This contraction was largely driven by lower foreign exchange income, reflecting subdued FX trading volumes and reduced transactional activity as exchange rate volatility remained relatively muted, limiting trading and revaluation gains despite the broadly stable Shilling. In addition, the slowdown in fees and commissions income, one of the key components of NFI, also contributed to the weaker performance, with growth moderating to 4.1% in Q3’2025 from 10.0% in Q3’2024, reflecting softer transactional volumes and a potential tapering in digital revenue momentum. Notably, this deceleration occurred with 6 of the 10 listed Banks recording a decrease in their non-funded income. As a result of the decline in non-funded income (NFI) the weighted average contribution of NFI to total operating income came in at 33.1% in Q3’2025, 3.8% points lower than the 36.9% weighted average contribution recorded in Q3’2024 and as such, there still exists an opportunity for the sector to further increase NFI contributions to revenue given the continuous adoption of digitization,
- Growth in Loans and Advances: While 7 of the listed banks experienced modest positive loan growth, 3 out of the 10 listed banks recorded negative growth in loans and advances to customers, resulting in a weighted average growth in loans of 4.8% relative to the 2.3% decline recorded in a similar period in 2024. With the consistent ease in the Central Bank Rate (CBR) recently, borrowing costs are expected to decline. This reduction is anticipated to support credit growth by encouraging increased borrowing by the private sector and easing financial pressures on borrowers. To drive further loan growth, banks must leverage opportunities such as risk-based lending models, improved customer segmentation, and expanding access to credit in underserved sectors, and,
- Regional Expansion and Further Consolidation: Consolidation remains a key theme going forward with the current environment offering opportunities for larger banks with a sufficient capital base to expand and take advantage of the market's low valuations, as well as further consolidate out smaller and weaker banks. Notably, the majority of the bigger banks have continued to cushion over unsystematic risks specific to the local market by expanding their operations into other African nations. Banks such as KCB and Equity Group have been leveraging on expansion and consolidation, which has largely contributed to their increased asset base as well as earnings growth. Additionally, we expect the increased capital requirements imposed on banks to further accelerate consolidation, as only well-capitalized banks are able to meet these thresholds while pursuing expansion opportunities. As such, we expect to see a continued expansion trend aimed at revenue optimization.
Section IV: Brief Summary and Ranking of the Listed Banks:
As per our analysis of the banking sector from a franchise value and a future growth opportunity perspective, we carried out a comprehensive ranking of the listed banks. For the franchise value ranking, we included the earnings and growth metrics as well as the operating metrics shown in the table below in order to carry out a comprehensive review of the banks:
|
Cytonn Report: Listed Banks Earnings, Growth and Operating Metrics Q3’2025 |
||||||||
|
Bank |
Loan to Deposit Ratio |
Cost to Income (With LLP) |
Return on Average Capital Employed |
Deposits/ Branch (bn) |
Gross NPL Ratio |
NPL Coverage |
Tangible Common Ratio |
Non-Funded Income/Revenue |
|
Absa Bank |
80.6% |
48.0% |
26.8% |
4.6 |
13.0% |
67.1% |
16.8% |
29.2% |
|
KCB Group |
74.7% |
58.5% |
22.7% |
11.6 |
17.2% |
67.9% |
14.5% |
30.2% |
|
Coop Bank |
74.1% |
56.0% |
18.8% |
3.3 |
17.3% |
63.7% |
19.6% |
32.8% |
|
Stanbic Bank |
73.6% |
54.5% |
18.5% |
3.1 |
8.1% |
83.2% |
13.7% |
27.6% |
|
HF Group |
71.7% |
74.7% |
7.7% |
13.2 |
23.3% |
74.3% |
21.4% |
28.8% |
|
I&M Holdings |
66.2% |
60.1% |
19.2% |
3.1 |
10.2% |
69.5% |
16.8% |
26.0% |
|
Equity Bank |
63.9% |
58.0% |
24.5% |
2.6 |
13.6% |
71.1% |
15.2% |
40.1% |
|
NCBA Group |
60.0% |
61.7% |
21.0% |
2.4 |
12.1% |
68.9% |
17.2% |
40.0% |
|
DTBK |
58.1% |
67.3% |
11.2% |
3.3 |
12.4% |
52.1% |
15.2% |
26.7% |
|
SCBK |
51.7% |
59.3% |
21.5% |
3.9 |
5.9% |
85.1% |
15.4% |
31.3% |
|
Weighted Average Q3'2025 |
67.9% |
57.8% |
21.7% |
5.0 |
13.2% |
70.6% |
16.1% |
33.1% |
|
Market cap weighted as at 10/12/2025 |
||||||||
The overall ranking was based on a weighted average ranking of Franchise value (accounting for 60.0%) and intrinsic value (accounting for 40.0%). The Intrinsic Valuation is computed through a combination of valuation techniques, with a weighting of 40.0% on Discounted Cash-flow Methods, 35.0% on Residual Income, and 25.0% on Relative Valuation, while the Franchise ranking is based on a bank’s operating metrics, meant to assess efficiency, asset quality, diversification, and profitability, among other metrics. The overall Q3’2025 ranking is as shown in the table below:
|
Cytonn Report: Listed Banks Q3’2025 Rankings |
|||||
|
Bank |
Franchise Value Rank |
Intrinsic Value Rank |
Weighted Rank Score |
Q3'2024 Rank |
Q3'2025 Rank |
|
Absa Bank |
1 |
3 |
1.8 |
1 |
1 |
|
Equity Bank |
3 |
4 |
3.4 |
6 |
2 |
|
Coop Bank |
6 |
1 |
4.0 |
2 |
3 |
|
SCBK |
2 |
8 |
4.4 |
3 |
4 |
|
NCBA Group |
7 |
2 |
5.0 |
5 |
5 |
|
I&M Holdings |
4 |
7 |
5.2 |
6 |
6 |
|
KCB Group |
5 |
10 |
7.0 |
8 |
7 |
|
DTBK |
9 |
6 |
7.8 |
9 |
8 |
|
HF Group |
10 |
5 |
8.0 |
10 |
9 |
|
Stanbic Bank |
8 |
9 |
8.4 |
4 |
10 |
Major Take-outs from the Q3’2025 Ranking are:
- Absa Bank maintained position 1 in Q3’2025, mainly supported by strong franchise value score and intrinsic value score, attributable to decrease in the cost to income ratio by 7.0% points to 48.0% in Q3’2025, from 55.0% in Q3’2024 coupled with an increase in the bank’s return on average equity ratio by 0.5% points to 26.8% in Q3’2025 from 26.4% in Q3’2024,
- Equity Bank climbed up 4 places to rank at position 2 in Q3’2025, up from position 6 in Q3’2024 supported by significant improvement in its intrinsic value score. Its performance attributable to the decrease in its cost to income ratio by 6.0% points to 58.0% in Q3’2025 from 64.0% in Q3’2024. Notably, the bank’s Net Interest Margin increased by 0.2% points to 7.9% in Q3’2025 from 7.7% in Q3’2024,
- Stanbic slid 6 places to rank at position 10 in Q3’2025, down from position 4 in Q3’2024, attributable a decline in intrinsic value score and the franchise value score mainly on the back of 0.3% points decline in Return on average equity to 18.5% in Q3’2025 from the 22.2% recorded in Q3’2024, coupled with the 2.7% points increase in its cost to income without LLPs to 45.6% in Q3’2025, from 42.9% in Q3’2024.
For more information, see our Cytonn Q3’2025 Listed Banking Sector Review full report.
Disclaimer: The views expressed in this publication are those of the writers where particulars are not warranted. This publication, which is in compliance with Section 2 of the Capital Markets Authority Act Cap 485A, is meant for general information only and is not a warranty, representation, advice, or solicitation of any nature. Readers are advised in all circumstances to seek the advice of a registered investment advisor.


