Following the release of the FY’2020 results by Kenyan listed banks, the Cytonn Financial Services Research Team undertook an analysis on the financial performance of the listed banks and identified the key factors that shaped the performance of the sector.
Core Earnings per Share recorded a weighted decline of 26.8% in FY’2020, compared to a weighted growth of 8.9% recorded in FY’2019. The decline in the earnings was mainly attributable to the increased provisioning levels, which increased by 233.2% to Kshs 110.7 bn in FY’2020 from Kshs 33.2 bn in FY’2019, for the listed banking sector.
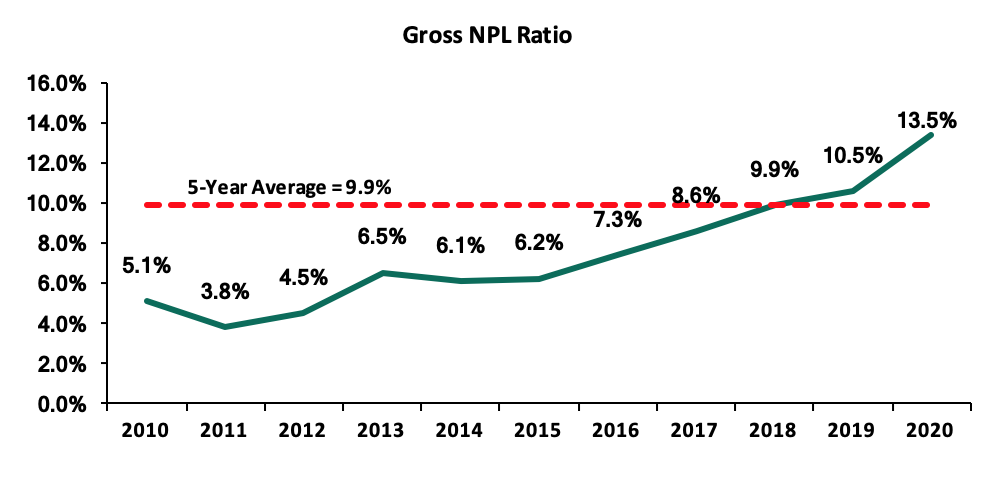
Asset quality for the listed banks deteriorated, with the NPL ratio rising by 3.0% points to 13.5% in FY’2020 from 10.5% in FY’2019, and higher than the 5-year average of 9.9%. By the end of December 2020, the banking sector had restructured loans amounting to Kshs 1.6 tn (54.2% of the total banking sectors loans book) in order to offer relief for their customers in line with the Central Banks’ guidance on loan restructuring. Key to note, the restructuring window ran from 18th March 2020 to 2nd March 2021.
The report is themed “Subdued Growth in Earnings Amidst Deteriorating Asset Quality” where we assess the key factors that influenced the performance of the banking sector in FY’2020, the key trends, the challenges banks faced, and areas that will be crucial for growth and stability of the banking sector going forward. As such, we shall address the following:
- Key Themes That Shaped the Banking Sector Performance in FY’2020,
- Summary of The Performance of the Listed Banking Sector in FY’2020,
- The Focus Areas of the Banking Sector Players Going Forward, and,
- Brief Summary and Ranking of the Listed Banks based on the Outcome of Our Analysis.
Section I: Key Themes That Shaped the Banking Sector Performance in FY’2020
Below, we highlight the key themes that shaped the banking sector in FY’2020 which include regulation, consolidation, asset quality deterioration, and capital conservation:
- Regulation :
-
Guidance on Loan Restructuring: On March 27th 2020, the Central Bank of Kenya provided commercial banks and mortgage finance companies with guidelines on loan reclassification and provisioning on extended and restructured loans as per the Banking Circular No 3 of 2020. The loan restructuring involved placing moratoriums on both interest and principal payments between three to twelve months, in effect giving reprieve to borrowers who found it difficult to repay their loans due to the impact caused by the pandemic. Following this guidance, the banking sector saw loans worth Kshs 1.6 tn restructured as at December 2020, representing 54.2% of the banking sector loan book.
The table below highlights some of the major banks that have disclosed the amount of loans they restructured;
|
No. |
Bank |
Amount Restructured (Kshs bn) |
% of restructured loans to total loans |
FY’2020 y/y Change in Loan Loss Provision |
|
1 |
Equity Group Holdings |
171.0 |
35.8% |
402.2% |
|
2 |
Kenya Commercial Bank |
106.1 |
19.6% |
209.5% |
|
3 |
Diamond Trust Bank |
101.0 |
45.0% |
453.6% |
|
4 |
NCBA Group |
78.0 |
31.4% |
227.0% |
|
5 |
Absa Bank Kenya |
62.0 |
29.7% |
114.9% |
|
6 |
Co-operative Bank of Kenya |
46.0 |
14.9% |
219.5% |
|
7 |
Standard Chartered Bank of Kenya |
22.0 |
18.1% |
578.0% |
|
|
Total |
586.1 |
|
|
- Consolidation: Consolidation activity remained one of the key highlights as players in the sector were either acquired or merged, leading to the formation of relatively larger, well capitalized, and possibly more stable entities. The following were the major M&A’s activities witnessed in 2020:
- On 27th January 2020, Nigerian lender Access Bank PLC completed the acquisition of a 100.0% stake in Transnational Bank PLC for an undisclosed amount, with Access Bank PLC targeting to enhance its corporate and retail banking business in Kenya. Access Bank is Nigeria’s largest lender by assets base, with an asset base of USD 22.9 bn (equivalent to Kshs 2.5 tn) as at December 2020. This deal saw Nigerian banks deepen their presence in Kenya with the United Bank of Africa (UBA) and Guarantee Trust Bank (GT Bank) already in the market. For more information on the transaction, see Cytonn Weekly #03/2020,
- On 7th April 2020, the Central Bank of Kenya (CBK) approved the acquisition of a 51.0% stake in Mayfair Bank Limited by an Egyptian lender, Commercial International Bank (CIB), effective 1st May 2020 for an undisclosed amount. The Central Bank of Kenya (CBK) welcomed the transaction, citing it will diversify and strengthen the resilience of the Kenyan banking sector. Commercial International Bank is Egypt’s leading private sector bank with an asset base of USD 27.2 bn (Kshs 3.0 tn) as of December 2020. CIB’s business model focusses on individuals, SMEs, institutions, and corporates and will be the first Egyptian bank to establish a presence in Kenya. For more information on the transaction, see Cytonn Weekly #17/2020,
- On 4th May 2020, the Central Bank of Kenya approved the acquisition of Imperial Bank’s assets and assumption of liabilities worth Kshs 3.2 bn each by KCB Group effective 2nd June 2020. The move will see Imperial Bank depositors paid a total of Kshs 3.2 bn over a period of 4 years and will have cumulatively recovered 37.3% of the deposits since 2015, when payments commenced. Imperial Bank was put under receivership (a process that can assist creditors to recover funds in default and can help troubled companies to avoid bankruptcy) in October 2015 due to inappropriate banking practices, with the CBK transferring Imperial Bank’s management and control to the KDIC. For more information on the transaction, see Cytonn Weekly #21/2020,
- On 25th August 2020, Co-operative Bank Kenya completed the 90.0% acquisition of Jamii Bora Bank and rebranded it to Kingdom Bank Limited. The transaction that had started in March for a 100.0% purchase of the Bank at Kshs 1.1 bn, was completed in August 2020 after receiving all the approvals, with Co-operative Bank varying its initial offer of 100.0% stake to a 90.0% stake. For more information on the transaction, see Cytonn Weekly #35/2020, Cytonn Weekly #32/2020 and Cytonn Weekly #26/2020,
- Equity Group Holdings completed the 66.5% stake acquisition of the Banque Commerciale Du Congo (BCDC) at a cost of USD 95.0 mn (Kshs 10.3 bn). Initially, the deal was to cost USD 105.0 mn (Kshs 11.4 bn), however factoring in the adverse effects of the COVID-19 pandemic on the two economies, the two parties agreed to reduce the amount to USD 95.0 mn (Kshs 10.3 bn). Key to note, following the acquisition of BCDC, Equity Group recorded a 50.7% growth in total assets to Kshs 1,015.7 bn, from Kshs 673.7 bn in FY’2019. For more information on the transaction, see Cytonn Weekly #33/2020,
- I&M Holdings plc issued a circular to its shareholders on 3rd November 2020 revealing it would pay Kshs 3.7 bn to acquire 90.0% of Orient Bank Limited Uganda (OBL) share capital. The amount would be subject to adjustments on account of several factors including exchange rate fluctuations and amounts raised from the sale of the Ugandan bank’s property in Kampala (Orient Plaza). The announcement came 4 months after the two banks started negotiations, in July 2020. For more information, read more on Cytonn Weekly #50/2020, and,
- KCB Group disclosed it had entered into an agreement with Atlas Mara Limited (ATMA) to acquire a 62.1% stake in Banque De Populaire du Rwanda (BPR) in Rwanda and 100.0% stake in African Banking Corporation Ltd Tanzania (ABC Tanzania). The Group also separately intends to make an offer to acquire the remaining shares from the respective shareholders. The proposed acquisition is subject to approval from the shareholders, the Central Bank of Kenya, the National Bank of Rwanda, the COMESA Competition Commission and the Capital Markets Authority. KCB also agreed to purchase 96.6% stake of ABC Tanzania held by ABC Holdings Limited (ABCH), the wholly owned subsidiary of Atlas Mara. Additionally, KCB separately intends to make an offer to acquire the remaining shares of 3.4% from the Tanzania Development Finance Company Limited. Read more on the same Cytonn Weekly #30/2020.
Below is a summary of the deals in the last 5-years that have either happened, been announced or expected to be concluded:
|
Acquirer |
Bank Acquired |
Book Value at Acquisition (Kshs. Bns) |
Transaction Stake |
Transaction Value |
P/Bv Multiple |
Date |
|
KCB Group |
Banque Populaire du Rwanda |
5.2 |
62.1% |
5.7 |
1.1x |
Nov-20* |
|
KCB Group |
ABC Tanzania |
Unknown |
100.0% |
Undisclosed |
0.4x |
Nov-20* |
|
Co-operative Bank |
Jamii Bora Bank |
3.4 |
90.0% |
1 |
0.3x |
Aug-20 |
|
I&M Holdings |
Orient Bank Ltd |
3.5 |
90.0% |
3.6 |
1.1x |
Jul-20* |
|
Commercial International Bank |
Mayfair Bank Limited |
1 |
51.0% |
Undisclosed |
N/D |
May-20* |
|
Access Bank PLC (Nigeria) |
Transnational Bank PLC. |
1.9 |
100.0% |
1.4 |
0.7x |
Feb-20* |
|
Equity Group ** |
Banque Commerciale Du Congo |
8.9 |
66.5% |
10.3 |
1.2x |
Nov-19* |
|
KCB Group |
National Bank of Kenya |
7 |
100.0% |
6.6 |
0.9x |
Sep-19 |
|
CBA Group |
NIC Group |
33.5 |
53%:47% |
23 |
0.7x |
Sep-19 |
|
Oiko Credit |
Credit Bank |
3 |
22.8% |
1 |
1.5x |
Aug-19 |
|
CBA Group** |
Jamii Bora Bank |
3.4 |
100.0% |
1.4 |
0.4x |
Jan-19 |
|
AfricInvest Azure |
Prime Bank |
21.2 |
24.2% |
5.1 |
1.0x |
Jan-18 |
|
KCB Group |
Imperial Bank |
Unknown |
Undisclosed |
Undisclosed |
N/A |
Dec-18 |
|
SBM Bank Kenya |
Chase Bank Ltd |
Unknown |
75.0% |
Undisclosed |
N/A |
Aug-18 |
|
DTBK |
Habib Bank Kenya |
2.4 |
100.0% |
1.8 |
0.8x |
Mar-17 |
|
SBM Holdings |
Fidelity Commercial Bank |
1.8 |
100.0% |
2.8 |
1.6x |
Nov-16 |
|
M Bank |
Oriental Commercial Bank |
1.8 |
51.0% |
1.3 |
1.4x |
Jun-16 |
|
I&M Holdings |
Giro Commercial Bank |
3 |
100.0% |
5 |
1.7x |
Jun-16 |
|
Mwalimu SACCO |
Equatorial Commercial Bank |
1.2 |
75.0% |
2.6 |
2.3x |
Mar-15 |
|
Centum |
K-Rep Bank |
2.1 |
66.0% |
2.5 |
1.8x |
Jul-14 |
|
GT Bank |
Fina Bank Group |
3.9 |
70.0% |
8.6 |
3.2x |
Nov-13 |
|
Average |
|
|
74.7% |
|
1.2x |
|
|
* Announcement Date ** Deals that were dropped |
||||||
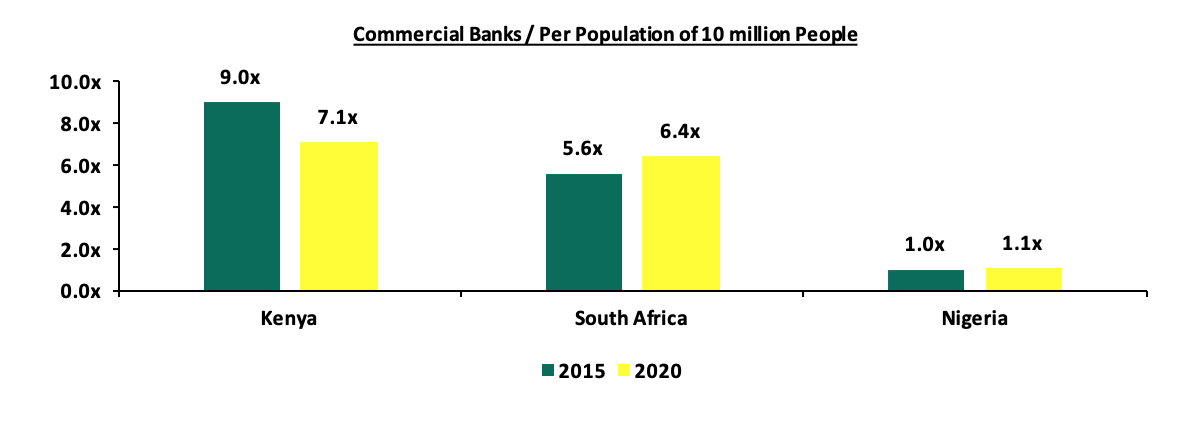
The number of commercial banks in Kenya has now reduced to 38, compared to 43 banks 5-years ago. The ratio of the number of banks per 10 million population in Kenya now stands at 7.1x, which is a reduction from 9.0x 5-years ago, demonstrating continued consolidation of the banking sector. However, despite the ratio improving, Kenya still remains overbanked as the number of banks remains relatively high compared to the population. For more on this see our topical.
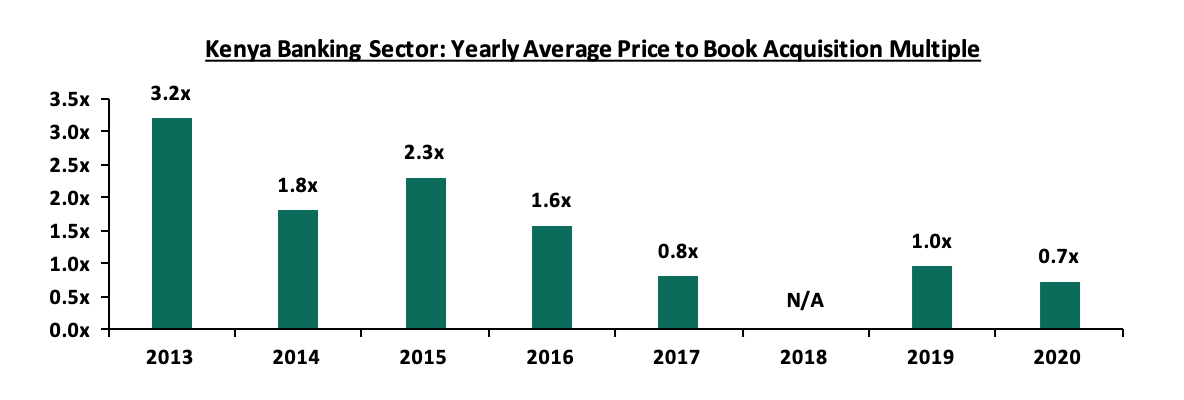
Additionally, the acquisition valuation for banks has come down significantly, from an average acquisition multiple of 3.2x price to book value in 2013, to 0.7x price to book value in 2020, as highlighted in the chart below;
- Asset Quality Deterioration - Asset quality for listed banks deteriorated in FY’2020, with the Gross NPL ratio rising by 3.0% points to 13.5% from 10.5% in FY’2019. This was high compared to the 5-year average of 9.9%. The deterioration in asset quality was due to the coronavirus-induced downturn in the economy, which led to an uptick in the non-performing loans. Consequently, the NPL coverage rose to 62.2% in FY’2020 from 57.6% recorded in FY’2019, in accordance with IFRS 9, where banks are expected to provide both for the incurred and expected credit losses. The significantly higher provisional requirement levels led to reduced profitability during the year across the banking sector, leading to the core earnings recording a weighed decline of 26.8%. 7 out of the 10 listed banks issued profit warnings during the financial year attributable to the deteriorating asset quality and higher provisioning requirements. According to the March 2021 MPC Press Release, the NPL ratio for the banking sector stood at 14.5% as at February 2021, a deterioration from 14.1% in December 2020. High levels of NPLs were witnessed in sectors such as Trade, Personal and Household and Manufacturing sectors which registered q/q increases of 38.5%, 16.7% and 9.6% in their NPL levels respectively.
The chart below highlights the asset quality trend:
The table below highlights the asset quality for the listed banking sector:
|
|
FY'2019 NPL Ratio |
FY'2020 NPL Ratio |
FY'2019 NPL Coverage |
FY'2020 NPL Coverage |
|
ABSA Bank Kenya |
6.6% |
7.7% |
77.0% |
71.1% |
|
Diamond Trust Bank |
7.7% |
10.4% |
42.9% |
44.6% |
|
Equity Group |
9.5% |
11.5% |
47.5% |
62.4% |
|
I&M Holdings |
11.3% |
11.6% |
59.1% |
66.8% |
|
Stanbic Bank |
9.6% |
11.8% |
57.1% |
60.6% |
|
NCBA Group |
12.6% |
14.7% |
55.9% |
60.9% |
|
KCB |
11.1% |
14.8% |
59.5% |
59.8% |
|
Standard Chartered Bank |
13.9% |
16.0% |
78.7% |
80.6% |
|
Co-operative Bank of Kenya |
11.2% |
18.7% |
51.8% |
50.3% |
|
HF Group |
27.7% |
24.6% |
47.8% |
63.4% |
|
Mkt Weighted Average |
10.5%** |
13.5%* |
57.6%** |
62.2%* |
|
*Market cap weighted as at 15/04/2021 **Market cap weighted as at 09/04/2020 |
||||
Key take-outs from the table include;
- Asset quality for the listed banks deteriorated during the period of review, with the weighted average NPL ratio rising by 3.0% points to a market cap weighted average of 13.5%, from 10.5% in FY’2019. The deterioration in asset quality was as a result of the coronavirus-induced downturn in the economy which led to an uptick in the non-performing loans. Notably, for Diamond Trust Bank (DTB-K), and NCBA the NPL ratio is at the highest it has been for more than a decade,
- NPL Coverage for the listed banking sector increased to a market cap weighted average of 62.2% in FY’2020, from 57.6% recorded in FY’2019, as the banks increased their provisioning levels to proactively manage risks given the tough economic conditions occasioned by the pandemic. This was in line with our expectations of higher provisioning levels which would subdue profitability in FY’2020 across the banking sector on account of the tough business environment, and,
- ABSA and Co-operative Bank recorded a decline in their NPL Coverage despite their NPL ratios rising, which could suggest modest provisioning. Given the current economic environment and elevated risk of loans defaults, we expected higher provisioning for the banks. Key to note, if Cooperative Bank’s NPL Coverage remained at the 51.8% level recorded in 2019, the bank would have had an additional provisioning of Kshs 0.9 bn, which would have reduced the earnings per share from the reported Kshs 2.1 to Kshs 1.8, while if ABSA’s NPL coverage remained at the 77.0%, level recorded in 2019, the bank would have had an additional provisioning of Kshs 1.5 bn, which would have reduced the earnings per share from the reported Kshs 0.8 to Kshs 0.5.
-
Capital Preservation: The Central Bank of Kenya, on 14th August 2020, directed that Banks will have to get approval before declaring dividends for the FY’2020 financial year, in a bid to ensure that the banks have enough capital that will enable them to respond appropriately to the COVID-19 pandemic. The Central Bank gave guidance to lenders, asking them to revise their ICAAP (Internal Capital Adequacy Assessment Process) based on the pandemic as highlighted in the Banking Circular No 11 of 2020. Subject to the submission of the revised ICAAP, CBK would determine if it would endorse the board’s decision to pay out dividends. A similar trend was mirrored globally by both financial and non-financial businesses frantically seeking ways to save money with several regulators encouraging companies to cease the discretionary payments of dividends to shareholders. For instance, in the United Kingdom (UK), the seven largest banks sought to cancel dividend pay-outs in May 2020 despite having solid capital bases, due to fears of an economic recession. Additionally, the Central Banks of most countries offered guidelines to banks on dividend payments, with for instance the Federal Reserve announcing on 25th June 2020 that it would cap dividend payments and prevent share repurchases up to the end of 2020. Closer home, on 6th April 2020, the South African Reserve Bank’s Prudential Authority advised banks not to pay out dividends this year and that the bonuses for senior executives should also be put on hold during this period as well. The authority highlighted that this directive would ensure banks conserve their capital and as such, enable the banks to fulfil their fundamental roles.
As banks reinforced their capital adequacy and liquidity requirements in FY’2020, regulators globally have adopted a softer stance on dividend payments due to banks’ resilience amid the pandemic coupled with their adequate capital buffers. The Bank of England, through the Prudential Regulation Authority (PRA), a regulator and part of the central bank, granted banks authority to issue dividends in December 2020 after carrying out two stress tests of banks’ capital positions and judged that banks are now resilient to a wide range of economic outcomes. The Federal Reserve, on the other hand, will issue a stress test which will determine if banks will be allowed to resume normal dividend pay-outs from June 30th 2021. The European Central Bank also lifted curbs on dividends but urged banks to limit their pay-out to less than 15.0% of profit, or 0.2% of their key capital ratio for 2019 and 2020. The South African Reserve Bank‘s Prudential Authority also eased their stance on dividend payments by banks, while insisting that protecting cash reserves should still remain a key priority amid ongoing uncertainty from the Covid-19 pandemic.
Following the release of the FY’2020 results, 6 of the 10 Kenyan listed banks issued dividends to their shareholders, an indication that the capital adequacy and risk management policies employed under ICAAP for most of the listed banks was satisfactory to the CBK in FY’2020. Below are the listed banks that declared dividends in FY’2020:
|
# |
Bank |
Dividends per share (Kshs) |
Amount (Kshs bn) |
|
1 |
Cooperative Bank |
1.00 |
5.9 |
|
2 |
Standard Chartered Bank |
10.50 |
3.6 |
|
3 |
KCB Group |
1.00 |
3.2 |
|
4 |
NCBA Group |
1.50 |
2.3 |
|
5 |
I&M Holdings |
2.25 |
1.9 |
|
6 |
Stanbic Bank |
3.80 |
1.5 |
|
Total |
18.4 |
||
Section II: Summary of the Performance of the Listed Banking Sector in FY’2020:
The table below highlights the performance of the banking sector, showing the performance using several metrics, and the key take-outs of the performance;
|
Bank |
Core EPS Growth |
Interest Income Growth |
Interest Expense Growth |
Net Interest Income Growth |
Net Interest Margin |
Non-Funded Income Growth |
NFI to Total Operating Income |
Growth in Total Fees & Commissions |
Deposit Growth |
Growth in Government Securities |
Loan to Deposit Ratio |
Loan Growth |
Return on Average Equity |
|
Equity |
(10.9%) |
23.5% |
26.3% |
22.6% |
7.6% |
25.1% |
41.1% |
6.9% |
53.5% |
26.8% |
64.5% |
30.4% |
16.5% |
|
Stanbic |
(18.6%) |
(3.4%) |
(1.6%) |
(4.1%) |
4.7% |
(8.7%) |
44.9% |
(18.7%) |
15.7% |
25.0% |
75.5% |
2.7% |
10.3% |
|
I&M |
(21.9%) |
2.5% |
5.1% |
0.6% |
5.4% |
4.3% |
35.6% |
4.4% |
14.3% |
88.6% |
71.3% |
6.9% |
13.2% |
|
KCB |
(22.1%) |
19.4% |
14.2% |
21.0% |
8.5% |
1.0% |
29.5% |
(10.4%) |
11.7% |
26.6% |
77.6% |
10.3% |
14.4% |
|
Co-op |
(24.4%) |
11.9% |
1.3% |
16.1% |
8.5% |
1.9% |
32.5% |
0.7% |
13.8% |
37.4% |
75.7% |
7.5% |
12.5% |
|
SCBK |
(33.9%) |
(6.1%) |
(20.4%) |
(1.8%) |
6.8% |
(10.2%) |
30.2% |
(12.0%) |
12.3% |
0.2% |
47.4% |
(5.6%) |
11.0% |
|
NCBA |
(41.7%) |
73.4% |
54.0% |
91.1% |
5.8% |
3.1% |
45.1% |
19.2% |
11.4% |
12.8% |
59.0% |
(0.3%) |
6.6% |
|
ABSA |
(44.2%) |
1.3% |
2.7% |
0.9% |
7.1% |
5.2% |
32.3% |
(9.9%) |
6.7% |
2.5% |
82.3% |
7.2% |
15.1% |
|
DTB-K |
(51.5%) |
(5.4%) |
(8.0%) |
(3.4%) |
5.0% |
6.1% |
25.3% |
(7.8%) |
6.4% |
12.0% |
70.0% |
4.8% |
5.8% |
|
HF Group |
N/A |
(17.4%) |
(23.8%) |
(5.2%) |
4.2% |
(63.0%) |
21.8% |
(38.0%) |
6.8% |
54.4% |
92.6% |
(4.0%) |
(23.3%) |
|
FY'20 Mkt Weighted Average* |
(26.8%) |
16.7% |
12.5% |
18.9% |
7.3% |
6.4% |
35.4% |
(2.1%) |
22.3% |
26.3% |
69.8% |
11.7% |
13.2% |
|
FY'19 Mkt Weighted Average** |
8.9% |
3.2% |
3.4% |
3.4% |
7.3% |
17.4% |
37.4% |
18.4% |
12.7% |
19.4% |
75.0% |
12.8% |
18.4% |
|
*Market cap weighted as at 15/04/2021 |
|||||||||||||
|
**Market cap weighted as at 09/04/2020 |
|||||||||||||
Key takeaways from the table above include:
- Core Earnings Per Share (EPS) recorded a weighted decline of (26.8%), compared to a weighted growth of 8.9% in FY’2019,
- The sector recorded a weighted average deposit growth of 22.3%, faster than the 12.7% growth recorded in FY’2019,
- Interest expense, on the other hand, grew faster, by 12.5%, compared to 3.4% in FY’2019. Cost of funds, however, declined, coming in at a weighted average of 3.1% in FY’2020, from 3.2% in FY’2019, owing to the faster growth in average interest-bearing liabilities, an indication that the listed banks were able to mobilize cheaper deposits,
- Average loan growth came in at 11.7%, slower than the 12.8% recorded in FY’2019. The loan growth was also slower than the 26.3% growth in government securities, an indication of banks’ preference of investing in Government securities as opposed to lending due to the elevated credit risk occasioned by the pandemic,
- Interest income rose by 16.7%, compared to a growth of 3.2% recorded in FY’2019. Despite the rise in interest income, the Yield on Interest Earning Assets (YIEA) declined to 10.1% from the 10.4% recorded in FY’2019, due to increased allocation to lower-yielding government securities by the sector. The decline in the YIEA can also be attributed to the reduced lending rates for customers by the sector, in line with the Central Bank Rate cuts. Consequently, the Net Interest Margin (NIM) remained flat at 7.3% for the whole listed banking sector, and,
- Non-Funded Income grew by 6.4% y/y, slower than 17.4% growth recorded in FY’2019. The performance in NFI was on the back of declined growth in fees and commission of (2.1%), which was slower than the 18.4% growth recorded in FY’2019. The lower growth in fees and commission can be attributed to the waiver on fees on mobile transactions below Kshs 1,000 and the free bank-mobile money transfer. Banks with a large customer base who rely heavily on mobile money transactions took the biggest hit.
Section III: Outlook of the banking sector:
The banking sector witnessed a decline in profitability, attributable to the tough operating environment occasioned by the COVID-19 pandemic which affected loan repayment due to disruption of businesses, job losses and the consequent reduction of disposable income. The waiver of charges on transactions also affected the Non-Funded Income (NFI) performance with the listed banks recording a slower 6.4% weighted growth in NFI, from the 17.4% growth recorded in FY’2019. Following the expiry of the waiver on fees and commissions on loans and the loan restructuring window having closed in March 2021, we expect the banking sector’s performance to improve in the medium to long term. Based on the current operating environment, we believe the future performance in the banking sector will be shaped by the following key factors:
- Growth in Interest income: With interest income growth at 16.7% as at FY’2020 outpacing the 3.2% growth recorded in FY’2019, interest income growth will remain a key industry driver going forward. The continued allocation to government securities which are witnessing slight increases in yields will also lead to an increase in overall interest income. The discovery and distribution of vaccines will be key for the recovery of the economy as restriction measures are gradually eased and credit risk declines. The expiry of the restructuring and moratorium window given to borrowers will also enable banks to further increase interest income growth which will lead to increased profitability,
- Revenue Diversification: In FY’2020, Non-Funded Income recorded a 6.4% weighted average growth, compared to a growth of 17.4% in FY’2019. The banking sector’s Non-Funded Income to Operating Income also declined, coming in at 35.4% in FY’2020 compared to 37.4% of Operating Income in FY’2019, consequently contributing to slower earnings growth across the sector. The slower growth in Non-Funded Income is attributable to the waiver on fees and commissions on loans and advances issued by the CBK on March 2020. Given that Non-Funded Income contributes less than 50.0% of listed banks’ operating income, there exists an opportunity for the sector to increase NFI contribution to revenue going forward. With the expiry of the waiver on bank charges on 2nd March 2021, we expect NFI growth to recover in the medium-long term due to the increased adoption of digital channels. According to Central Bank Annual Report 2019/2020, 67.0% of banking transactions were conducted on mobile phones after the onset of the pandemic, compared to 55.0% of transactions before the pandemic. Moreover, more than 1.6 mn additional customers are now using mobile-money channels compared to the period before the pandemic began. The increased uptake of digital channels will enable banks to leverage on these platforms and generate Non-Funded Income from transactions. This presents an ideal opportunity for the banking sector to diversify away from their reliance on interest income in the long term and boost revenue growth,
- Provisioning: Loan Loss Provisions recorded a growth of 233.2% in FY’2020 to Kshs 110.7 bn from Kshs 33.2 bn in FY’2019 for the listed banking sector, attributed to the heightened credit risk arising from the adverse effects of the pandemic which affected individuals and businesses’ ability to service loans. Given that the duration of the pandemic remains unknown, coupled with the emergence of the ‘third wave’ of the COVID-19, we believe that the normalization of the sector’s provisioning levels to pre-pandemic levels will take longer than expected. However, the proactive stance taken by the banks in monitoring their loan books coupled with the measures implemented by the Central Bank will continue to support the sector’s growth. In the medium to long-term, we expect banks to continue overprovisioning albeit at a slower rate than in 2020. Additionally, we expect the higher provisioning requirements as per the IFRS guidelines to further subdue the profitability of the banking sector,
- Increased Liquidity due to lower Cash Reserve Ratio (CRR): The Monetary Policy Committee (MPC) during their 29th April 2020 meeting lowered the Cash Reserve Ratio (CRR), which is a fraction of total customer deposits that the commercial banks have to hold with the Central Bank, by 100 bps to 4.25% from 5.25%. The reduction is projected to have injected approximately Kshs 35.2 bn in additional liquidity to commercial banks for onward lending to distressed borrowers. The reduction was a first one since July 2009. The MPC, during their March 2021 MPC Meeting highlighted that Kshs 32.8 bn, representing 93.2% of the Kshs 35.2 bn injected had been utilized by the banking sector to offer reprieve to their customers as well as support lending in the sectors that have been hard hit by the pandemic such as Tourism, Manufacturing and Real Estate. We expect the low CRR ratio to improve the banking sector’s liquidity and as such, banks will have more money to loan to businesses and individuals as well as invest in other businesses. Additionally, given that a low CRR translates to a low amount held in the CBK at no interest, we expect this to lead to a decline in the interest rates charged on loans by the sector,
- Cost Rationalization: Given the low revenues and increased automation, banks are expected to continue pursuing their cost rationalization strategies. A majority of banks have been riding on the digital revolution wave to improve their operational efficiency. Increased adoption of alternative channels of transactions such as mobile, internet, and agency banking, has led to increased transactions carried out via alternative channels and out of bank branches, which have been reduced to handling high-value transactions and other services such as advisory. Banks reduced front-office operations, thereby cutting the number of staff required and by extension, reducing operating expenses and hence, improving operational efficiency, and,
- Expansion and Further Consolidation: With consolidation remaining a key theme in FY’2020, the current environment could provide opportunities for bigger banks with an adequate capital base to expand and take advantage of the low valuations in the market to further consolidate and buy out smaller banks. Consolidation will be key for most of the smaller banks that suffered losses during the pandemic, and would also benefit larger banks with the opportunity to improve their asset base. We believe that consolidation could also increase post-COVID as tier one banks resume their expansion strategies both locally and regionally as the economy improves.
Section IV: Brief Summary and Ranking of the Listed Banks:
As per our analysis on the banking sector from a franchise value and a future growth opportunity perspective, we carried out a comprehensive ranking of the listed banks. For the franchise value ranking, we included the earnings and growth metrics as well as the operating metrics shown in the table below in order to carry out a comprehensive review of the banks:
|
Bank |
Loan to Deposit Ratio |
Cost to Income (With LLP) |
Return on Average Capital Employed |
Deposits /Branch |
Gross NPL Ratio |
NPL Coverage |
Tangible Common Ratio |
Non Funded Income/Revenue |
|
Coop Bank |
75.7% |
73.2% |
12.5% |
2.1 |
18.7% |
50.3% |
15.9% |
32.5% |
|
KCB Group |
77.6% |
73.3% |
14.4% |
2.1 |
14.8% |
59.8% |
13.9% |
29.5% |
|
DTBK |
70.0% |
81.3% |
5.8% |
2.2 |
10.4% |
44.6% |
14.4% |
25.3% |
|
Equity Bank |
64.5% |
77.6% |
16.5% |
2.2 |
11.5% |
62.4% |
12.2% |
41.1% |
|
I&M Holdings |
71.3% |
52.0% |
13.2% |
4.0 |
11.6% |
66.8% |
16.6% |
35.6% |
|
NCBA Group |
59.0% |
86.2% |
6.6% |
6.0 |
14.7% |
60.9% |
12.6% |
45.1% |
|
Absa Bank |
82.3% |
74.4% |
15.1% |
3.0 |
7.7% |
71.1% |
12.2% |
32.3% |
|
SCBK |
47.4% |
73.0% |
11.0% |
7.1 |
16.0% |
80.6% |
14.8% |
30.2% |
|
Stanbic Bank |
75.5% |
52.2% |
10.3% |
10.4 |
11.8% |
60.6% |
13.0% |
44.9% |
|
HF Group |
92.6% |
170.1% |
(18.1%) |
1.8 |
24.6% |
63.4% |
14.1% |
21.8% |
|
Weighted Average FY'2020 |
69.8% |
73.3% |
13.2% |
3.5 |
13.5% |
62.2% |
13.7% |
35.4% |
The overall ranking was based on a weighted average ranking of Franchise value (accounting for 60.0%) and intrinsic value (accounting for 40.0%). The Intrinsic Valuation is computed through a combination of valuation techniques, with a weighting of 40.0% on Discounted Cash-flow Methods, 35.0% on Residual Income and 25.0% on Relative Valuation, while the Franchise ranking is based on banks operating metrics, meant to assess efficiency, asset quality, diversification, and profitability, among other metrics. The overall FY’2020 ranking is as shown in the table below:
|
Bank |
Franchise Value Score |
Intrinsic Value Score |
Weighted Score |
Q3'2020 Rank |
FY'2020 Rank |
|
I&M Holdings |
1 |
1 |
1.0 |
1 |
1 |
|
Equity Group Holdings Ltd |
4 |
2 |
2.8 |
4 |
2 |
|
KCB Group Plc |
3 |
4 |
3.6 |
5 |
3 |
|
ABSA |
2 |
5 |
3.8 |
7 |
4 |
|
DTBK |
9 |
3 |
5.4 |
2 |
5 |
|
Stanbic Bank/Holdings |
6 |
6 |
6.0 |
6 |
6 |
|
Co-operative Bank of Kenya Ltd |
5 |
7 |
6.2 |
3 |
7 |
|
SCBK |
7 |
8 |
7.6 |
9 |
8 |
|
NCBA Group Plc |
8 |
9 |
8.6 |
8 |
9 |
|
HF Group Plc |
10 |
10 |
10.0 |
10 |
10 |
Major Changes from the Q3’2020 Ranking are:
- Equity Group recorded an improvement in the overall ranking, coming in at position 2 from position 4 in Q3’2020 attributable a 55.2% increase in the group’s Non-Funded Income which contributed to an increase in the bank’s franchise value score, coupled with an improvement in the group’s NPL coverage which recorded a 10.4% points increase to 62.4% from 52.0% recorded in Q3’2020,
- ABSA’s rank improved to position 4 from position 7 in Q3’2020 attributable to the bank having the lowest NPL ratio among listed banks at 7.7% compared to the sector’s weighted average NPL ratio of 13.5% which contributed to an increase in the bank’s franchise value score, coupled with an Improvement in the bank’s NPL coverage, which recorded a 6.2% points increase to 71.1% from 64.9% in Q3’2020 and,
- Co-operative Bank’s rank declined to Position 7 from Position 3 in Q3’2020 mainly due to a deterioration in the asset quality as evidenced by the high NPL ratio of 18.7% in FY’2020, from 13.2% in Q3’2020, in turn, worsening it Franchise Value score.
For more information, see our Cytonn FY’2020 Listed Banking Sector Review
Disclaimer: The views expressed in this publication are those of the writers where particulars are not warranted. This publication, which is in compliance with Section 2 of the Capital Markets Authority Act Cap 485A, is meant for general information only and is not a warranty, representation, advice or solicitation of any nature. Readers are advised in all circumstances to seek the advice of a registered investment advisor.


