Following the release of the FY’2021 results by Kenyan listed banks, the Cytonn Financial Services Research Team undertook an analysis on the financial performance of the listed banks and identified the key factors that shaped the performance of the sector.
The Asset Quality for the listed banks improved in FY’2021, with the gross NPL ratio declining by 1.2% points to 12.3%, from 13.5% in FY’2020. We however note that despite this improvement in the asset quality, the NPL ratio remains higher than the 10-year average of 8.1%. The listed banks’ management quality also improved, with the Cost to Income ratio improving by 16.9% points to 56.4%, from 73.3% recorded in FY’2020, as banks continued to reduce their provisioning levels following the improved business environment during the period.
Consequently, Core Earnings per Share (EPS) recorded a weighted growth of 82.9% in FY’2021, from a weighted decline of 26.8% recorded in FY’2020. The performance is however skewed by the strong performance from ABSA, NCBA Group and Equity Group, which recorded core EPS growths of 161.2%, 123.7% and 99.4%, respectively.
The report is themed “Reduced Loan Provisions Spur Banking Sector Recovery in 2021” where we assess the key factors that influenced the performance of the banking sector in FY’2021, the key trends, the challenges banks faced, and areas that will be crucial for growth and stability of the banking sector going forward. As such, we shall address the following:
- Key Themes that Shaped the Banking Sector Performance in FY’2021,
- Summary of the Performance of the Listed Banking Sector in FY’2021,
- The Focus Areas of the Banking Sector Players Going Forward, and,
- Brief Summary and Ranking of the Listed Banks based on the Outcome of Our Analysis.
Section I: Key Themes That Shaped the Banking Sector Performance in FY’2021
Below, we highlight the key themes that shaped the banking sector in FY’2021 which include; regulations, regional expansion through mergers and acquisitions, asset quality and capital raising for onward lending:
- Regulation:
- Closure of Loan restructuring Window: The loan restructuring window as per the Banking Circular No 3 of 2020 by the Central Bank of Kenya provided to commercial banks and mortgage finance companies on loan restructuring came to an end on March 2nd, having seen a total of loans worth Kshs 1.7 tn restructured, representing 57.0% of the banking sector’s loan book. With this expiry the banks are now back to normal loan risk management. However, despite the expiry of the loan restructuring window, some banks still supported their borrowers during the period. Equity Group, KCB Group, Diamond Trust Bank and Cooperative Bank disclosed the cumulative amount of loans they have restructured as at Q1’2021;
|
No. |
Bank |
Cumulative Amount Restructured (Kshs bn) |
% of restructured loans to total loans |
Q1’2021 y/y Change in Loan loss provision |
|
1 |
Equity Group Holdings |
171.0 |
31.0% |
(59.3%) |
|
2 |
Kenya Commercial Bank |
102.5 |
18.8% |
(1.3%) |
|
3 |
Diamond Trust Bank |
72.0 |
33.0% |
67.7% |
|
4 |
Co-operative Bank of Kenya |
49.0 |
14.3% |
153.5% |
|
|
Total |
394.5 |
24.3% |
40.2% |
- Decrease in Capital Adequacy risk weighting for all residential mortgages: The Central Bank of Kenya (CBK) published the Banking Circular No 2 of 2021, indicating that they had reduced the capital adequacy risk weighting for all residential mortgages to 35.0% from 50.0%, effective 1st July 2021. The move by CBK to reduce the capital adequacy risk weighting aims at creating an enabling environment for the banking sector to be able to lend more to the domestic residential mortgage market through availing long-term and secured funds to primary mortgage lenders. However, banks have recently been seen taking precautionary measures such as conducting frequent evaluations and demanding additional security from borrowers using real estate as collateral during the loan repayment period in the event that the value of the existing collateral drops to a level below that of the loan. Additionally, banks are anticipated to only accept collateral whose value is seven times bigger than the value of the loan being applied for,
- Integration of Climate-Related Risk Management: The Central Bank of Kenya (CBK) released Guidance on Climate-Related Risk Management, highlighting that all banks and mortgage finance companies ought to integrate the risks and opportunities arising from climate change in their risk management, strategy and governance structure. Opportunities expected to arise from climate change include financing activities such as the transition to renewable energy, appropriate housing, resilient infrastructure and innovative agricultural practices. On the other hand, banks are expected to build their capacity going forward to identify and mitigate the risks arising from climate change,
- Suspension of the Listing of Borrower’s Negative Credit Information: The Central Bank of Kenya (CBK) announced a 12 months suspension of listing of negative credit information for borrowers with loans below Kshs 5.0 mn, whose loans were performing previously, but have become non-performing from 1st October, 2021. The move by the CBK is an intervention measure aiming to cushion Micro Small and Medium Enterprises from adverse effects of the COVID-19 pandemic. We expect banks to be more cautious towards lending to MSMEs due to lack of adequate credit risk information on potential loan borrowers, and,
- Regulation of Digital Lenders: The Central Bank of Kenya (CBK) enacted the law to regulate digital lenders on 7th December 2021, granting the bank the authority to license and oversee previously unregulated digital credit providers. The regulations published on 18th March 2022, are aimed at protecting borrowers against the predatory practices of unregulated digital credit providers, particularly their high costs, unethical debt collection practices, and misuse of personal information. We expect the move to streamline the digital lending services sector and weed out unscrupulous digital lenders who have taken advantage of the unregulated space to violate various consumer rights and privacy. Additionally, lenders will be able to acquire licenses to increase their market share and operate in a more favourable environment. For more information see our Cytonn Weekly #49/2021.
- Regional Expansion through Mergers and Acquisitions: Kenyan banks are looking at having an extensive regional reach and to this end, the following were the major M&A’s activities announced in FY’2021:
- On 3rd May 2021, I&M Group announced that it had completed the 90.0% acquisition of Orient Bank Limited Uganda (OBL) share capital, after receiving all the required regulatory approvals. As highlighted in our Cytonn Weekly #50/2020, I&M Group was set to pay Kshs 3.6 bn for the deal. However, the final cost is yet to be revealed as it was expected to be higher after the base price was adjusted to take into account multiple factors such as appreciation of the Ugandan shilling against the US dollar, integration support, the short-term financial performance of the subsidiary and the sale of its property. I&M Group took over 14 branches from OBL, taking its total branches to 87, from 75 branches as at the end of 2020. For more information, please see Cytonn Weekly #18/2021, and Cytonn Weekly #45/2021,
- On 16th May 2021, Equity Group disclosed that it had acquired an additional 7.7% stake valued at Kshs 996.0 mn in Equity bank Congo (EBC) from the German Sovereign Wealth Fund (KfW). The acquisition raised the total ownership in EBC to 94.3%, indicating that they valued the company at Kshs 14.2 bn. This follows the acquisition of 66.5% stake in Banque Commerciale Du Congo (BCDC) by Equity Group at a cost of Kshs 10.2 bn in August 2020. For more information, please see Cytonn Weekly#20/2021,
- On 25th August 2021, KCB Group announcedthat it had completed the 62.1% acquisition of Banque Populaire du Rwanda Plc (BPR), after receiving all the required regulatory approvals. KCB Group and Atlas Mara Limited had signed a definitive agreement in November 2020 for KCB’s acquisition of a 62.1% stake in BPR subject to shareholder and regulatory approval. In May 2021, KCB Group disclosed that it made an offer to the remaining BPR shareholders to raise its acquisition stake in the bank to 100.0% from 62.1% and received shareholders’ approval for the acquisitions, with only regulatory approval pending for the finalization of the transactions. As highlighted in our Cytonn Weekly #29/2021 and Cytonn Weekly #19/2021, KCB Group agreed to purchase 62.1% stake in BPR from Atlas Mara Limited using a Price to Book Value (P/Bv) of 1.1x. According to the BPR financials released as of June 2021, the bank had a book value of Rwf 52.9 bn (Kshs 5.8 bn), and thus at the trading multiple of 1.1x, we expect KCB Group to have spent an estimated Kshs 6.3 bn to acquire BPR Rwanda. For more information on the acquisition, see our Cytonn Weekly #19/2021, and,
- On 2nd December 2021, KCB announced the termination of their initial plans to acquire a 100.0% stake in African Banking Corporation Limited (ABC Tanzania) following the failure to receive certain regulatory approvals. In November 2020, KCB Group and Atlas Mara Limited came to an agreement for KCB to acquire a 62.1% stake in Banque Populaire Du Rwanda (BPR) and a 100.0% stake in Africa Banking Corporation Tanzania Limited (BancABC) at a total of USD 56.9 mn (Kshs 6.4 bn), subject to shareholder and regulatory approval in the respective countries. However, despite the cancellation of the acquisition plans, KCB has assured its shareholders that it will continue pursuing attractive regional expansion opportunities to enhance their regional participation and accelerate growth. For more information on, see our Cytonn Monthly – November 2021.
We expect to see continued consolidation by the Kenyan banking sector as the weaker banks are merged with the big banks to form a stronger banking system. The COVID-19 pandemic exposed the weak banks in the industry which might need to be acquired by larger banks in order to boost their capital adequacy and liquidity ratios to the required minimum statutory levels. We also expect to see Kenyan banks continue to diversify into other African regions as they look to reduce their reliance on the Kenyan Market.
Below is a summary of the deals in the last 9years that have either happened, been announced or expected to be concluded:
|
Acquirer |
Bank Acquired |
Book Value at Acquisition (Kshs bn) |
Transaction Stake |
Transaction Value (Kshs bn) |
P/Bv Multiple |
Date |
|
KCB Group |
Banque Populaire du Rwanda |
5.3 |
100.0% |
5.6 |
1.1x |
August-21 |
|
I&M Holdings PLC |
Orient Bank Limited Uganda |
3.3 |
90.0% |
3.6 |
1.1x |
April-21 |
|
KCB Group** |
ABC Tanzania |
Unknown |
100% |
0.8 |
0.4x |
Nov-20* |
|
Co-operative Bank |
Jamii Bora Bank |
3.4 |
90.0% |
1 |
0.3x |
Aug-20 |
|
Commercial International Bank |
Mayfair Bank Limited |
1 |
51.0% |
Undisclosed |
N/D |
May-20* |
|
Access Bank PLC (Nigeria) |
Transnational Bank PLC. |
1.9 |
100.0% |
1.4 |
0.7x |
Feb-20* |
|
Equity Group ** |
Banque Commerciale Du Congo |
8.9 |
66.5% |
10.3 |
1.2x |
Nov-19* |
|
KCB Group |
National Bank of Kenya |
7 |
100.0% |
6.6 |
0.9x |
Sep-19 |
|
CBA Group |
NIC Group |
33.5 |
53%:47% |
23 |
0.7x |
Sep-19 |
|
Oiko Credit |
Credit Bank |
3 |
22.8% |
1 |
1.5x |
Aug-19 |
|
CBA Group** |
Jamii Bora Bank |
3.4 |
100.0% |
1.4 |
0.4x |
Jan-19 |
|
AfricInvest Azure |
Prime Bank |
21.2 |
24.2% |
5.1 |
1.0x |
Jan-18 |
|
KCB Group |
Imperial Bank |
Unknown |
Undisclosed |
Undisclosed |
N/A |
Dec-18 |
|
SBM Bank Kenya |
Chase Bank Ltd |
Unknown |
75.0% |
Undisclosed |
N/A |
Aug-18 |
|
DTBK |
Habib Bank Kenya |
2.4 |
100.0% |
1.8 |
0.8x |
Mar-17 |
|
SBM Holdings |
Fidelity Commercial Bank |
1.8 |
100.0% |
2.8 |
1.6x |
Nov-16 |
|
M Bank |
Oriental Commercial Bank |
1.8 |
51.0% |
1.3 |
1.4x |
Jun-16 |
|
I&M Holdings |
Giro Commercial Bank |
3 |
100.0% |
5 |
1.7x |
Jun-16 |
|
Mwalimu SACCO |
Equatorial Commercial Bank |
1.2 |
75.0% |
2.6 |
2.3x |
Mar-15 |
|
Centum |
K-Rep Bank |
2.1 |
66.0% |
2.5 |
1.8x |
Jul-14 |
|
GT Bank |
Fina Bank Group |
3.9 |
70.0% |
8.6 |
3.2x |
Nov-13 |
|
Average |
|
|
76.7% |
|
1.3x |
|
|
* Announcement Date ** Deals that were dropped |
||||||
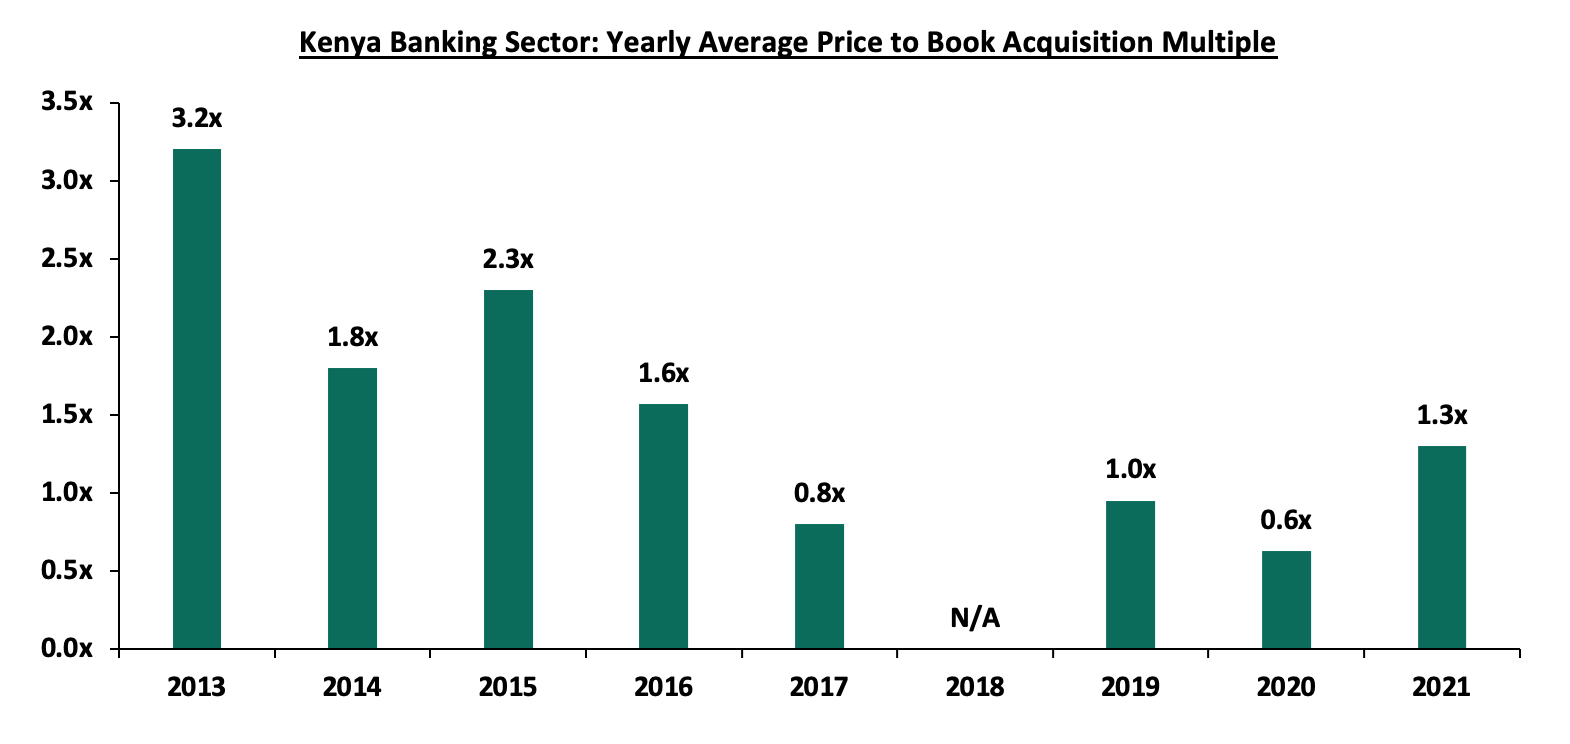
The acquisition valuations for banks has been recovering, with the valuations increasing from the average of 0.6x in 2020 to 1.3x in 2021. This however still remains low compared to historical prices paid as highlighted in the chart below;
The number of commercial banks in Kenya currently stands at 38, same as in FY’2021 but lower than the 43 licensed in FY’2015. The ratio of the number of banks per 10 million population in Kenya now stands at 7.1x, which is a reduction from 9.0x in FY’2015 demonstrating continued consolidation of the banking sector. However, despite the ratio improving, Kenya still remains overbanked as the number of banks remains relatively high compared to the population. For more on this see our topical.
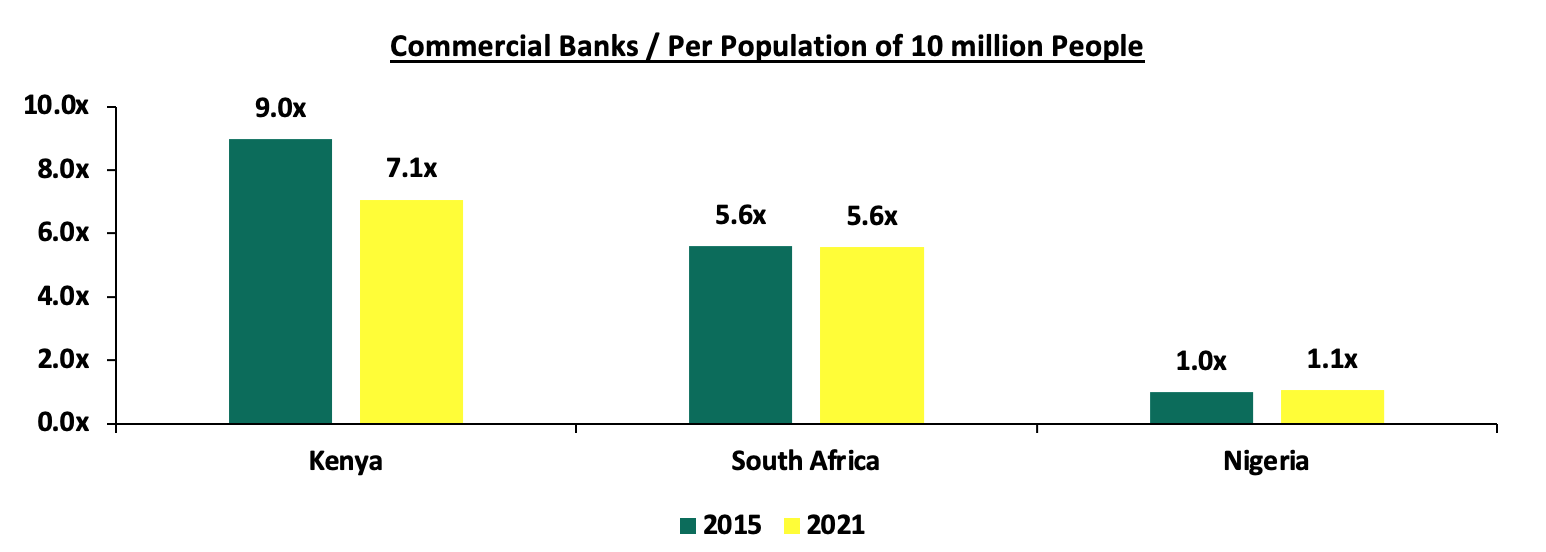
Source: Worl Bank, Central Bank of Kenya, South Africa Reserve Bank, Central Bank of Nigeria,
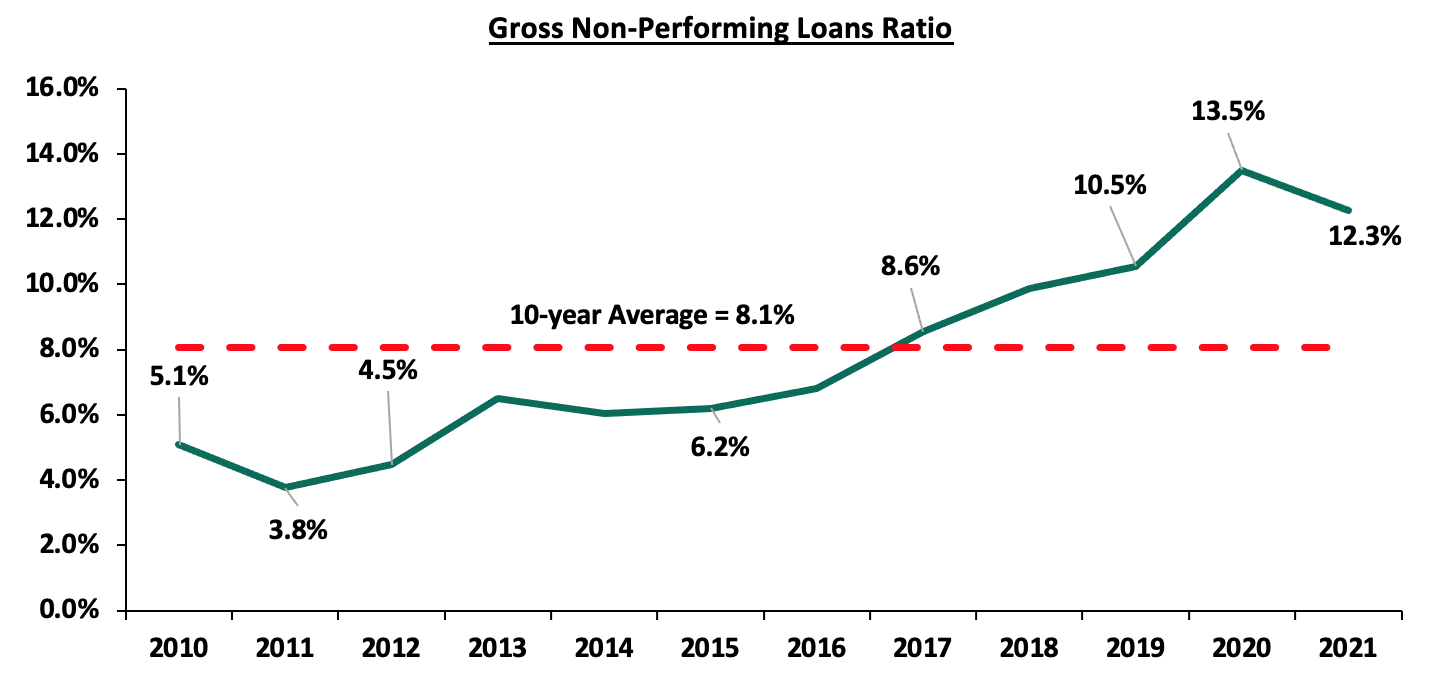
- Asset Quality: Asset quality for listed banks improved in FY’2021, with the Gross NPL ratio declining by 1.2% points to 12.3%, from 13.5% in FY’2020. The improvement in asset quality is attributable to the declining credit risk on the back of the improving operating environment. The NPL coverage rose to 65.5% in FY’2021, from 62.3% recorded in FY’2020, in accordance with IFRS 9, where banks are expected to provide both for the incurred and expected credit losses. According to the March 2022 MPC Press Release, the NPL ratio for the entire banking sector stood at 13.1% as at December 2021, an improvement from the 14.1% in December 2020, signifying an improvement in asset quality for the sector in FY’2021. However, the economic recovery has not been entirely smooth with the NPL ratio increasing to 14.0% in February 2022 with notable increases in the manufacturing, tourism, restaurant and hotels, building and construction and real estate sectors. We expect credit risk to decline gradually but remain at relatively elevated levels compared to previous years. The chart below highlights the asset quality trend for the listed banks:
The table below highlights the asset quality for the listed banking sector:
FY'2020 NPL Ratio**
FY'2021 NPL Ratio*
% point change in NPL Ratio
FY'2020 NPL Coverage**
FY'2021 NPL Coverage*
% point change in NPL Coverage
ABSA Bank Kenya
7.7%
7.9%
0.2%
71.1%
77.7%
6.6%
Equity Group
11.5%
8.6%
(2.9%)
62.4%
68.7%
6.3%
Stanbic Bank
11.8%
9.3%
(2.5%)
60.6%
51.8%
(8.8%)
I&M Holdings
11.6%
9.5%
(2.1%)
66.8%
71.4%
4.6%
Diamond Trust Bank
11.9%
12.9%
1.0%
40.0%
41.8%
1.8%
Co-operative Bank of Kenya
18.7%
14.6%
(4.1%)
50.3%
60.6%
10.3%
Standard Chartered Bank Kenya
16.0%
16.0%
0.0%
80.6%
84.4%
3.8%
NCBA Group
14.7%
16.0%
1.3%
60.9%
73.6%
12.7%
KCB
14.8%
16.6%
1.8%
59.8%
52.9%
(6.9%)
HF Group
24.6%
21.1%
(3.5%)
63.4%
73.6%
10.2%
Mkt Weighted Average
13.5%
12.3%
(1.2%)
62.2%
65.5%
3.1%
*Market cap weighted as at 14/04/2022
**Market cap weighted as at 15/04/2021
Key take-outs from the table include;
- Asset quality for the listed banks improved during the period, with the weighted average NPL ratio declining by 1.2% point to a market cap weighted average of 12.3%, from an average of 13.5% for the listed banking sector in FY’2020. The improvement in asset quality is attributable to declining credit risk on the back of increased business activities in 2021 driven by the gradual economic recovery,
- NPL Coverage for the listed banks increased to a market cap weighted average of 65.5% in FY’2021, from 62.2% recorded in FY’2020, as the banks increased their provisioning levels to proactively manage risks brought about by the emergence of new COVID-19 variants coupled with the slow recovery of some sectors such as tourism and hospitality, and,
- KCB Group recorded a decline in their NPL coverage despite the NPL ratio rising, which would suggest modest provisioning. Given the slow recovery in some sectors locally and the high NPL ratios in some of the group’s subsidiaries, we expected the group to provision more to cater for the prevailing credit risk. Key to note, If KCB’s NPL Coverage remained at the 59.8% level recorded in 2020, the bank would have had an additional provisioning of Kshs 8.4 bn, which would have reduced the earnings per share from the reported Kshs 10.6 to Kshs 8.6.
- Capital Raising: In FY’2021, listed banks’ turned to borrowing from international institutions to not only strengthen their capital position but also boost their ability to lend to the perceived riskier Micro Small and Medium Sized Enterprises (MSMEs) segment in order to support the small businesses in the tough operating environment occasioned by the COVID-19 pandemic. In the period under review, Equity Group received Kshs 34.9 bn from several instutions including a Kshs 5.5 bn loan from Proparco, a private sector financing arm of Agence Française de Dévelopement Group (AFD Group). This was in addition to the two guarantee facilities totalling Kshs 5.0 bn (€ 39.0 mn) for onward lending to MSMEs and a Kshs 70.0 mn (€ 550,000) technical assistance grant to support Equity Group Foundation’s health projects. Additionally, in November 2021, the Co-operative Bank of Kenya received Kshs 6.3 bn (USD 56.1 mn) from the European Investment Bank for lending to MSME firms with up to 250 workers. The trend has continued beyond the FY’2021 following the USD 165.0 mn (Kshs 18.6 bn) facility from the International Finance Corporation (IFC) to Equity Bank Kenya which was announced in January 2022. The loan is expected to be used to shore up the Bank’s Tier 2 capital and for onward lending to climate smart projects and Small and Medium Enterprises (SMEs) in Kenya. The table below highlights the disclosed loan facilities that banks have secured for capital injection and lending to the MSMEs so far:
|
Bank |
Amount Borrowed For Onward Lending (Kshs bn) |
Purpose |
|
Equity Bank |
86.5* |
MSME lending |
|
KCB Bank |
16.4 |
MSME lending |
|
Cooperative Bank |
17.3*** |
MSME lending and Tier II Capital** |
|
I&M Bank |
5.4 |
MSME lending and Tier II Capital** |
|
Total |
125.6 |
|
|
*Includes a Kshs 18.6 bn **Tier II Capital refers to a bank’s supplementary capital which includes senior debt (debt that a company must repay first before going out of business) with a tenure of not less than five years ***Includes a Kshs 6.3 bn loan from European Investment Bank (EIB) for onward lending to MSMEs |
||
Section II: Summary of the Performance of the Listed Banking Sector in FY’2021:
The table below highlights the performance of the banking sector, showing the performance using several metrics, and the key take-outs of the performance;
|
Bank |
Core EPS Growth |
Interest Income Growth |
Interest Expense Growth |
Net Interest Income Growth |
Net Interest Margin |
Non-Funded Income Growth |
NFI to Total Operating Income |
Growth in Total Fees & Commissions |
Deposit Growth |
Growth in Government Securities |
Loan to Deposit Ratio |
Loan Growth |
Return on Average Equity |
|
ABSA |
161.2% |
1.9% |
(15.9%) |
8.0% |
7.1% |
4.7% |
31.6% |
11.6% |
5.9% |
5.2% |
87.2% |
12.2% |
21.1% |
|
NCBA |
123.7% |
5.1% |
3.9% |
6.1% |
5.9% |
5.6% |
45.0% |
2.5% |
11.5% |
20.9% |
51.9% |
(1.8%) |
13.6% |
|
Equity |
99.4% |
27.9% |
37.2% |
24.8% |
6.8% |
15.8% |
39.3% |
29.4% |
29.5% |
30.0% |
61.3% |
23.0% |
26.6% |
|
KCB |
74.3% |
15.1% |
17.6% |
14.4% |
8.4% |
8.8% |
28.0% |
9.0% |
9.1% |
29.7% |
80.7% |
13.5% |
21.8% |
|
SCBK |
66.2% |
(6.1%) |
(24.7%) |
(1.6%) |
6.4% |
24.9% |
35.5% |
19.9% |
3.5% |
(4.2%) |
47.5% |
3.7% |
17.4% |
|
Co-op |
53.0% |
13.9% |
17.0% |
12.9% |
8.5% |
11.0% |
32.1% |
18.1% |
7.7% |
13.7% |
76.1% |
8.2% |
17.3% |
|
Stanbic |
38.8% |
2.1% |
(17.2%) |
12.3% |
5.0% |
1.7% |
42.5% |
1.1% |
(2.1%) |
(17.4%) |
83.0% |
16.8% |
13.3% |
|
DTB-K |
25.1% |
9.1% |
6.9% |
10.6% |
5.1% |
3.0% |
24.0% |
10.8% |
11.2% |
11.9% |
66.5% |
5.7% |
6.8% |
|
I&M |
0.7% |
18.8% |
(0.4%) |
33.8% |
6.3% |
1.1% |
29.0% |
16.9% |
13.0% |
23.4% |
71.0% |
12.4% |
12.2% |
|
HF Group |
(65.1%) |
(8.0%) |
(12.7%) |
(2.1%) |
4.2% |
3.6% |
22.8% |
21.2% |
(5.6%) |
(7.8%) |
92.0% |
(6.2%) |
(7.2%) |
|
FY'21 Mkt Weighted Average* |
82.9% |
13.8% |
11.5% |
15.2% |
7.1% |
10.9% |
34.7% |
16.6% |
13.5% |
18.1% |
69.7% |
13.5% |
20.2% |
|
FY'20 Mkt Weighted Average** |
(26.8%) |
16.7% |
12.5% |
18.9% |
7.3% |
6.4% |
35.4% |
(2.1%) |
22.3% |
26.3% |
69.8% |
11.7% |
13.2% |
|
*Market cap weighted as at 14/04/2022 |
|||||||||||||
|
**Market cap weighted as at 15/04/2021 |
|||||||||||||
Key takeaways from the table above include:
- For the FY’2021, listed banks recorded an 82.9% weighted average growth in core Earnings per Share (EPS), compared to a weighted average decline of 26.8% in FY’2020 for the listed banking sector. The performance was however largely skewed by the strong performance from ABSA Bank, NCBA and Equity Group whose core EPS grew by 161.2%, 123.7% and 99.4%, respectively,
- The Banks have recorded a weighted average deposit growth of 13.5%, slower than the 22.3% growth recorded in FY’2020,
- Interest expense recorded a slower growth of 11.5%, compared to the 12.5% growth in FY’2020 leading to a decline in the cost of funds to a weighted average of 2.8% in FY’2021, from 2.9% in FY’2020. This was due to the faster growth in average interest-bearing liabilities, an indication that the listed banks were able to mobilize cheaper deposits,
- Average loan growth came in at 13.5%, 1.8% points higher than the 11.7% growth recorded in FY’2020. Notably, the loan growth was lower than the 18.1% growth in government securities, an indication that banks shied away from lending due to uncertainties surrounding the emergence of new COVID-19 variants coupled with the slow recovery of some sectors such as tourism and hospitality,
- Interest income grew by 13.8%, slower than the growth of 16.7% recorded in FY’2020 while the weighted average Yield on Interest Earning Assets (YIEA) declined to 9.7%, from the 10.1% recorded in FY’2020 for the listed banking sector, an indication of the increased allocation to higher-yielding assets by the sector during the period. Net Interest Margin (NIM) now stands at 7.1%, 0.2% points lower than the 7.3% recorded in FY’2020 for the whole listed banking sector, and,
- Non-Funded Income grew by 10.9%, compared to the 6.4% growth recorded in FY’2020. This can be attributable to the faster growth in the fees and commission which grew by 16.6% compared to a decline of 2.1% in FY’2020, following the expiry of the waiver on fees on mobile transactions.
Section III: Outlook of the banking sector:
The banking sector recorded significant recovery in FY’2021, as evidenced by the increase in their profitability, with the Core Earnings Per Share (EPS) growing by 82.9%. The increase in EPS is mainly attributable to the reduced provisioning levels by the sector, as the Loan Loss Provisions declined by 44.3% in FY’2021, from the 233.2% growth recorded in FY’2020. However, despite this decline, we believe that the uncertainty surrounding the August 2022 elections coupled with the resurgence of COVID-19 variants in the country's trading partners, will see banks continue overprovisioning in the medium term, albeit lower than in 2020. Based on the current operating environment, we believe the future performance of the banking sector will be shaped by the following key factors:
- Growth in Interest income: Going forward, we expect interest income growth to remain a key driver in the industry, evidenced by the 13.8% growth recorded in FY’2021. Despite the growth being slower than the 16.7% growth that was recorded in FY’2020, we believe the continued allocation to government securities which are witnessing increases in yields will lead to an increase in overall interest income. The disclosure by banks that most customers that had restructured their loans are now servicing them as normal means that banks are now earning interest on loans restructured at the height of the pandemic. Additionally, banks continued to have negotiations with the Central Bank of Kenya (CBK) seeking to switch to risk based lending, a model that has the ability to assess the risk profile of each customer and assign them a rate that matches their risk profile. In our view, this move will play a big role in increasing the lenders interest income, as more people who are not able to access credit due to their risk profile, will be able to borrow money,
- Revenue Diversification: In FY’2021, Non-Funded Income recorded a 10.9% weighted average growth, a significant increase from the 6.4% growth recorded in FY’2020, attributable to the expiry of the waiver on fees and commissions on loans and advances issued by the CBK in March 2020. However, the banking sector’s Non-Funded Income to Operating Income declined, coming in at 34.7% in FY’2021, compared to 35.4% in FY’2020. There exists an opportunity for the sector to further increase NFI contribution to revenue going forward. The expiry of the waiver on bank charges on 2nd March 2021 is also expected to continue spurring NFI growth in the medium-long term due to the increased adoption of digital channels, which present an avenue for an increase in fees on transactions. According to Central Bank Annual Report 2019/2020, 67.0% of banking transactions were conducted on mobile phones after the onset of the pandemic, compared to 55.0% of transactions before the pandemic. The increase in mobile-banking transactions therefore provides an opportunity for banks to increase their Non-Funded income going forward,
- Provisioning: Loan Loss Provisions recorded a weighted average decline of 44.3% in FY’2021, compared to a growth of 233.2% in FY’2020. However, given the resurgence of COVID-19 variants in Kenya’s trading partners as well as the uncertainties surrounding the upcoming elections which are likely to disrupt the economic environment, we believe that a cautious approach is still required to manage credit risk in the banking sector,
- Cost Rationalization: The majority of banks have continued to pursue their cost-cutting strategy by riding on the digital revolution wave to improve operational efficiency and the reliability of out-of-branch transactions. Increased adoption of alternative transaction channels such as mobile, internet, and agency banking has resulted in an increase in transactions carried out through alternative channels, limiting branch transactions to high-value transactions and other services such as advisory. This has seen banks reduce front-office operations, thereby cutting the number of staff required and by extension, reducing operating expenses and hence, improving operational efficiency. Increased efficiency has been witnessed across the listed banks with the cost to income ratio having declined by 16.9% points to 73.3% in FY’2021, from 56.4% in FY’2020. However, some of the banks such as NCBA and DTB-K have announced plans to open more branches with an aim of increasing their physical presence,
- Expansion and Further Consolidation: With consolidation remaining a key theme going forward, the current environment may provide opportunities for larger banks with a sufficient capital base to expand and take advantage of the market's low valuations, as well as further consolidate/buy out smaller and weaker banks. Consolidation will be critical for the smaller banks that are still struggling during the recovery period, and it will also benefit larger banks by providing them with the opportunity to expand their operations locally and regionally and drive future growth. Furthermore, we believe Kenyan banks will continue to diversify into other African countries in order to reduce their reliance on the Kenyan market and distribute risks as well, and,
- Integration of Climate-Related Risk Management: Following the release of Guidance on Climate-Related Risk Management by the Central Bank of Kenya (CBK), we expect to see banks channel their long term financing into environmental-friendly assets that are more sustainable and have lower risk of damage loss as a result of climate change. Additionally, banks will focus on lending to companies whose activities do not pose an environmental risk and will ultimately lead to improvement of collateral quality consequently reducing their exposure to unexpected loss and obsolesce. This will lead to reduced non-performing loans and provisioning in the sector.
Section IV: Brief Summary and Ranking of the Listed Banks:
As per our analysis on the banking sector from a franchise value and a future growth opportunity perspective, we carried out a comprehensive ranking of the listed banks. For the franchise value ranking, we included the earnings and growth metrics as well as the operating metrics shown in the table below in order to carry out a comprehensive review of the banks:
|
Bank |
Loan to Deposit Ratio |
Cost to Income (With LLP) |
Return on Average Capital Employed |
Deposits/ Branch (bn) |
Gross NPL Ratio |
NPL Coverage |
Tangible Common Ratio |
Non Funded Income/Revenue |
|
Absa Bank |
87.2% |
57.9% |
21.1% |
3.2 |
7.9% |
74.5% |
13.1% |
32.0% |
|
NCBA Group |
51.9% |
68.1% |
13.6% |
4.5 |
16.0% |
70.2% |
12.3% |
44.3% |
|
Equity Bank |
61.3% |
49.1% |
26.6% |
2.8 |
8.6% |
60.6% |
12.2% |
39.7% |
|
KCB Group |
80.7% |
56.0% |
21.8% |
1.7 |
16.6% |
63.4% |
14.5% |
29.4% |
|
SCBK |
47.5% |
56.8% |
17.4% |
12.1 |
16.0% |
82.8% |
14.9% |
33.9% |
|
Coop Bank |
76.1% |
63.0% |
17.3% |
2.3 |
14.6% |
65.5% |
16.4% |
35.4% |
|
Stanbic Bank |
83.0% |
50.9% |
13.3% |
10.2 |
9.3% |
54.9% |
14.5% |
42.6% |
|
DTBK |
66.5% |
75.6% |
6.8% |
2.6 |
12.9% |
40.0% |
14.6% |
24.5% |
|
I&M Holdings |
71.0% |
59.9% |
12.2% |
3.4 |
9.5% |
70.6% |
15.4% |
30.7% |
|
HF Group |
92.0% |
136.3% |
(7.2%) |
1.7 |
21.1% |
60.0% |
12.6% |
24.7% |
|
Weighted Average FY’2021 |
69.7% |
56.4% |
20.2% |
4.0 |
12.3% |
65.5% |
13.9% |
35.4% |
The overall ranking was based on a weighted average ranking of Franchise value (accounting for 60.0%) and intrinsic value (accounting for 40.0%). The Intrinsic Valuation is computed through a combination of valuation techniques, with a weighting of 40.0% on Discounted Cash-flow Methods, 35.0% on Residual Income and 25.0% on Relative Valuation, while the Franchise ranking is based on banks operating metrics, meant to assess efficiency, asset quality, diversification, and profitability, among other metrics. The overall FY’2021 ranking is as shown in the table below:
|
Bank |
Franchise Value Rank |
Intrinsic Value Rank |
Weighted Rank |
Q3'2021 |
FY’2021 |
|
I&M Holdings |
4 |
1 |
23.4 |
3 |
1 |
|
Coop Bank |
3 |
3 |
23.8 |
6 |
2 |
|
KCB Group |
4 |
2 |
24.0 |
1 |
3 |
|
Equity Bank |
2 |
5 |
24.6 |
4 |
4 |
|
Absa Bank |
1 |
7 |
24.6 |
2 |
4 |
|
SCBK |
6 |
8 |
30.8 |
5 |
6 |
|
Stanbic Bank |
6 |
9 |
31.4 |
8 |
7 |
|
NCBA Group |
8 |
6 |
32.8 |
7 |
8 |
|
DTBK |
9 |
4 |
35.6 |
9 |
9 |
|
HF Group |
10 |
10 |
45.6 |
10 |
10 |
Major Changes from the Q3’2021 Ranking are:
- I&M Holdings’ rank recorded an improvement in the overall ranking to position 1 from position 3 in Q3’2021 attributable to a decline in the bank‘s Gross NPL ratio to 9.5%, from the 10.2% recorded in Q3’2021, leading to an increase in the bank’s franchise value score, coupled with an improvement in the bank’s Cost to Income ratio, which recorded a 2.2% points decline to 59.9% from 62.1% recorded in Q3’2021,
- Co-operative Bank’s rank improved to position 2 from position 6 in Q3’2021, attributable to an increase in the bank’s return on average equity to 17.3%, higher than the 14.2% recorded in Q3’2021. The bank’s Net Interest Margin ratio remained constant at 8.5%, which was the highest in the listed banking sector, and,
- KCB Group’s rank declined to position 3 after being ranked position 1 in Q3’2021, mainly due to a deterioration in the bank‘s asset quality, as the Gross NPL ratio rose to 16.6%, from the 13.7% recorded in Q3’2021.
For more information, see our Cytonn FY’2021 Listed Banking Sector Review
Disclaimer: The views expressed in this publication are those of the writers where particulars are not warranted. This publication, which is in compliance with Section 2 of the Capital Markets Authority Act Cap 485A, is meant for general information only and is not a warranty, representation, advice or solicitation of any nature. Readers are advised in all circumstances to seek the advice of a registered investment advisor.


