According to the Kenya National Bureau of Statistics (KNBS) Q3’2024 Quarterly Gross Domestic Product Report, the Kenyan economy recorded a 4.0% growth in Q3’2024, lower than the 6.0% growth recorded in Q3’2023. The main contributor to Kenyan GDP remains to be Agriculture, Fishing and Forestry sector which grew by 4.2% in Q3’2024, lower than the 5.1% expansion recorded in Q3’2023. In Q3’2024 all sectors, except Mining and Quarrying and Construction recorded positive growths, with varying magnitudes across activities. Most sectors recorded declining growth rates compared to Q3’2023 with Accommodation and Food Services, Mining and Quarrying and Financial & Insurance Sectors recording the highest declines of 20.8%, 11.9%, and 10.8% points, respectively. Other sectors that recorded a contraction in growth rate, from what was recorded in Q3’2023 were Construction, Electricity and Water Supply and Real Estate sectors, of 6.0%, 2.4%, and 2.2% points respectively. The slowed growth in the economy is majorly attributed to the high cost of borrowing , the low private sector credit growth and the high fuel prices. The Kenyan Economy is projected to grow at an average of 4.8% in 2024, revised from an average of 5.3% after a weaker-than-expected growth in Q2’2024 and Q3’2024, according to various organizations as shown below:
|
Cytonn Report: Kenya 2024 Growth Projections |
|||
|
No. |
Organization |
2024 GDP Projections |
2024 Revised GDP Projections |
|
1 |
International Monetary Fund |
5.3% |
5.0% |
|
2 |
National Treasury |
5.5% |
4.7% |
|
3 |
World Bank |
5.2% |
4.7% |
|
4 |
Fitch Solutions |
5.2% |
4.5% |
|
5 |
Cytonn Investments Management PLC |
5.4% |
4.9% |
|
Average |
5.3% |
4.8% |
|
Source: Cytonn Research
In 2025, the Kenyan economy is expected to rebound, returning to its growth path, with the average projected growth estimated at 5.2% by various organizations as outlined below:
|
Cytonn Report: Kenya 2025 Growth Projections |
||
|
No. |
Organization |
2025 GDP Projections |
|
1 |
International Monetary Fund |
5.0% |
|
2 |
National Treasury |
5.3% |
|
3 |
World Bank |
5.3% |
|
4 |
Fitch Solutions |
5.1% |
|
5 |
Cytonn Investments Management PLC |
5.4% |
|
Average |
5.2% |
|
Source: Cytonn Research
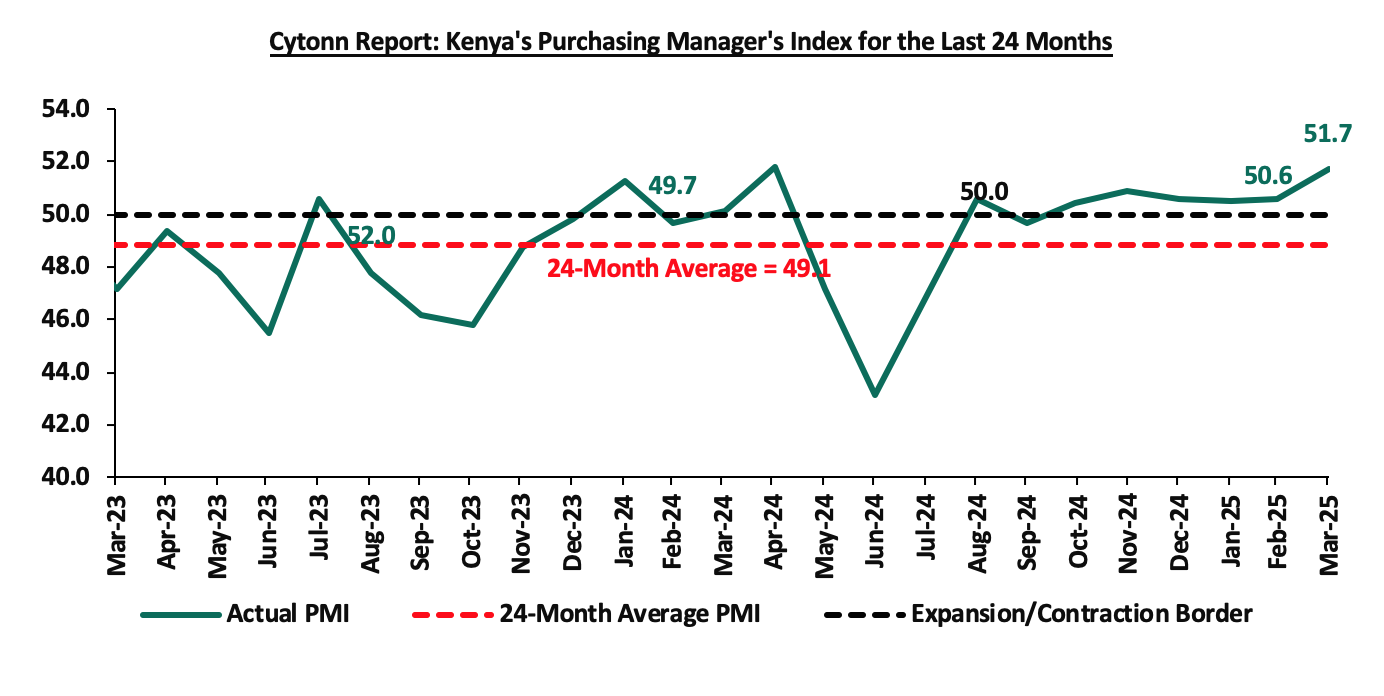
Key to note, Kenya’s general business environment slightly improved in Q1’2025, with the average Purchasing Manager’s Index coming in at 50.9, compared to 50.3 recorded in a similar period in 2024. The improvement was mainly on the back of easing monetary policy stance, reducing the cost of borrowing and increasing spending therefore supporting business activity. The chart below summarizes the evolution of PMI over the last 24 months. (A reading above 50.0 signals an improvement in business conditions, while readings below 50.0 indicate a deterioration):
 Inflation:
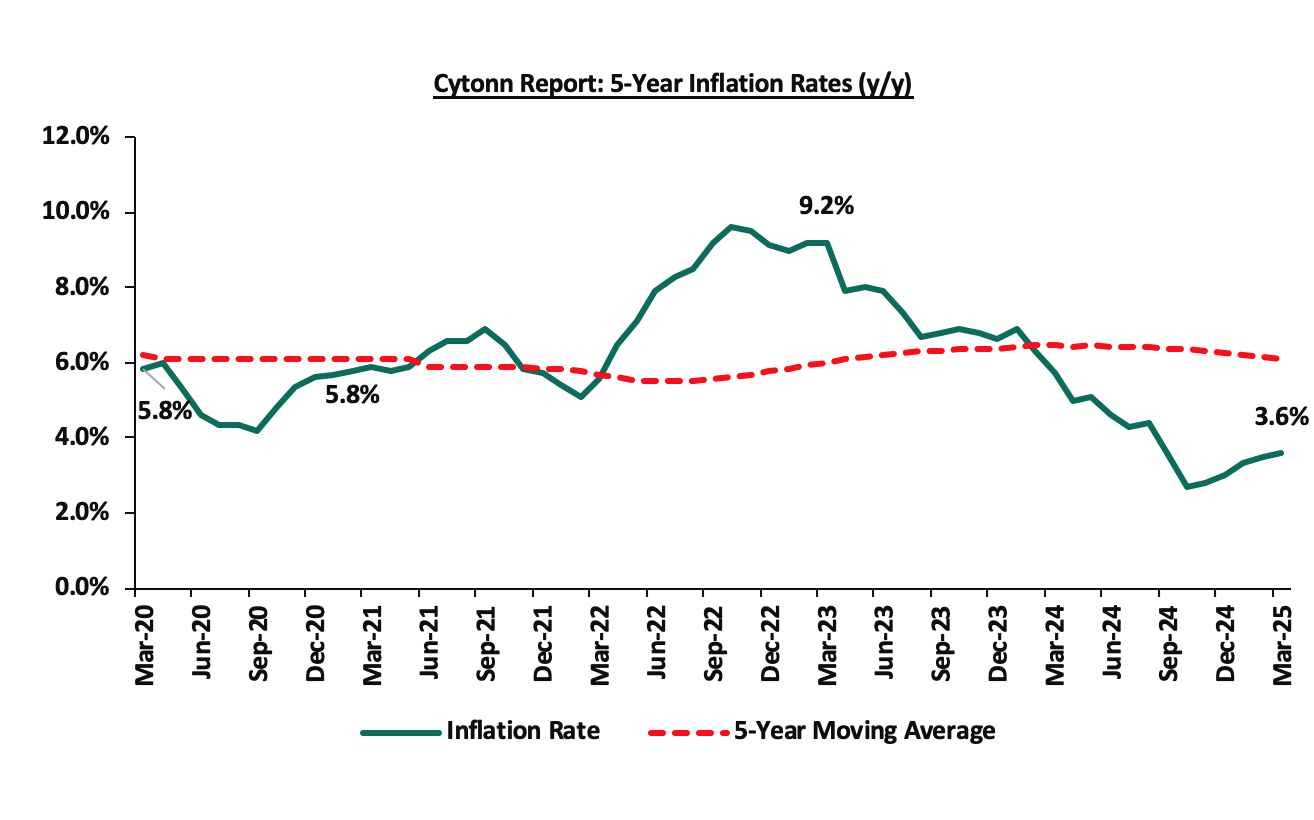
The average inflation rate decreased to 3.5% in Q1’2025, compared to 6.3% in Q1’2024, attributable to a stronger Shilling, and stabilized fuel prices. Notably, the maximum allowed price for Super Petrol and Diesel in March remained unchanged at Kshs 176.6 and Kshs 167.1 respectively from the prices announced for the month of February. Inflation for the month of March 2025 increased to 3.6%, from 3.5% recorded in February 2025, mainly driven by a 0.7% increase in the Food & Non-Alcoholic Beverages category. Below is a chart showing the inflation trend for the last five years:
Over the last 21 months, Kenya’s inflation has persistently remained within the Central Bank of Kenya (CBK) target range of 2.5% - 7.5%, owing to a stronger Shilling and reduced fuel prices. However, risks still persist, particularly due to the high fuel prices and an increasingly accommodative monetary policy, with the MPC on 5th February 2025, cutting the CBR rate by 50 bps to 10.75% from 11.25%. In their meeting this month, we expect further cuts that would increase the money supply and, therefore, may drive inflation upwards.
Going forward, we expect the inflationary pressures to remain within the CBK’s preferred target, mainly on the back of a stable Shilling, and stable fuel prices. However, the loosening monetary policy, the still elevated, though stabilized fuel prices, and the increasing electricity prices remain a risk for the inflation rate.
March 2025 Inflation
The y/y inflation in March 2025 increased slightly by 0.1% points to 3.6%, from the 3.5% recorded in February 2025. This was in line with our projected range of 3.6% to 3.8%, where our decision was mainly driven by the easing in the Central Bank Rate (CBR) to 10.75% in February 2025, slight depreciation of the Kenya Shilling against the US Dollar and increased electricity prices in March 2025. The headline inflation in March 2025 was majorly driven by increases in prices of commodities in the following categories; Food & Non-Alcoholic Beverages, and Transport sector which grew by by 6.6% and 1.5% respectively. However, the commodity prices in Housing, Water, Electricity, Gas & other fuels declined by 0.8%.
|
Cytonn Report: Major Inflation Changes – March 2025 |
|||
|
Broad Commodity Group |
Price change m/m (March-2025/ February -2025) |
Price change y/y (March-2025/March-2024) |
Reason |
|
Food and non-alcoholic beverages |
0.7% |
6.6% |
The m/m increase was mainly driven by the increase in prices of commodities such as kales, Irish potatoes and maize grain (loose) by 6.2%, 4.5% and 3.3% respectively. However, the increase was weighed down by decreases in prices of sugar and beans by 0.7% and 0.2% respectively |
|
Transport |
0.2% |
1.5% |
The transport index recorded a slight m/m increase mainly due to a 3.9% increase in local flights prices. Prices of Super Petrol and Diesel remained unchanged at Kshs 176.6 and Kshs 167.1 respectively |
|
Housing, water, electricity, gas and other fuels |
0.2% |
(0.8%) |
The m/m increase was mainly driven by an increase in prices of gas/LPG by 0.2% coupled with an increase in prices of 50kWh electricity and 200kWh electricity by 1.0% and 0.9% respectively. |
|
Overall Inflation |
0.4% |
3.6% |
The m/m increase was mainly attributable to the 0.7% increase in food and non-alcoholic beverages. |
Notably, March’s overall headline inflation increased slightly for the fifth consecutive month, remaining within the CBK’s preferred range of 2.5%-7.5% for the twenty first consecutive month. The increase in headline inflation in March 2025 comes amid the maximum allowed price for Super Petrol and Diesel remaining unchanged at Kshs 176.6 and Kshs 167.1 respectively. Despite fuel prices remaining unchanged, prices are still high, resulting in high production costs and high costs of goods and services. Additionally, the reduction in the CBR to 10.75% from 11.25% is likely to increase the money supply through lower borrowing costs, which may cause a slight rise in inflation rates as the effects of the CBR gradually take hold in the broader economy. The Kenya Shilling also recorded a 4.7 bps year-to-date appreciation to Kshs 129.2, from the Kshs 129.3 recorded at the beginning of the year. This stabilization in the exchange rate and fuel prices is however expected to continue anchoring inflationary pressures in the country remaining within the CBK’s preferred range of 2.5%-7.5%. The chart below shows the inflation rates for the past 5 years:
Going forward, we expect inflation to remain within the CBK’s preferred range of 2.5%-7.5%, mainly on the back of a stable currency and stable fuel prices. Additionally, favourable weather conditions will also contribute to stabilizing food prices, further supporting stable inflation rates. The risk, however, lies in the fuel prices which despite their stability, still remain elevated compared to historical levels. Additionally, the Monetary Policy Committee cut the Central Bank Rate by 50.0 bps to 10.75% from 11.25% in its February 2025 meeting, with the aim of easing the monetary policy, while maintaining exchange rate stability, and will meet again in April 8th 2025. This cut in the Central Bank Rate is likely to elevate inflationary pressures gradually as consumer spending rises leading to demand- pull inflation. The committee is expected to lower rates further, though gradually, to provide further support for the economy.
The Kenyan Shilling:
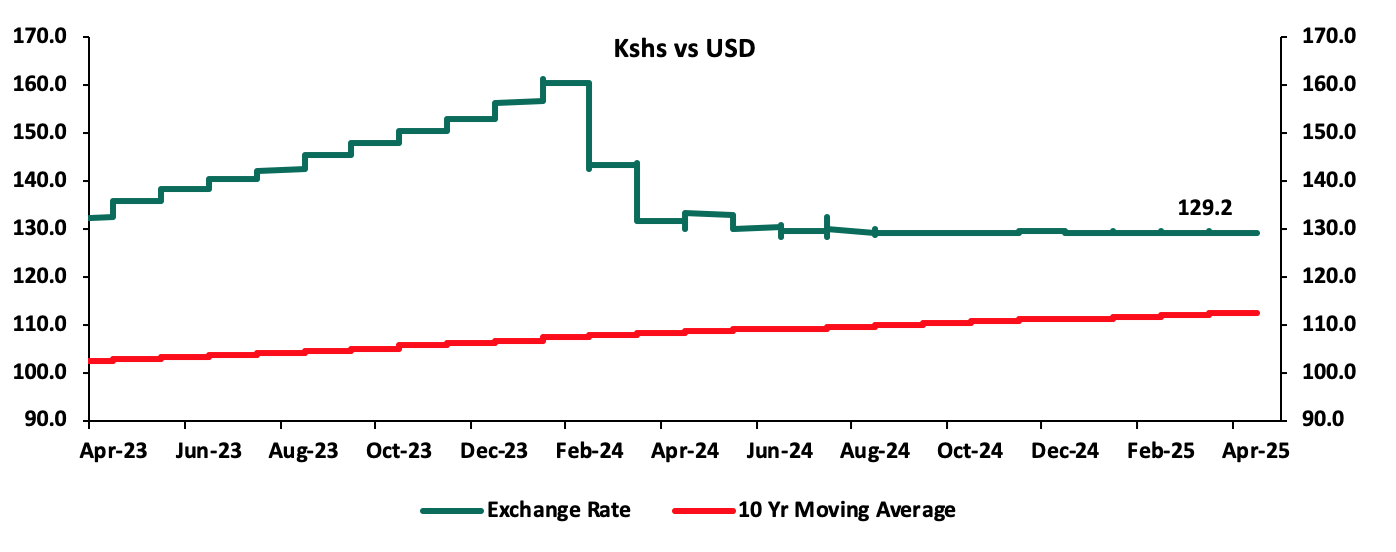
The Kenyan Shilling remained stable during the quarter, depreciating slightly against the US Dollar by 1.8 bps in Q1’2025, to close at Kshs 129.3, relatively unchanged from end of FY’2024, possibly attributable to reduced foreign inflows during the quarter as a result of the lower interest rates following the Monetary Policy Committee decision to cut the Central Bank Rate (CBR) to 10.75%, and higher liquidity increasing money supply of the local currency relative to the dollar. During the week, the Kenya Shilling appreciated against the US Dollar by 5.5 bps to Kshs 129.2 from the Kshs 129.3 recorded the previous week.
We expect the shilling to be supported by:
- Diaspora remittances standing at a cumulative USD 4,956.5 mn in the twelve months to February 2025, 14.5% higher than the USD 4,329.7 mn recorded over the same period in 2024. These has continued to cushion the shilling against further depreciation. In the February 2025 diaspora remittances figures, North America remained the largest source of remittances to Kenya accounting for 53.0% in the period,
- The tourism inflow receipts which came in at Kshs 452.2 bn in 2024, a 19.8% increase from Kshs 377.5 bn inflow receipts recorded in 2023, and owing to tourist arrivals that improved by 14.6% to 2,394,376 in 2024 from 2,089,259 in 2023, and,
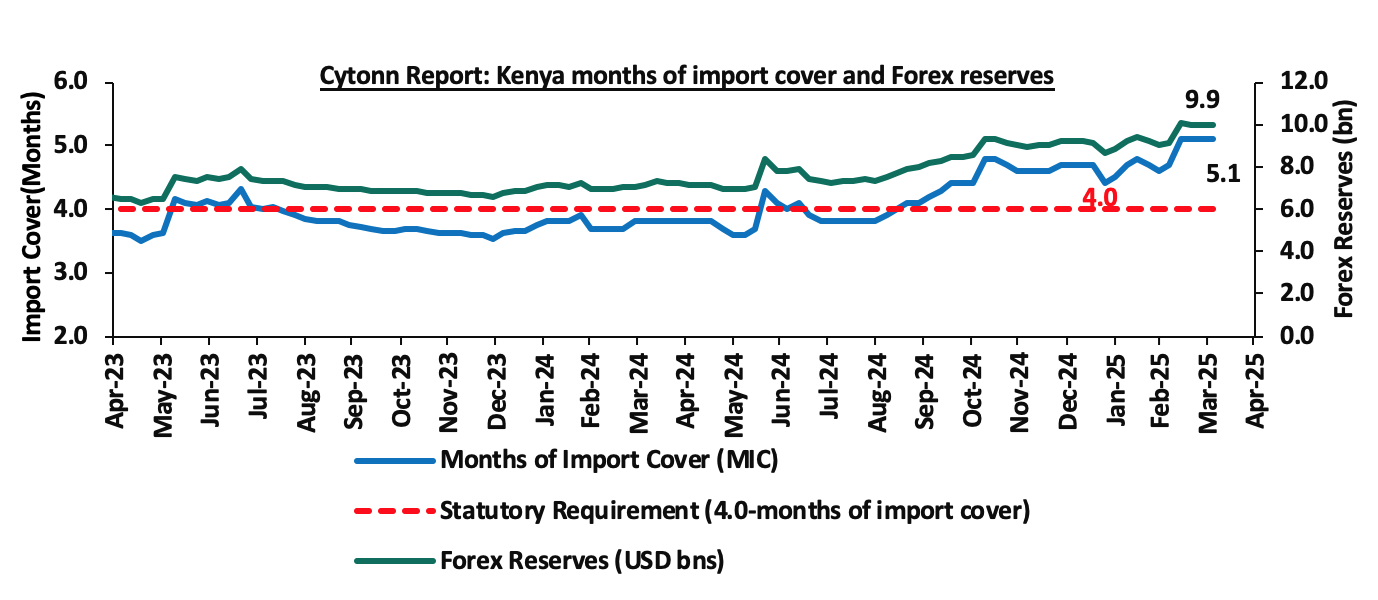
- Improved forex reserves currently at USD 9.9 bn (equivalent to 5.1-months of import cover), which is above the statutory requirement of maintaining at least 4.0-months of import cover and above the EAC region’s convergence criteria of 4.5-months of import cover.
The shilling is however expected to remain under pressure in 2025 as a result of:
- An ever-present current account deficit which came at 4.0% of GDP in Q3’2024, and,
- The need for government debt servicing, continues to put pressure on forex reserves given that 62.1% of Kenya’s external debt is US Dollar-denominated as of September 2024.
Key to note, during the quarter, Kenya’s forex reserves increased by 8.2% to close at USD 10.0 bn from the USD 9.2 recorded at the start of the quarter. The chart below summarizes the evolution of Kenya's months of import cover over the years:
Monetary Policy:
The Monetary Policy Committee (MPC) met once in Q1’2025, where the Central Bank Rate was cut by 50 bps to 10.75% from the 11.25% , noting that its previous interventions had successfully stabilized exchange rate pressures, and anchored inflation with inflation coming at 3.3%, 3.5 and 3.6% in January, February and March 2025 respectively, remaining within and below the mid-point of the CBK target range of 2.5%-7.5%. Below are some of the key highlights from the February 2025 meeting:
- The overall inflation increased marginally by 0.3% points to 3.3% in January 2025, from 3.0% in December 2024, positioning it below the mid-point of the preferred CBK range of 2.5%-7.5%. Core inflation decreased to 2.0% in January 2025, from 2.2% in December 2024, reflecting subdued demand pressures in the economy. This decline was largely attributed to lower prices of processed food items, particularly sugar, maize, and wheat products. Conversely, non-core inflation increased to 7.1% in January 2025, from 5.2% in December 2024, driven by higher prices of food crops, especially vegetables, due to seasonal factors. Lower energy and utilities costs, including reduced electricity and fuel prices, continued to help moderate non-core inflation. Overall inflation is expected to stay below the mid-point of the target range in the near term, supported by low and stable core inflation, an anticipated reduction in energy prices, and a stable exchange rate.
- In January 2025, the Kenya National Bureau of Statistics (KNBS) and the Central Bank of Kenya (CBK) jointly introduced core and non-core inflation figures in Kenya. Core inflation excludes items with highly volatile or transient prices from the overall Consumer Price Index (CPI), offering a clearer view of underlying inflation trends. Alongside overall inflation, CBK will now monitor core and non-core inflation numbers, aligning with global best practices of inflation-targeting central banks. This initiative also adheres to the East African Community (EAC) guidelines for harmonized CPI computation. The core CPI basket includes 275 items, representing 81.1% of the overall CPI weight, making it a more accurate tool for tracking inflation trends, closely aligned with overall inflation.
- The recently released Quarterly Gross Domestic Product Report, for Q3’2024 showed a slowdown in the performance of the Kenyan economy, with real GDP growing by 4.0%, slower than the 6.0% recorded a similar period in 2023. This was attributable to deceleration in growth in most sectors of the economy, particularly agriculture and forestry, real estate, financial and insurance, information and communication, and transport and storage. The economy is expected to continue to strengthen in 2025 with real GDP growth projected to come in at 5.4%, from the 4.6% growth projected for 2024. The growth is supported by resilient services sector, expected recovery in growth of credit to the private sector, sustained performance in agriculture, and enhanced exports. However, this positive outlook is tempered by potential risks, including geopolitical tensions.
- Goods exports increased by 15.4% in the 12 months to December 2024, compared to 2023, reflecting a rise in exports of agricultural commodities and re-exports. Goods imports rose by 9.9% reflecting increases in intermediate and capital goods imports. The current account deficit as at December 2024 is estimated at 3.7% of GDP, down from 4.0% in 2023, driven by stronger goods exports, robust diaspora remittance inflows, and reduced oil imports. In 2024, diaspora remittances rose by 18.0% totalling to USD 4,945.0 from USD 4,190.0 in 2023 and tourist arrivals in 2024 increased by 14.6%. The current account deficit was fully financed by capital and financial inflows, leading to an overall balance of payments surplus of USD 1,466.0 mn. This surplus, combined with IMF disbursements, resulted in a USD 2,749.0 mn build-up in gross reserves. For 2025, the current account deficit is projected at 3.8% of GDP and is expected to be fully financed by capital and financial inflows, yielding a balance of payments surplus of USD 591.0 mn and an increase in gross reserves of USD 1,451.0 mn.
- The CBK foreign exchange reserves, which currently stand at USD 9, 219.0 and representing 4.7 months of import cover, continue to provide adequate cover and a buffer against any short-term shocks in the foreign exchange market,
- The banking sector remains stable and resilient, with strong liquidity and capital adequacy ratios. The ratio of gross non-performing loans (NPLs) to gross loans decreased to 16.4% in December 2024 compared to 16.5% in October 2024. Decreases in NPLs were noted in the manufacturing, trade, building and construction, real estate and energy and water sectors. Banks have continued to make adequate provisions for the NPLs,
- The CEOs Survey and Market Perceptions Survey conducted ahead of the MPC meeting revealed an improved optimism about business activity and economic growth prospects for the next 12 months. The optimism was attributed to the stable macroeconomic environment reflected in the low inflation rate and stability in the exchange rate, expectations of a decline in interest rates, favorable weather conditions supporting agriculture, resilience of the services sector, and improved global growth prospects. Nevertheless, respondents expressed concerns about high cost of doing business and subdued consumer demand,
- The Survey of the Agriculture Sector for January 2025 revealed an expectation for moderate upward pressure on overall headline inflation in the next three months, on account of higher vegetables and cereals prices attributed to seasonal factors. Nevertheless, respondents expressed that stability in pump prices and exchange rate are expected to moderate inflation,
- Global growth is expected to continue to recover and is projected at 3.3% in 2025 from an estimate of 3.2% in 2024, attributable to strong growth in the United States, strong growth in some large emerging market economies such as India, and improved growth prospects in the United Kingdom. The main risk to the global growth outlook relates to an elevated uncertainty on trade policy amid rising tariffs on imports and further escalation of geopolitical tensions particularly the conflict in the Middle East and the Russia-Ukraine war
- Global headline inflation has eased; however, the rate of decline has slowed in major economies due to persistent core inflation. Central banks in these economies have continued to reduce interest rates, though at varying speeds based on their inflation and growth projections. While international oil prices have moderated, the risk of volatility remains high, fuelled by rising import tariffs and ongoing geopolitical tensions. Meanwhile, food inflation has risen, primarily due to higher edible oil prices.
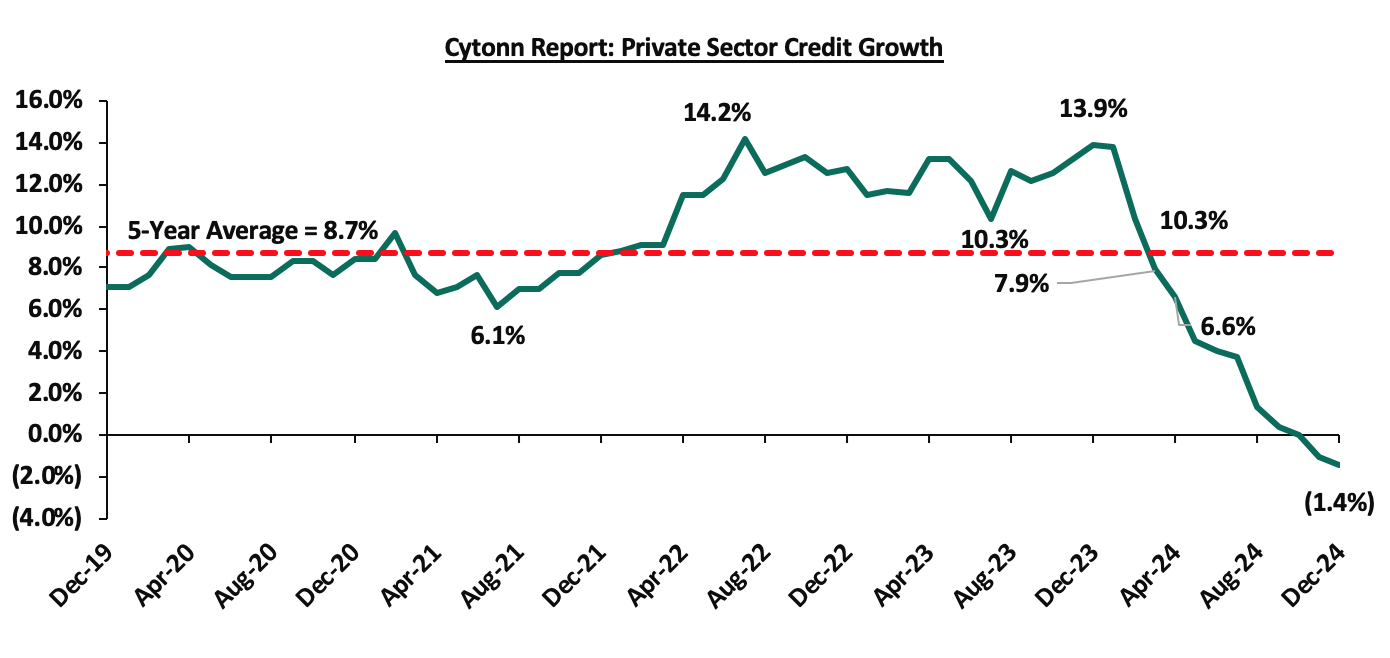
- Growth in private sector credit contracted by 1.4% in December 2024 compared to the previous year, mainly attributed to exchange rate valuation effects on foreign currency-denominated loans due to the appreciation of the Shilling and reduced demand attributable to high lending interest rates. In December, local currency loans stood at 2.1%, while foreign currency loans, which make up around 26.0% of total loans, decreased by 11.4%. The chart below shows the movement of the private sector credit growth over the last five years:
- The Committee acknowledged the ongoing implementation of the FY’2024/25 Supplementary Budget I. These measures are anticipated to further support fiscal consolidation, reducing the fiscal deficit to 4.3% of GDP in FY’2024/25, from 5.3% of GDP in FY’2023/24. The fiscal consolidation in the medium-term should reduce debt vulnerabilities while moving the present-value-of-debt to GDP ratio towards the target anchor of 55.0%.
The MPC noted that overall inflation is expected to stay below the midpoint of the target range of 2.5%–7.5% in the near term. This outlook is supported by stable core inflation, low energy prices, and a stable exchange rate which is largely attributed to its earlier tight monetary policy stance. As a result, the MPC has shifted to a more accommodative monetary policy, reducing the Central Bank Rate (CBR) by a cumulative 225 bps to 10.75% by February 2025 from 13.0% in June 2024. Additionally, central banks in major economies have continued to lower interest rates at varying paces. The Committee also noted that economic growth slowed in 2024, creating room for further easing of monetary policy to support economic activity while maintaining exchange rate stability. The MPC stated that the CRR reduction would release additional liquidity to banks, which is expected to reduce the cost of funds, lower lending rates, and boost private sector credit growth. The Committee observed that despite significant reductions in the CBR since the August 2024 meeting, lending rates have only marginally declined. It emphasized that banks must take further action to reduce lending rates to stimulate private sector credit growth and support economic activity. To ensure compliance with the Risk-Based Credit Pricing Model (RBCPM), the CBK decided to initiate on-site inspections of banks to verify their alignment with the RBCPM in reducing interest rates. Recent amendments to the Banking Act empower the CBK to penalize any bank that fails to pass on the reduced cost of funds to borrowers. The MPC noted that it will continue to monitor the effects of these policy measures, as well as global and domestic economic developments, and will remain ready to take additional action if necessary. The next MPC meeting is scheduled for April 2025.
Fiscal Policy:
The execution of the FY’2024/25 budget has been largely smooth, despite facing challenges in July and August 2024 due to demonstrations that disrupted economic activities. These disruptions led to a decline in revenue collection, increased debt servicing costs, and the need to address outstanding expenditure carryovers from FY’2023/24, as well as pending bills. Additionally, there have been rising expenditure pressures driven by increased demand for additional resources and as a result, the National Treasury presented the Supplementary Estimates II for the Fiscal Year 2024/25 to the National Assembly.
The table below summarizes the overall change in the FY’2024/25 budget estimates.
|
Cytonn Report: FY’2024/25 Supplementary Budget Estimates II (Kshs bn) |
|||||
|
Item |
Original Approved Estimates FY’2024/25 (a) |
Supplementary Estimates I FY’2024/25 (b) |
Supplementary Estimates II FY’2024/25 (c) |
% Change (c/a) |
% Change (c/b) |
|
Recurrent Expenditure |
1,632.1 |
1,591.6 |
1,728.6 |
5.9% |
8.6% |
|
Development Expenditure |
746.3 |
641.2 |
590.1 |
(20.9%) |
(8.0%) |
|
Ministerial National Government Expenditure |
2,378.4 |
2,232.8 |
2,318.6 |
(2.5%) |
3.8% |
|
Consolidated Fund Services |
1,213.5 |
1,237.2 |
1,242.7 |
2.4% |
0.4% |
|
County Equitable Allocation |
400.1 |
411.0 |
418.3 |
4.5% |
1.8% |
|
Total Expenditure |
3,992.0 |
3,880.9 |
3,979.6 |
(0.3%) |
2.5% |
Source: The National Treasury
Key take outs from the table include;
- The recurrent expenditure (Costs incurred to cover regular government expenses such as salaries, operational costs and maintenance costs) increased by 8.6% to Kshs 1,728.6 bn in the Supplementary Estimates II from Kshs 1,591.6 bn in the Supplementary Estimates I, and by 8.6% from Kshs 1,632.1 bn in the original estimates, an indication of the government's initiative to increase expenditure allocation to boost public services, responding to economic growth and ensuring the well-being of its citizens,
- Development expenditure (Costs incurred in order to create assets that will provide long term public infrastructure such as roads, hospitals, and schools) declined by 8.0% to Kshs 590.1 bn in the Supplementary Estimates II from Kshs 641.2 bn in the Supplementary Estimates I, and by 20.8%% from Kshs 746.3 bn in the original estimates a detriment to the sectors such as infrastructure, energy, water and health that require heavy development financing,
- The Ministerial National Government expenditure estimates for the FY’2024/25 Supplementary Budget II is set to increase by 3.8% to Kshs 2,318.6 bn from Kshs 2,232.8 bn Supplementary Budget I translating to an increase of Kshs 85.9 bn in expenses for the government. This increase is mainly due to the increasing expenditure in various sectors and public services,
- Consolidated Fund Services (CFS) (refers to the Consolidated Fund established in the Kenya’s constitution into which development partners deposit funds before disbursing to the Exchequer accounts for projects such as servicing of public debt, and subscription to International Organizations) has increased by 0.4% to Kshs 1,242.7 bn from Kshs 1,237.2 bn in the Supplementary Budget I and further by 4.5% from Kshs 1,213.5 in the original estimates, and,
- The County Equitable Share (allocation on national government revenue to county governments) increased by 1.8% to Kshs 418.3bn from Kshs 411.0 bn in the Supplementary Estimates I.
Notably, for the FY’2024/2025, from the figures released by the National Treasury for revenue and net expenditures collected as at the end of February 2025, total revenue collected amounted to Kshs 1,403.7 bn, equivalent to 56.7% of the revised estimates of Kshs 2,475.1 bn for FY’2024/2025 and is 85.1% of the prorated estimates of Kshs 1,650.0 bn. The total expenditure amounted to Kshs 2,316.1 bn, equivalent to 55.0% of the revised estimates of Kshs 4,207.9 bn, and is 82.6% of the prorated target expenditure estimates of Kshs 2,805.3 bn.
Going forward, we believe that the coming months’ revenue collection performance will largely depend on how quickly the country’s business climate stabilizes. We therefore expect the government to cut on its expenditure, mostly the development expenditure in order to finance the growing debt maturities and the ballooning recurrent expenditure.


