In July 2023, we published the Kenya Retail Report 2023, themed “Retail Expansion with Focus into Untapped Markets,” where we highlighted the progress and performance of the retail sector. The sector remained stable, with the average rental yield coming in at 7.5%, 0.7% points increase from 6.8% recorded in 2022. Additionally, the average rent per SQFT increased by 7.1% to Kshs 130 in 2023 from Kshs 122 in 2022. The average occupancy rate increased by 2.1% points, reaching 79.4% in 2023 compared to 77.3% in 2022. This increase was mainly driven by the rapid expansion of both local and foreign retailers, such as Simbisa brands, Carrefour, Naivas, and Quickmatt.
This week, we update our Kenya Retail Report 2023 with the Kenya Retail Report 2024 themed “Resilient and Evolving Retail Landscape ” in which we discuss the progress and performance of the Kenyan retail sector. This will be based on research conducted across nine nodes in the Nairobi Metropolitan Area (NMA), as well as in key urban centres in Kenya such as Kisumu, Nakuru, Mombasa, Eldoret, and the Mount Kenya Region. Based on this, we shall identify the market performance in terms of rents, occupancy rates, and rental yields, while updating on the key factors in the markets driving their performance. Therefore, we shall cover the topical as follows;
- Overview of the Kenya Retail Sector in 2024,
- Kenya Retail Sector Performance Summary in 2024,
- Retail Space Demand Analysis,
- Retail Space Investment Opportunity, and,
- Retail Sector Outlook.
Section I: Overview of the Kenya Retail Sector in 2024
In 2024, Kenya's retail sector experienced significant developments as major retailers implemented their expansion strategies. Among these, Naivas opened five branches, focusing on Nairobi with stores along the busy Thika Super Highway and Langata Road, targeting vehicular traffic on those routes. Quick Mart opened its 60th store in Narok town, aiming to cement its footprint in the county, while Carrefour launched its 23rd store in GTC Mall Westlands. New entrants also pursued their expansion strategies. For instance, international retailer China Square opened a new outlet in Langata, occupying the space previously held by local retailer Uchumi Supermarkets. Jaza Store opened two new branches in the Chokaa and Gachie areas. Additionally, global retailer Panda Mart opened its first outlet in the country, located in Garden City Mall, with plans to expand to other areas with heavy vehicular traffic.
The table below shows a summary of the number of stores of the key local and international retailer supermarket chains in Kenya;
|
Cytonn Report: Main Local and International Retail Supermarket Chains |
|||||||||||
|
# |
Name of retailer |
Category |
Branches as at FY’2018 |
Branches as at FY’2019 |
Branches as at FY’2020 |
Branches as at FY’2021 |
Branches as at FY’2022 |
Branches as at FY’2023 |
Branches opened in FY’2024 |
Closed Branches |
Current Branches |
|
1 |
Naivas |
Hybrid* |
46 |
61 |
69 |
79 |
91 |
100 |
5 |
0 |
105 |
|
2 |
Quick Mart |
Hybrid** |
10 |
29 |
37 |
48 |
55 |
59 |
1 |
0 |
60 |
|
3 |
Chandarana |
Local |
14 |
19 |
20 |
23 |
26 |
26 |
0 |
0 |
26 |
|
4 |
Carrefour |
International |
6 |
7 |
9 |
16 |
19 |
22 |
1 |
0 |
23 |
|
5 |
Cleanshelf |
Local |
9 |
10 |
11 |
12 |
12 |
13 |
0 |
0 |
13 |
|
6 |
Jaza Stores |
Local |
0 |
0 |
0 |
0 |
0 |
4 |
2 |
0 |
6 |
|
7 |
Tuskys |
Local |
53 |
64 |
64 |
6 |
6 |
5 |
0 |
59 |
5 |
|
8 |
China Square |
International |
0 |
0 |
0 |
0 |
0 |
2 |
1 |
0 |
3 |
|
9 |
Uchumi |
Local |
37 |
37 |
37 |
2 |
2 |
2 |
0 |
35 |
2 |
|
10 |
Panda Mart |
International |
0 |
0 |
0 |
0 |
0 |
0 |
1 |
0 |
1 |
|
11 |
Game Stores |
International |
2 |
2 |
3 |
3 |
0 |
0 |
0 |
3 |
0 |
|
12 |
Choppies |
International |
13 |
15 |
15 |
0 |
0 |
0 |
0 |
15 |
0 |
|
13 |
Shoprite |
International |
2 |
4 |
4 |
0 |
0 |
0 |
0 |
4 |
0 |
|
14 |
Nakumatt |
Local |
65 |
65 |
65 |
0 |
0 |
0 |
0 |
65 |
0 |
|
|
Total |
|
257 |
313 |
334 |
189 |
211 |
233 |
10 |
181 |
244 |
|
*51% owned by IBL Group (Mauritius), Proparco (France), and DEG (Germany), while 49% owned by Gakiwawa Family (Kenya) |
|||||||||||
|
**More than 50% owned by Adenia Partners (Mauritius), while Less than 50% owned by Kinuthia Family (Kenya) |
|||||||||||
Source: Cytonn Research
Other franchises that have embarked on expansion in Kenya include;
- Bata, retailer and shoe manufacturer, opened a branch in the iconic Hilton in April 2024, and announced plans to open 10 new stores before the end of the year. Additionally, Bata announced that it is set to refurbish 85 of its stores in a bid to consolidate its market share in the country. Bata is set to open its stores in major urban and peri-urban areas,
- Java House, an international restaurant chain, who also owns 360 Degrees Artisan Pizza, Kukito, and Planet Yogurt food chains, opened a new outlet located at Voi, Taita Tavet County as it seeks to expand outside Nairobi. The new Java Express restaurant is set to cater to both tourists visiting the county and the residents of the bustling transit town of Voi, and,
- Mugg and Bean, a restaurant under South African-based Famous Brands opened a new outlet at Total Two Rivers. This comes as the Kenyan retail market is experiencing growth driven by the food and beverage sector as local and international retails roll out their expansion agendas.
In addition, there are various upcoming retail developments in the pipeline such as the Cove and Kilimani Retail Mall. Growth in the sector is supported by the following factors;
- Expansion Strategy by Food and Beverage Brands - Local and international brands are actively expanding their operations to strengthen their presence in the country, which in turn is driving the demand for retail spaces. This expansion is seen in the opening of new stores and outlets across various regions, contributing significantly to the growth of the retail sector and the development of the retail segment,
- Continued recognition of Nairobi as a major Investment hub - In the retail landscape, Nairobi continues to be an ideal hub for investments, a factor that has attracted major retail brands to establish and expand their presence in the city. Its strategic location, robust infrastructure, and growing consumer market make it a prime destination for both local and international retailers,
- Urbanization which has opened up other areas for retail investment -The prevailing urbanization in the country has opened up new areas for retail investment, including Eldoret, Nanyuki, Kiambu, Thika, and Kajiado, in addition to the traditional hubs of Nairobi, Mombasa, and Kisumu. Investors are now exploring these emerging areas for investment,
- A growing middle class – The country has witnessed a growing middle class with a strong desire for quality products. This demographic shift is driving increased consumption, thereby fueling the growth of the retail market. Investors are keen to capitalize on this trend by aligning their strategies to meet the needs and preferences of this burgeoning middle class.
- Improved Accessibility – Various infrastructural development projects in the country such as railway projects, road have has pushed growth in the retail segment as in the country facilitating strategic expansion,
- Positive National Demographics - The demand for goods and services has been steadily rising due to Kenya’s relatively high urbanization and population growth rates of 7% p.a and 2.0% p.a, respectively, against the global average of 1.7% p.a and 0.9% p.a, respectively as at 2023,
- Private Equity – Investors are actively seeking profitable entities within the retail sector, driving significant growth and development in this industry. This influx of capital has enabled retailers to enhance their product offerings, improve customer service, and expand their market reach, contributing to a dynamic and rapidly evolving retail landscape,
- Presence of Gaps in the Market - Retailers including Naivas, QuickMart, Panda Mart, China Square, and Carrefour have been aggressively expanding to occupy new and previously vacated spaces left by struggling chains like Uchumi, The Game, Tuskys, and Nakumatt. This expansion is happening as Kenya's formal retail penetration remains relatively low, at around 35.0% as at 2021, according to the Oxford Business Group, and,
- Better Ease in Doing Business - The ease of doing business in Kenya has significantly improved, leading to enhanced investor confidence. According to the World Bank, Kenya's ranking in terms of ease of doing business was 56 in 2020 with a 2.2% improvement in score to 73.2 in 2020 from 71.0 in 2019, a notable improvement compared to its position at 113 six years prior. The graph below shows Kenya’s ranking performance between 2015 and 2020;
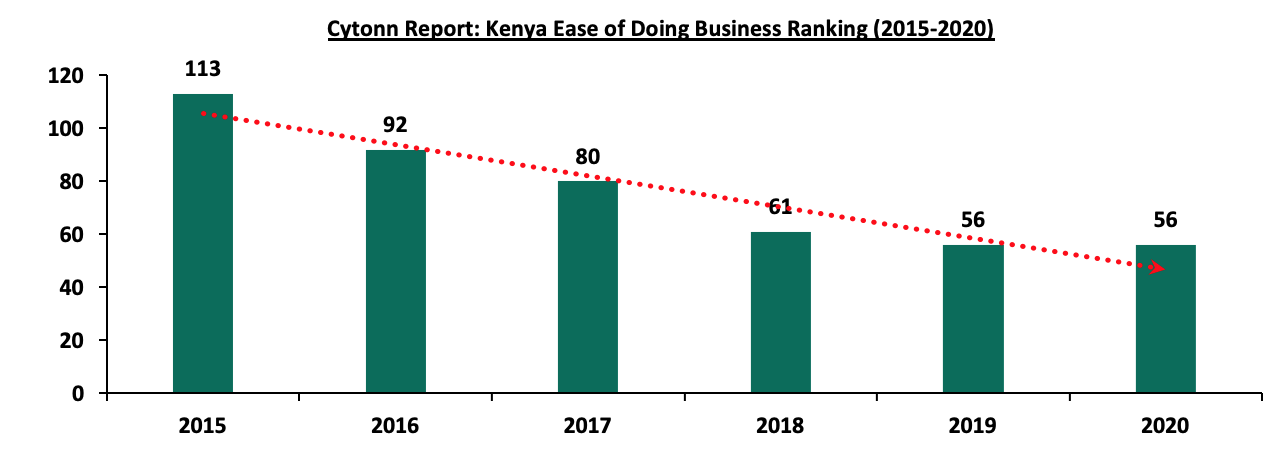
Source: World Bank
Despite the above factors driving the growth of the retail market, various challenges continue to impede the overall performance of the sector which include;
- Rising Construction Costs – Construction costs have been steadily increasing. According to a report by Integrum, the cost of construction in 2024 has risen to between Kshs 48,750 and Kshs 122,860 per SQM, making it 17.6% more expensive to construct in 2024. This increase is due to the prevailing tight macro-economic environment,
- Diminishing Purchasing Power – Shoppers in Kenya are experiencing a diminishing purchasing power due to a tough economic period, despite the easing of some indicators such as inflation and a consistent drop in fuel costs. Many Kenyans are struggling with increased taxation, particularly those who are formally employed, and persistently high levels of unemployment,
- Constrained Access to Development Financing – Due to rising Non-Performing Loans (NPLs), evidenced by a year-on-year (y/y) increase in gross loans advanced to the Real Estate sector by 8.6% to Kshs 507.0 bn in Q3’2023 from Kshs 467.0 bn in Q3’2022, creditors have tightened their lending measures, and,
- Oversupply of Space - There exists an oversupply of physical space, with approximately 3.6 mn SQFT in the NMA retail market, with the rest of the Kenyan retail market having an oversupply of approximately 1.9 mn SQFT, causing slowed uptake of retail spaces in the sector, and thereby leading developers to halt their plans awaiting the absorption of the existing spaces.
Section II: Kenya Retail Sector Performance Summary in 2024
Our research context delves into the performance of the retail market in the Nairobi Metropolitan Area (NMA) and key urban cities in Kenya. The Kenyan retail sector displayed a stable overall performance, with the average rental yield coming in at 7.6% in 2024, 0.1% points increase from 7.5% recorded in 2023. Notably, the average rent per SQFT increased by 2.6% to Kshs 133 in 2024 from Kshs 130 in 2023, owing to; i) the high inflation levels that prevailed in the country during the last quarter of 2023 compelled landlords to revise rental charges to hedge against inflation, and ii) the addition of high-end retail spaces. Additionally, the average occupancy rate increased by 1.6% points, reaching 81.0% in 2024 compared to 79.4% in 2023. This can be linked to the expansion drives by local and international retailers such as Naivas, China Square, Carrefour, and Panda Mart, among others. Additionally, the expansion of these retailers into spaces previously occupied by struggling stores such as Uchumi Supermarkets, Nakumatt, and Tuskys has significantly improved mall occupancy rates and contributed to the overall resilience of the retail market.
- Retail Sector Performance in Kenya Over Time
In the last three years, the Kenyan retail sector has been on an upward trajectory with stable returns and showing a recovery post COVID-19 era, with the rental rate increasing steadily to Kshs 130 in 2024 from Kshs 115 in 2020.
The Kenyan retail sector has remained stable over time, showing resilience in performance regarding rental yields, with the average rent per SQFT showing promising signs of rebounding to pre-COVID-19 levels of above Kshs 130 per SQFT. However, it is important to note that the sector has experienced a negative Compounded Annual Growth Rate (CAGR) of 1.9% over the past eight years, dropping to Kshs 133 per SQFT in 2023 from Kshs 155 in 2016. This decline can be attributed to the rising supply of retail spaces, which has led landlords to offer rent discounts to attract and retain tenants while managing the excess space. The situation was further worsened during the active two-year period of the COVID-19 pandemic, as well as the 2017 and 2022 election periods The average occupancy rate also declined by 1.9% points to 81.0% in 2024, from 82.9% that was recorded in 2016. This decline is mainly due to the departure of both local and international retailers, including Nakumatt, Tuskys, Uchumi, The Game, Shoprite, Choppies, and others, who previously occupied large spaces. Furthermore, the addition of new malls and convenience centers during this period has worsened the oversupply of retail spaces in the sector, further affecting the overall absorption rate.
The performance of the sector across the key cities is as summarized below;
|
All Values in Kshs Unless Stated Otherwise |
||||||||||
|
Cytonn Report: Kenya’s Retail Performance Summary-2024 |
||||||||||
|
Item |
2016 |
2017 |
2018 |
2019 |
2020 |
2021 |
2022 |
2023 |
2024 |
∆ Y/Y 2022/2023 |
|
Asking rents (Kshs/SQFT) |
155 |
141 |
132 |
118 |
115 |
118 |
122 |
130 |
133 |
2.6% |
|
Average Occupancy (%) |
82.9% |
80.2% |
86.0% |
77.3% |
76.6% |
78.4% |
77.3% |
79.4% |
81.0% |
1.6% |
|
Average Rental Yields |
8.7% |
8.3% |
8.6% |
7.0% |
6.7% |
6.8% |
6.8% |
7.5% |
7.6% |
0.1% |
Source: Cytonn Research
- Nairobi Metropolitan Area (NMA) Retail Market Performance
The NMA retail market recorded an average rental yield of 7.9% in 2024, 0.2%- points higher than the 8.2% that was recorded in 2023. The performance was driven by; i) a 4.7% increase in average rental charges to Kshs 185 per SQFT in 2024 from Kshs 177 per SQFT in 2023, and, ii) 0.2%% points improvement in average occupancy rates which came in at 79.5% in 2023, from 79.2% in 2023.
- Performance by Nodes
Kilimani, Karen, and Kiambu Road & Limuru Road displayed impressive average rental yields of 9.7%, 9.3%, and 9.0%, respectively, surpassing the overall market average of 7.9%. This robust performance was primarily driven by the increased demand for retail offerings in these locations, the presence of premium retail spaces commanding higher rents, and the provision of quality infrastructure services that enhance attractiveness for both tenants and customers. Conversely, retail spaces in Eastlands reported the lowest average rental yield at 6.4%, influenced by several factors: i) rental rates in Eastlands were significantly below the market average of Kshs 185 per SQFT, standing at Kshs 146 per SQFT due to the prevalence of lower-quality spaces in the region, ii) inadequate infrastructure across most towns within the region, hindering accessibility and sustainability for retail spaces, and, iii) the prevalence of informal retail spaces and service stations, offering competitive rates and diverse amenities, intensified market competition and impacted demand. Despite the lower yields, Eastlands experienced a significant 14.5% increase in rental rates, rising from Kshs 128 in H1’2023, far exceeding the market average growth rate of 4.7%. This surge was driven by the addition of prime high-quality spaces commanding premium rents, such as the Business Bay Square (BBS) Mall. BBS Mall, the largest mall in East and Central Africa, offers 130,000 SQM of modern, high-quality spaces, significantly contributing to the region's retail landscape.
Furthermore, a significant shift in occupancy rates has been observed in Eastlands, with a 2.1% increase compared to the market average of 0.2%. This notable rise is primarily driven by changing consumer preferences and a growing population in these areas, encouraging retailers to expand their presence beyond the city center and explore opportunities in Eastlands. This strategic expansion aims to offer convenience to local residents in the most accessible manner possible. The surge in occupancy rates is supported by rental rates in Eastlands, which are below market averages at Kshs 146, compared to the market average of Kshs 185. This intentional pricing adjustment is a strategic move to attract a broader clientele by offering more affordable options. This strategy is particularly effective given the increased demand for consumer goods, diverse services, and entertainment facilities in these rapidly developing locales.
The table below shows the submarket performance of nodes in the Nairobi Metropolitan Area (NMA):
|
(All values in Kshs unless stated otherwise) |
|||||||||
|
Cytonn Report: Nairobi Metropolitan Area Retail Market Performance H1’2024 |
|||||||||
|
Area |
Rent Kshs/SQFT H1’2024 |
Occupancy% H1’2024 |
Rental Yield H1’2024 |
Rent Kshs/SQFT H1’2023 |
Occupancy% H1’2023 |
Rental Yield H1’2023 |
∆ in Rental Rates |
∆ in Occupancy (% points) |
H1’2024 ∆ in Rental Yield (% points) |
|
Westlands |
239 |
79.4% |
7.1% |
216 |
77.6% |
9.1% |
10.6% |
1.8% |
(2.0%) |
|
Karen |
218 |
84.0% |
9.3% |
217 |
82.4% |
9.7% |
0.8% |
1.6% |
(0.4%) |
|
Kilimani |
198 |
81.2% |
9.7% |
190 |
84.7% |
10.1% |
3.8% |
(3.5%) |
(0.4%) |
|
Ngong Road |
175 |
81.5% |
7.5% |
170 |
81.0% |
7.8% |
2.7% |
0.5% |
(0.4%) |
|
Kiambu road & Limuru Road |
205 |
75.2% |
9.0% |
202 |
74.0% |
8.7% |
1.4% |
1.2% |
0.2% |
|
Thika Road |
187 |
79.3% |
7.4% |
165 |
80.7% |
7.5% |
13.0% |
(1.3%) |
(0.1%) |
|
Eastlands |
146 |
77.7% |
6.4% |
128 |
75.6% |
6.0% |
14.5% |
2.1% |
0.4% |
|
Mombasa road |
169 |
79.6% |
8.2% |
156 |
79.9% |
7.5% |
8.3% |
(0.3%) |
0.6% |
|
Satellite towns |
139 |
79.0% |
6.8% |
138 |
78.8% |
6.8% |
0.9% |
0.2% |
0.0% |
|
Average |
185 |
79.5% |
7.9% |
177 |
79.2% |
8.2% |
4.7% |
0.2% |
(0.2%) |
Source: Cytonn Research
- Performance by Class
The research aims to evaluate the performance of malls within each class and understand the factors contributing to their rental yields and occupancy rates. The analysis focuses on how rental charges, occupancy rates, and rental rates vary within each class compared to the overall market averages. In this research analysis, malls have been categorized into three distinct classes based on their lettable areas. The classifications are as follows:
- Regional Centers / Destination Malls: These malls have larger lettable areas, ranging from 400,000 to 800,000 square feet (SQFT), and typically house multiple anchor tenants. Notable examples include Sarit Centre, Two Rivers Mall, Garden City Mall, Business Bay Square, and Next Gen Mall,
- Community Centers: This category comprises the second largest malls, with lettable areas ranging from 125,001 to 400,000 SQFT, and they too can accommodate more than one anchor tenant. Examples include Thika Road Mall, Valley Arcade, Gateway Mall, the Village Market, and,
- Neighborhood Centers: The smallest of the three classes, these malls have lettable areas of around 20,000 SQFT, allowing them to host only one anchor tenant. Examples include The Well, Ciata City Mall, and Unicity Mall, among others.
In terms of performance by class, destination malls outperformed other classes, achieving an average rental yield of 9.6%. This impressive performance is due to their ability to charge high rental rates, averaging Kshs 305 per SQFT, which is Kshs 120 above the market average of Kshs 185 per SQFT. These malls typically demand premium rents, often in United States Dollars (USD), due to their high-quality spaces, excellent facilities, and the presence of international retailers. Additionally, they attract higher shopper footfall. Their limited supply and high demand from major local and multinational brands further enhance their performance.
Community malls ranked second, with an average rental yield of 8.2%, slightly above the market average of 7.9%. They achieved an average occupancy rate of 81.6% and rental charges of Kshs 184 per SQFT, compared to the market averages of 79.7% and Kshs 185 per SQFT, respectively. This performance is driven by a consistent demand for more affordable retail spaces compared to destination malls in similar regions. The demand is driven by an array of emerging tenants, including fashion designers, food and beverage outlets, beauty product brands, commercial banks aiming to increase convenience, fitness centres, electronic brands, hospitals, and opticians. This diversified tenant mix has boosted the growth and appeal of community malls, making them attractive to both tenants and customers
Neighbourhood malls recorded the lowest average rental yields at 7.2%, which is 0.7% below the market average of 7.9%. This is due to lower average rental rates of Kshs 152 per SQFT, compared to the market average of Kshs 185 per SQFT. Their average occupancy rate was 79.7%, below the market average of 79.7%, reflecting a decline in demand for physical retail spaces in these malls
The summary of performance by class is as shown below:
|
All Values in Kshs unless stated otherwise |
|||
|
Cytonn Report: Retail Market Performance in Nairobi by Class 2024 |
|||
|
Class |
Average of rent (Kshs) |
Average of occupancy rate |
Average of rental yields |
|
Destination |
305 |
76.0% |
9.6% |
|
Community |
184 |
81.6% |
8.2% |
|
Neighbourhood |
152 |
77.8% |
7.2% |
|
Grand Total |
185 |
79.7% |
7.9% |
Source: Cytonn Research
- Retail Market Performance in Key Urban Cities in Kenya
The performance of the key urban centers in Kenya is as summarized below:
Key urban cities in Kenya recorded an increase in average rental yields by 0.1% points, rising to 7.6% in 2024 from 7.5% in 2023. This performance can be attributed to a 1.6 %-points increase in average occupancy, which rose to 81.0% in 2024 from 79.4% in 2023, and a 2.6% growth in average rental rates, which increased to Kshs 133 per SQFT in 2024 from Kshs 130 per sSQFT in 2023.
Nairobi was the best-performing region, with average rental yields at 7.9% in 2024, 0.3% points higher than the market average of 7.6%. This performance can be linked to higher demand for quality retail spaces and the availability of tenants willing to pay premium rent. This is evidenced by a 4.5% growth in average rental rates, which rose to Kshs 185 per SQFT in 2024 from Kshs 177 per SQFT in 2023.
Eldoret recorded the lowest average rental yields at 7.1%, against the market average of 7.6% in 2024. Despite this, it was a 0.4%-points increase from the 6.7% recorded in 2023. However, this gain was offset by a 0.4% decrease in occupancy, which fell to 85.8% from 86.2% in 2023.
On the other hand, Eldoret also posted the most improvement, with a significant 4.5% increase in rental charges, rising to Kshs 138 per SQFT from Kshs 132 per SQFT in 2023.
|
All values in Kshs unless stated otherwise |
|||||||||
|
Cytonn Report: Summary of Retail Performance in Key Urban Cities in Kenya 2023/2024 |
|||||||||
|
Region |
Rent 2024 |
Occupancy Rate 2024 |
Rental yield 2024 |
Rent 2023 |
Occupancy Rate 2023 |
Rental yield 2023 |
∆Y/Y in Rental Rates |
∆Y/Y in Occupancy Rate |
∆Y/Y in Rental Yield |
|
Nairobi |
185 |
79.5% |
7.9% |
177 |
79.2% |
8.2% |
4.3% |
0.3% |
(0.3%) |
|
Nakuru |
82 |
83.0% |
7.3% |
79 |
80.5% |
7.9% |
3.5% |
2.5% |
(0.6%) |
|
Mombasa |
135 |
82.0% |
7.7% |
127 |
82.6% |
7.8% |
5.8% |
(0.4%) |
(0.1%) |
|
Kisumu |
111 |
78.3% |
7.3% |
107 |
79.7% |
7.0% |
3.4% |
(1.4%) |
0.3% |
|
Eldoret |
138 |
85.8% |
7.1% |
132 |
86.2% |
6.7% |
4.0% |
(0.6%) |
0.4% |
|
Mount Kenya |
151 |
77.5% |
7.8% |
161 |
68.3% |
7.8% |
(6.5%) |
9.2% |
0.0% |
|
Average |
133 |
81.0% |
7.6% |
130 |
79.4% |
7.5% |
2.6% |
1.6% |
0.1% |
Source: Cytonn Research
Section III: Retail Space Demand Analysis
To explore investment opportunities in the retail market and bridge existing gaps, our research focused on assessing the demand for retail space in different urban regions across Kenya. The main objective is to inform developers about both undersupplied and oversupplied areas. To achieve this, we conducted a comprehensive analysis, considering the current retail spaces available and those in the development pipeline. This data was then compared to the existing demand, taking into account the population of each region.
By employing this approach, we were able to calculate crucial metrics such as the net space uptake per person in square meters, the size of the shopping population, and the current retail market occupancy rates. These metrics played a key role in identifying regions with potential investment opportunities in the retail sector. To further enhance our analysis, we used Kilimani's average uptake as a benchmark to estimate the net space uptake for the various regions under consideration. This enabled us to make informed comparisons and draw valuable insights into the retail market dynamics in different parts of Kenya:
- Total Demand/Gross Uptake: This metric quantifies the overall retail space required by the population in the region. It is calculated by multiplying the net space uptake per person by the total shopping population,
- Net Demand/Uptake: This metric measures the gross uptake of retail space, excluding the occupancy rates of malls in the region. It is derived by multiplying the gross uptake by the respective market occupancy rates, and,
- Supply: The supply metric accounts for the total existing malls and those in the pipeline in the region. To assess the market's condition and identify potential gaps, we calculate the over/undersupply by subtracting the supply from the demand or net uptake.
Furthermore, our analysis is based on certain key assumptions:
- Number of persons per household: We assume an average household size of 3.6 in urban areas, as per data from the Kenya Population and Housing Census 2019, and,
- Percentage of shopping population: We consider the shopping population to include individuals aged 14 years and above.
(If the figure is positive, then the market has an undersupply i.e., demand is more than supply and if it is a negative figure then the market has an oversupply, i.e. supply is more than demand).
The retail space demand across key regions in Kenya is as shown below;
|
Cytonn Report: Demand Analysis 2024 |
||||||||||
|
Region |
2019 |
Urban Population |
Urban population 2019 |
Shopping People |
Net Space Uptake per pax in SQM (Based on Uptake per pax in Kilimani) |
Occupancy (2 year Average) |
Gross Space Uptake per Pax SQFT (Required Space Kilimani) |
Net Uptake SQFT (Space Required) for each market |
Current supply (SQFT) |
GAP at current market performance (SQFT) |
|
Kiambu |
2.1 |
60.0% |
1.3 |
0.7 |
1.9 |
78.8% |
2.1 |
1.6 |
0.9 |
0.7 |
|
Mt Kenya |
2.8 |
38.0% |
1.1 |
0.6 |
1.5 |
72.9% |
1.7 |
1.2 |
0.4 |
0.6 |
|
Mombasa |
1.3 |
100.0% |
1.3 |
0.8 |
1.9 |
82.3% |
2.1 |
1.8 |
1.4 |
0.3 |
|
Kajiado |
1.1 |
41.0% |
0.5 |
0.3 |
0.7 |
75.5% |
0.7 |
0.5 |
0.3 |
0.2 |
|
Machakos |
1.3 |
52.0% |
0.7 |
0.4 |
1.0 |
77.9% |
1.1 |
0.9 |
0.3 |
0.2 |
|
Nakuru |
2.2 |
45.0% |
1.0 |
0.6 |
1.4 |
81.8% |
1.6 |
1.3 |
0.6 |
0.2 |
|
Uasin Gishu |
1.3 |
44.0% |
0.6 |
0.3 |
0.8 |
86.0% |
0.9 |
0.8 |
0.4 |
(0.1) |
|
Kisumu |
1.2 |
50.0% |
0.6 |
0.3 |
0.9 |
79.0% |
1.0 |
0.8 |
1.0 |
(0.2) |
|
Nairobi |
4.6 |
100.0% |
4.6 |
2.7 |
6.7 |
79.4% |
7.4 |
5.9 |
8.5 |
(3.6) |
|
Total |
18.0 |
11.6 |
6.7 |
16.8 |
79.3% |
18.6 |
14.8 |
13.7 |
(1.7) |
|
|
Based on the analysis, Kenya's retail sector and the NMA realized a 9.5% decline and 8.3% increase in the market gap respectively to 1.9 mn and 3.6 mn per SQFT respectively when compared to the 2.1 mn and 3.3 mn SQFT recorded in 2022 respectively. This is attributed to an increase in demand for existing retail spaces and a reduced growth in the number of malls in the pipeline in other towns, alongside the completion of several malls and those still in the pipeline in the Nairobi Metropolitan Area (NMA) |
||||||||||
Source: Cytonn Research
Based on our demand analysis, Nairobi, Kisumu, and Uasin Gishu are the most oversupplied retail markets by 3.6 mn SQFT, 0.2 mn SQFT, and 0.1 mn SQFT, respectively, with average occupancy rates of 79.4%, 79.0%, and 86.0%, respectively.
Section IV: Retail Space Investment Opportunity
We analyzed the various urban regions in Kenya in order to determine the investment opportunity within the Real Estate retail market of the country. This was based on three metrics which include the rental yields, the retail spaces required, and the household purchasing power, with allocations of 30.0%, 30.0%, and 40.0% weights, respectively:
- Rental Yield - This is a measure of the value of the profit that an investor generates from an investment as a percentage of its value hence the higher the better. The weighted score for rental yields was 30.0%, and the area with the highest yield was ranked with the highest score of 9 whereas the area with lower yields was given the lowest score of 1,
- Household Expenditure - This measures the consumption expenditure of the target population hence the higher the better as well. The weighted score for this was at 40.0% and the area with the highest expenditure was given the highest score at 9, and the lowest given the lowest score at 1, and,
- Retail Space Demand - This measures the amount of retail space required by a particular region hence the higher the better as it increases occupancy rates of the available developments. 30.0% was the allocated weight for this and the area with the highest demand was given the highest score at 9 as well whilst the area with the lowest demand was allocated the lowest score at 1.
Based on our analysis, Mombasa, Mount Kenya, Nairobi, Kiambu, Kisumu, and, Nakuru, offer the best investment opportunities to retail mall developers having achieved a higher weighted score of 7.4, 6.8, 6.6, 5.8, 4.5, and, 4.2, respectively.
The table below shows the retail space investment opportunity in Kenya;
|
Cytonn Report: Retail Space Opportunity 2024 |
||||||||||
|
|
2023 |
2024 |
||||||||
|
Region/Weight
|
Retail Yield Score |
Retail Space Score |
Household expenditure (per adult) score |
|
|
Retail Yield Score |
Retail Space Score |
Household expenditure (per adult) score |
|
|
|
30% |
30% |
40% |
Weighted score |
2023 Rank |
30% |
30% |
40% |
Weighted score |
2024 Rank |
|
|
Mombasa |
7 |
7 |
8 |
7.4 |
1 |
7 |
7 |
8 |
7.4 |
1 |
|
Nairobi |
9 |
1 |
9 |
6.6 |
2 |
9 |
1 |
9 |
6.6 |
3 |
|
Mt Kenya |
6 |
8 |
5 |
6.2 |
3 |
8 |
8 |
5 |
6.8 |
2 |
|
Kiambu |
1 |
9 |
7 |
5.8 |
4 |
1 |
9 |
7 |
5.8 |
4 |
|
Nakuru |
8 |
4 |
4 |
5.2 |
5 |
5 |
4 |
4 |
4.3 |
6 |
|
Kisumu |
4 |
2 |
6 |
4.2 |
6 |
5 |
2 |
6 |
4.5 |
5 |
|
Machakos |
5 |
5 |
3 |
4.2 |
6 |
4 |
6 |
3 |
4.2 |
7 |
|
Kajiado |
2 |
6 |
2 |
3.2 |
8 |
1 |
5 |
2 |
2.6 |
8 |
|
Uasin Gishu |
3 |
3 |
1 |
2.2 |
9 |
3 |
3 |
1 |
2.2 |
9 |
Source: Cytonn Research
Section V: Retail Sector Outlook
The table presents a summary of metrics that have a possible impact on the retail sector, covering aspects such as retail space supply, retail market performance, retail space demand, and concludes with the market opportunity/outlook for the sector;
|
Cytonn Report: Kenya Retail Sector Outlook 2024 |
||||
|
Sentiment 2023 |
Sentiment 2024 |
2023 Outlook |
2024 Outlook |
|
|
Retail Space Supply |
Nairobi, Kisumu, Uasin Gishu, and Nakuru still remain the most oversupplied retail markets by 3.3 mn SQFT, 0.2 mn SQFT and 0.1 mn SQFT, respectively, whereas areas such as Kiambu, Mt Kenya, Mombasa, and Kajiado regions are undersupplied by 0.6 mn, 0.5 mn, 0.2 mn, 0.2 mn, and 0.1 mn SQFT respectively. Going forward, we expect to see investors and developers shifting their focus to these regions Notably, major retail developments delivered into the market in 2023 include, Business Bay Square (BBS) mall in Eastleigh, delivering approximately 31,000 SQM in gross area. We expect the supply to further increase particularly within the NMA, with the addition of an estimated 42,977 SQM through malls such as Global Trade Center (GTC), Crystal Rivers in Machakos, The Cove in Lavington, Lana Plaza in Kileleshwa, Park Place Avenue in Parklands and Beacon mall in Upperhill. Other notable developments expected to be delivered into the market outside of the NMA include Promenade mall in Nyali and Nyali Bazaar in Mombasa However notwithstanding, we anticipate a decline in the supply of malls in Kenya going forward as emphasis shifts towards convenience centers which are rapidly growing in popularity, owing to the convenience they offer. This is because they are situated closer to residential neighborhoods |
In the retail segment, Nairobi, Kisumu, and Uasin Gishu are the most oversupplied retail markets by 3.6 mn SQFT, 0.2 mn SQFT, and 0.1 mn SQFT, respectively, with average occupancy rates of 79.4%, 79.0%, and 86.0%, respectively. On the other hand, Kiambu, Mt.Kenya, and Mombasa remain undersupplied by 0.7 mn, 0.3 mn, and, 0.2mn SQFT respectively. With the prevailing undersupply, we expect developers and investors to tap into these areas and leverage the existing opportunity. During the year, we expect the Kilimani Retail Centre to be delivered to the market, providing approximately 50,000 SQFT of gross area. The project targets the middle class in the area as it neighbors a relatively populated residential zone. Other notable developments expected in NMA include the Kenya Mall “The Beacon” in Upper Hill, and the Cove, which will deliver 1,137 SQM of gross space and will be located in Lavington. Due to declining disposable incomes and a shift towards e-commerce, retailers are now more cautious about pursuing expansion plans. Consequently, there has been a noticeable decline in physical expansion efforts and the number of new entrants. Another observable trend in supply is that developers are either renovating or completely rebuilding existing buildings to increase space and meet current market needs. This is particularly evident in Nairobi's CBD With the aforementioned market shift, we anticipate a slower supply of retail spaces, particularly in malls in Kenya. Additionally, we expect a further move towards convenience centers "Mini Marts,"which have been increasingly emerging in many residential areas |
Neutral |
Neutral |
|
Retail Space Demand |
We expect the demand for retail space to be fueled by the continued aggressive expansion drive by both local and international retailers such as Naivas, Quickmart, Chandarana, and Carrefour. This will assist cushion the overall demand and bolster the uptake of spaces in the sector. However, factors such as e-commerce stifling the demand for physical retail space, and the existing oversupply of retail space in the NMA and Kenyan retail sectors (excluding NMA) at approximately 3.3 mn and 2.1 mn SQFT respectively, are expected to weigh down the optimum uptake of physical retail space in the market |
We expect retail demand to be driven by an expanding middle class in the country, which is increasing the demand for retail goods and services due to their higher propensity to spend on various commodities. Investors and developers are anticipated to align their strategies to tap into this market. However, factors such as the growth of e-commerce reducing the demand for physical retail space and the current oversupply of retail space of approximately 3.6 mn SQFT in the NMA and 1.9 mn SQFT in the broader Kenyan retail sector are expected to dampen the optimal uptake of physical retail space in the market |
Neutral |
Neutral |
|
Retail Market Performance |
Kenyan retail sector performance on overall improved, with the average rental yield coming in at 7.5% in 2023, 0.7%-points increase from 6.8% recorded in 2022. Similarly, the average rent per SQFT increased by 7.1% to Kshs 130 from Kshs 122 recorded in 2022, whereas the average occupancy rate also increased by 2.1% points to 79.4% from 77.3% in 2022. Nairobi Metropolitan Area was the best-performing region with an average rental yield of 8.2% in 2022, respectively in 2022 We expect to see increased market activity supported by; i) ongoing expansion drive by local and international retailers such as Naivas, Quickmart, Carrefour in sustained efforts to establish market dominance, and capitalize on the low formal retail penetration in Kenya, ii) growth and continued entry of multinational retailers in the country such as Simbisa brands, ChicKing, Java House, Chicken Cottage among others, and, iii) increasing foreign investors’ confidence in the Kenyan retail market |
The sector posted an improvement, with the average rental yield coming in at 7.6% in 2024, a 0.1%-points increase from 7.5% recorded in 2023. The rent per SQFT also posted a 2.3% increase coming in at Kshs 133 from Kshs 130 recorded in 2023. Additionally, the average occupancy rate also increased by 1.6% points to 81.0% from 79.4% 2023. Nairobi Metropolitan Area was the best-performing region with an average rental yield of 7.9%, however, this was 0.3% points decline from 8.2% recorded in 2023 We expect the Kenyan retail segment to be supported by; i) expansion plans by food and beverage brands such as Java, KFC, and others as they seek to increase their market share, ii) Local and international retailers like Naivas, China Square, and Carrefour aiming to penetrate the Kenyan market and address changing consumer needs ,iii) improving investor confidence due to favorable economic indicators, such as lower inflation and the strengthening of the Kenyan Shilling against major currencies like the US dollar, iv) a growing middle class creating increased demand for retail commodities, and v)and a rise in private equity investment as investors look for opportunities in the sector |
Neutral |
Neutral |
|
Our outlook for the Kenya retail market remains NEUTRAL supported by factors such as i) increased recognition of Nairobi as a shopping hub, ii) increased infrastructural development in the country opening up satellite towns for more investment opportunities, iii) a growing middle-class; creating demand for retail commodities, and iv) growth and expansion efforts by both local and international retailers. However; i) the continuous oversupply of retail space in the NMA and Kenyan retail sectors (excluding NMA) at approximately 3.6 mn and 1.9 mn SQFT respectively, ii) the rapid growth of e-commerce in the retail landscape, further projected to grow at a 6.7% CAGR (2023-2027), iii) reduction in disposable income among the Kenyan population, and iv) the current political uprising in the country might discourage investors; these factors are expected to impede the performance of the sector by limiting demand and uptake of spaces |
||||
For the full Kenya Retail Report 2024, click here
Disclaimer: The views expressed in this publication are those of the writers where particulars are not warranted. This publication, which is in compliance with Section 2 of the Capital Markets Authority Act Cap 485A, is meant for general information only and is not a warranty, representation, advice, or solicitation of any nature. Readers are advised in all circumstances to seek the advice of a registered investment advisor.


