Over the last few years, Kenya’s rising public debt has been a point of discussion in most macroeconomic outlook discussions, with organizations such as the World Bank, the International Monetary Fund (IMF), global credit rating agencies (Moody’s Credit Rating Agency, S&P Global Ratings, and Fitch Ratings) and the African Development Bank (AfDB), among others, raising concerns. Most recently, on 14th February 2018, Moody’s downgraded the government’s issuer rating to “B2” from “B1” previously, based on the observation that as the country’s financing needs continue to grow and the government turns to external commercial loans to fund the deficit, more pressure is likely to mount on the government’s liquidity and therefore ability to repay arising liabilities in good time. The credit rating agency however retained a “stable” outlook supported by Kenya’s strong and relatively diversified economy. The National Treasury however refuted the rating, claiming the analysis was not well informed. In totality, concerns have centred around the following areas:
- Kenya’s public debt to GDP is estimated at 56.2% in 2017 (rising from 44.0% 5-years ago, and 38.4% 10-years ago), and that we will use approx. 40.3% of our revenue raised from tax collection to finance debt payments in the fiscal year 2017/18,
- Globally accepted debt levels as per the IMF for frontier economies is 50.0% of GDP, and Kenya is 6.2% above those levels,
- The rising debt levels could result in a debt crisis,
- Possible liquidity pressure could arise from the large government debt instrument maturities, especially the 5-year Eurobond due in June 2019 that could result in further borrowing to pay off,
- As we borrow more from global markets, we become more susceptible to external market conditions and market shocks, and,
- The public debt to GDP ratio could soar above 60.0% by June 2018 unless proper policies are put in place to control this by the government.
We have previously written about our concerns on Kenya’s debt in the below publications:
- Kenya’s Debt Levels: Are we on a Sustainable Path? – In May 2016, we wrote about the rising debt levels and concluded that Kenya lied within the safer bounds in terms of debt levels but needed to look into risks associated with the changing funding patterns that could see the debt levels rise, and,
- Kenyan Debt Sustainability – In December 2016, we wrote about Kenya’s debt level, questioning its sustainability, and concluded that the government needed to reduce the amount of public debt, giving suggestions as to how this could be achieved.
This week, we seek to take a view on whether the rising debt levels should be a point of concern. We start by analyzing Kenya’s current debt profile and an outlook on the same, and then look at a few case studies of countries that have been through the same scrutiny. We finally conclude with an analysis of 5 metrics highlighting whether we should be worried, and give our recommendations on how Kenya can reduce its debt exposure.
Kenya’s Current Debt Profile
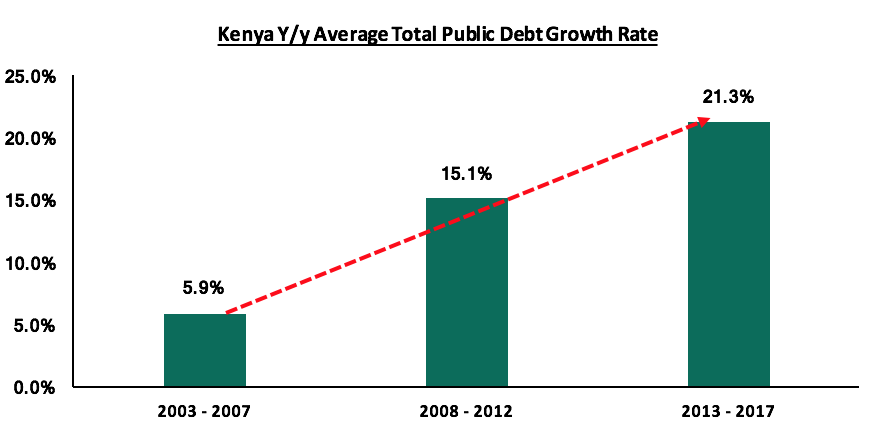
According to the 2018 Draft Budget Policy Statement, Kenya’s Public Debt to GDP ratio for the fiscal year 2017/18 is estimated to come in at 53.0%, while the IMF gives an estimate of 56.2% for 2017. Kenya’s total debt burden has been rising steadily, increasing by 22.2% y/y in November 2017 to Kshs 4.6 tn from Kshs 3.8 tn in November 2016. As can be seen in the graph below, in the 5-years from 2013 – 2017, the y/y average growth rate of Kenya’s total debt burden was 21.3%, up from the 2008-2012 5-year average of 15.1%, and the 2003-2007 5-year average of 5.9%; indicating that public debt has been growing at an increasing rate over the years. This is of concern when compared with GDP growth, which has been growing by 5.9% on average over the last 7-years.
The rising government debt has been driven by:
- An ever-expansionary budget over the years with the government embarking on infrastructural spending on projects that are expected to develop the country and spur economic growth, and,
- A shortfall in tax revenue that has resulted in a widening budget deficit despite goals to reduce this to 3.4% of GDP by the fiscal year 2020/21; the deficit, which currently stands at 7.9% of GDP, is being plugged in through borrowing both locally and from the external market.
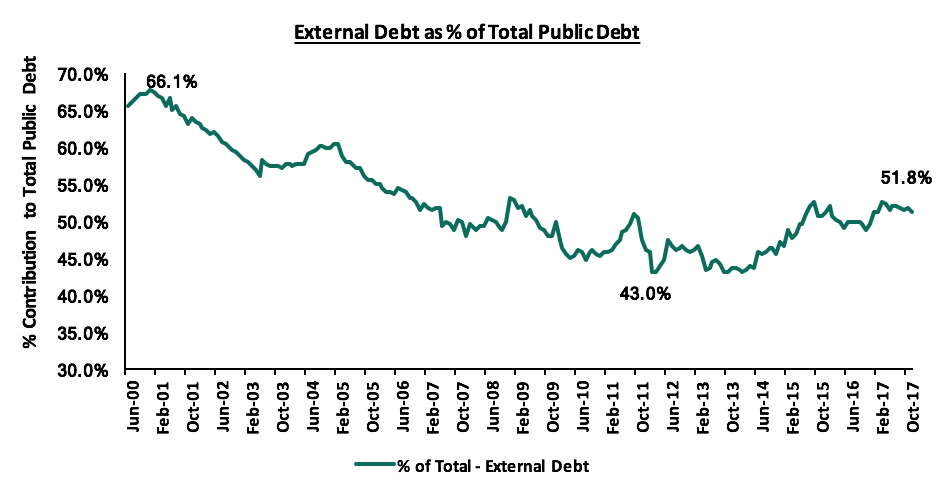
The ideal debt mix for any given country would contain more of domestic debt as international markets borrowings should be handled with caution since too much borrowing or reliance on global markets opens up the country to international economic trends, which could negatively affect the economy due to exogenous shocks. It is imperative that we be cautious on external borrowing if we are to achieve long term economic stability. Kenya’s external to domestic government debt mix stood at 52:48 as at November 2017, a huge improvement from 66:34 in June 2000, but a drop from 43:57 in March 2012 as indicated in the chart below:
While too much debt in general is detrimental to a country’s ability to repay, external debt is of more concern as it is exposed to external as well as internal risks. Due to this, we decided to take a closer look at the composition of Kenya’s external debt. First is to understand the two types of loans: Concessional loans are those extended at more favourable rates than market rates and are extended by non-profit organisations such as the IMF, African Development Bank and Fund(ADB & ADF) e.t.c., compared to non-concessional loans, which are agreed at commercial terms, with all market and country risk premiums fully factored in. An ideal mix would be to have more of concessional debt, as non-concessional debt is likely to negatively affect the economy as the foreign financing from commercial banks is relatively expensive, which would then lead to an increase in Kenya’s public debt service, meaning a higher percentage of the country’s revenue collections would go towards interest payments as opposed to development expenditure. Looking at Kenya’s external debt profile in respect to this, we note that:
- China remains Kenya’s largest bilateral lender, having lent Kenya a total of Kshs 520 bn as at December 2017, compared to Japan at Kshs 82.5 bn and France at Kshs 62.3 bn,
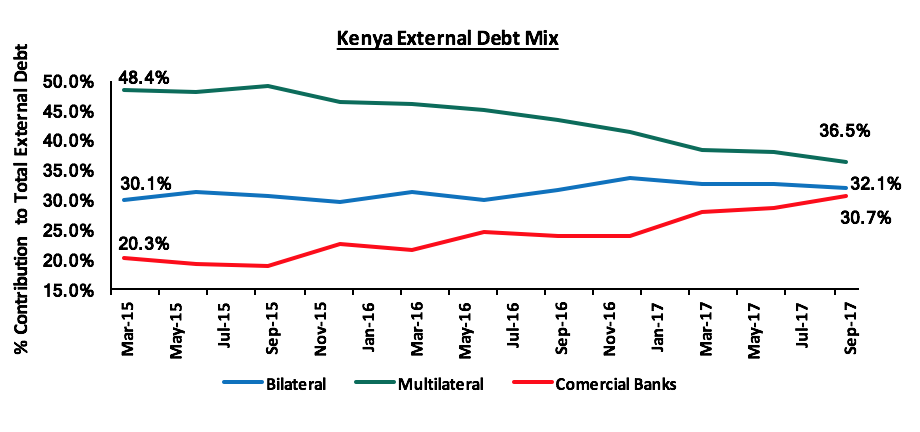
- Foreign debt from commercial banks, which is largely non-concessional, has been rising steadily from a 20.3% contribution in March 2015 to 30.7% in September 2017, and,
- Multilateral foreign debt, which is largely composed of concessional facilities from organizations such as the International Development Association (IDA) and the ADB & ADF, has been on a steady decline, from 48.4% to 36.5% in the same periods.
This is illustrated in the chart below:
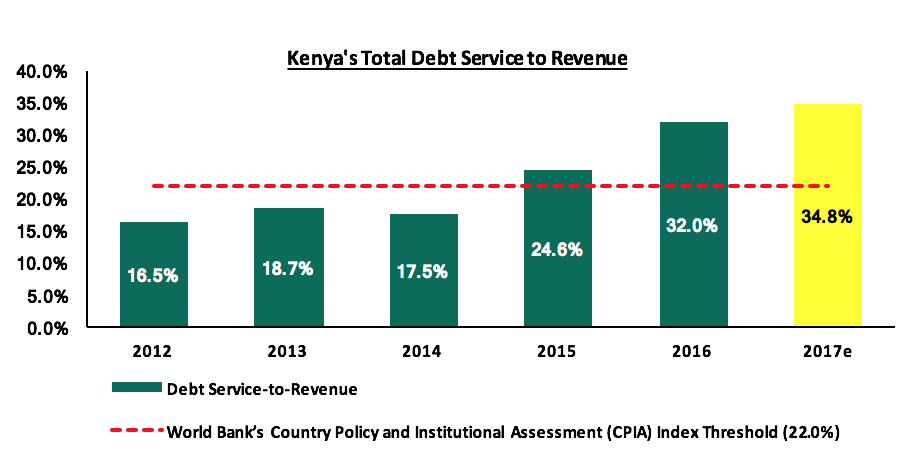
This has resulted in a steady increase in the public debt service-to-revenue ratio, which has increased to an estimate of 34.8% in 2017 from 16.5% in 2012 as shown in the chart below. It is estimated that Kshs 658.2 bn will be paid in loans in the current fiscal year 2017/18, which is 40.3% of the Kshs 1.6 tn revenue target.
GDP per capita has managed to stay above debt per capita over the years, with the 2017 estimates being at Kshs 151,000 and Kshs 92,000, respectively. However, debt per capita has grown faster at an 8-year CAGR of 15.4% as compared to GDP per capital at 9.8%, as shown in the chart below:
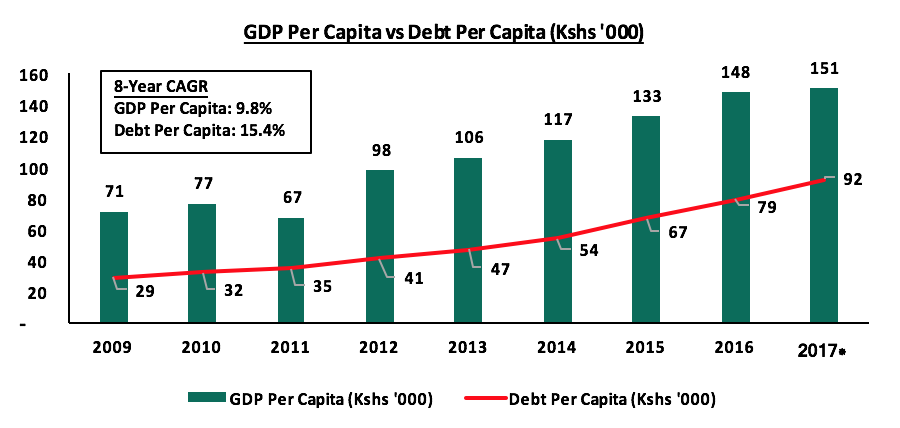
*2017 estimates assumed a GDP growth rate of 4.7% as per Cytonn Projection and a population growth rate of 2.6% as per the World Bank 2016 Estimate. Total Public Debt is as of November 2017
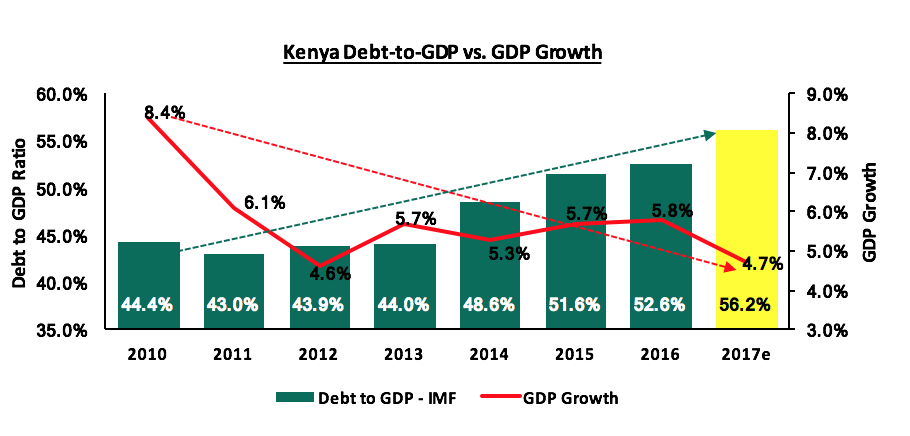
While some might argue that the borrowed funds are channelled towards development spending, on projects that are expected to eventually pay off by sparking faster economic growth, we have not seen the increase in public debt to GDP resulting in increased GDP growth yet as indicated in the chart below. With the 2017 expected public debt to GDP at its highest, GDP growth is expected to hit its 2nd lowest point in 8-years:
Looking at the Sub-Saharan Africa economies that are expected to drive growth in 2017 and 2018, (i) Ethiopia has managed to maintain higher growth rates despite rising debt levels, while (ii) Ghana experienced its lowest GDP growth rates from 2014 to 2016 when its public debt to GDP ratio was at its highest, leading to intervention by the IMF. Ghana’s public debt situation is currently being looked at as a possible crisis caused by plummeting global commodity prices and their over-reliance on commodities, and public funds being placed in projects that have not ensured the borrowed money can be paid out in time. Mozambique on the other hand is in an actual crisis after defaulting on debt payments and its debt-to-GDP ratio hitting 113.6% in 2016 with Kenya still at 52.6% in the same period. We shall therefore look at the case of Ghana and Mozambique, focusing on events leading to the intervention by the IMF and the debt crisis, respectively.
The Case of Ghana
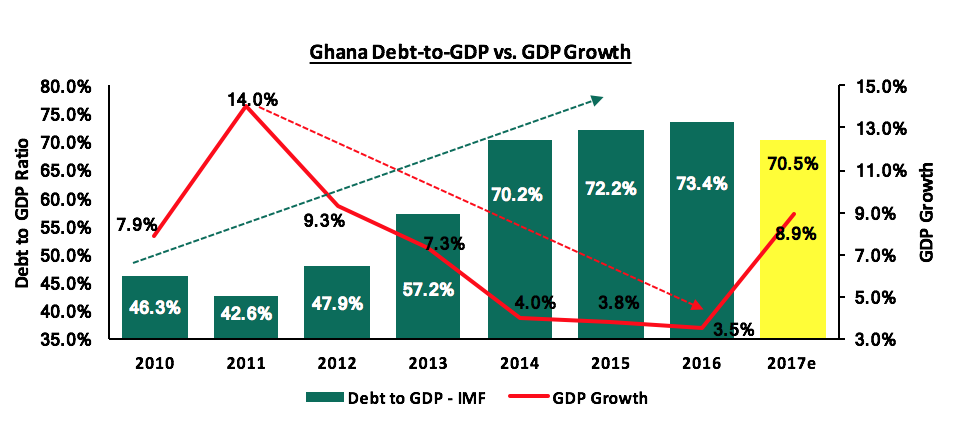
Ghana’s risk of debt crisis stemmed from a gradual but steady rise in public borrowing on the back of oil discovery and thriving of global commodity prices, seeing as Ghana is commodity-dependent, big on cocoa and gold exports; the 3 (oil, cocoa and gold) currently contribute to over 80.0% of exports. Following the beginning of the decline of commodity prices in 2013 coupled with a depreciating Cedi against the USD, Ghana continued to borrow to deal with this. Failure to invest amounts borrowed in projects that would yield economic returns and unwise debt management, featuring increased non-concessional borrowing, resulted in the historical high debt to GDP ratio of 73.4% recorded in 2016. The IMF and World Bank’s joint Debt Sustainability Assessment of Ghana rated the debt distress level at moderate from May 2007 to February 2015. From March 2015, this was bumped up to high risk following an increase of the debt-to-GDP ratio to 70.2% in 2014 and a sharp decline in GDP growth to 4.0% as (i) global commodity prices remained low, and (ii) Ghana’s focus on commodities had resulted in a negligence of the manufacturing sector whose contribution to GDP declined to 5.0% in 2014 from 10.0% in 2006. This is illustrated in the chart below:
The Ghanaian Government got to a point where it was borrowing mainly to pay back maturing debt instruments and plug in the deficit arising from dismal revenue collection in 2013. During this period, the Cedi depreciated by 92.6% against the USD. The IMF stepped in to bail out lenders in April 2015 through concessional loans, and by introducing reforms that had to be adopted by the government such as reduction of government expenditure and increases in tax rates to boost revenue collected and reduce the budget deficit. With these measures in place, the budget deficit is expected to reduce to about 4.5% of GDP by 2018, from 6.5% as per their 2018 Budget Statement, effectively reducing annual borrowing and the government debt-to-GDP ratio below the 50.0% threshold, but Ghana still remains a country in high risk of debt distress.
Kenya can take the following lessons from Ghana’s situation up until the point of IMF intervention:
- The government should invest borrowed funds in projects with high enough economic returns to guarantee debt repayments, and,
- Kenya should diversify its economy, reducing overreliance on agricultural produce, which are commodities and subject to fluctuation of global commodity prices and changes in climate which are beyond the control of the government. It is however important to note that Kenya is moving towards a better diversified economy, with agriculture contributing 18.8% of GDP as at Q3’2017 compared to 23.7% in 2010 and 31.3% in 2000, and other sectors such as tourism, manufacturing, construction and real estate supporting the economy and driving growth.
The Case of Mozambique
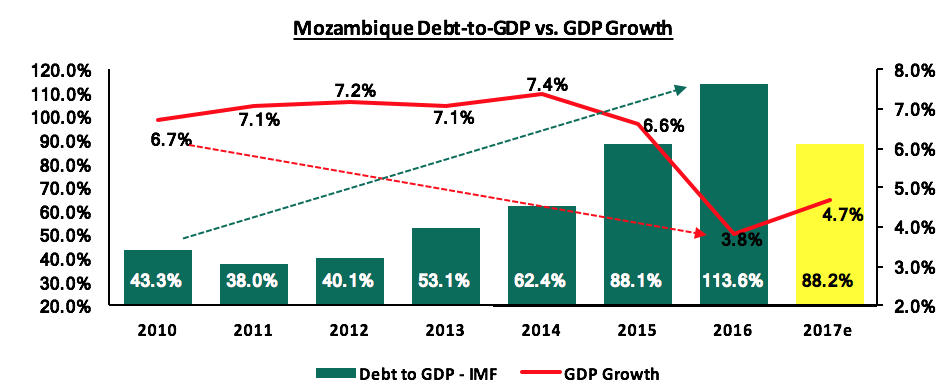
Mozambique’s debt crisis is more often referred to as a debt scandal given the events that led up to a tailspin of defaults. It all begun in 2013 when USD 2.0 bn in government-guaranteed debt was raised for fishing and maritime security projects, arranged by Switzerland’s Credit Suisse and Russia’s VTB Capital and channelled to 3 Mozambican companies i.e. EMATUM (Mozambique Tuna Company), ProIndicus and MAM (Mozambique Asset Management). April 2016 saw the uncovering of about USD 1.4 bn worth of government debt that had not been declared, leading to the IMF withholding the loan programme, and the Metical depreciating by 34.5% against the USD by the end of the year; an occurrence that would serve to make the payment of external debt more expensive. Other prospective donors grew skeptical following the IMF’s action and halted any ongoing budgetary support discussions. Come mid-January 2017, the government defaulted on an interest payment worth USD 60.0 mn, launching an audit of the country’s public external debt by Kroll, a multinational risk management firm, in a bid to hold all those involved in the fraudulent deal accountable. The results of the audit revealed how the loans were issued and discrepancies in asset value but failed to reveal how loan proceeds were utilized by the three companies. For the IMF and other lenders to resume lending to Mozambique, it was recommended that the country introduce strong policies to enhance transparency and accountability going forward. By the end of 2016, the public debt-to-GDP ratio had hit 113.6%, GDP growth had fallen by almost half to 3.8%, inflation rose to 19.2%, above the government set target of 5.0% - 6.0%, and investors demanded higher yields for shorter term papers as they priced in the risk of default, with the 3-month T-bill yielding 12.9% while the 5-year T-bond was at 8.0%.
Kenya can take a few lessons from the circumstances that led to Mozambique’s debt crisis, which include:
- Taking the fight against corruption seriously given there was unconfirmed speculation around how the funds obtained from the two Kenyan Eurobond issues in 2014 were utilized, and,
- Review and re-inforce the external debt obtaining process to ensure it is loop-hole free, transparent and accountable.
What do we expect for Kenya in 2018?
According to the Draft 2018 Budget Policy Statement, the government maintains that the country’s public debt is currently still sustainable, but outlines the following measures it will take to maintain this:
- Taking steps to narrow the budget deficit through better revenue mobilization, with plans to revamp the Income Tax Act, further improve on tax administration by the KRA and expand the tax base by targeting the informal sector,
- Borrow only for development expenditure, while maximizing on external concessional loans and keeping commercial loans limited only to projects with very high economic returns, and,
- Minimizing foreign exchange risk that external loans are exposed to, by diversifying the currency structure and composition of external debt.
These measures, if implemented, will serve to reduce the public debt levels while boosting economic growth. However, international organizations still remain skeptical with forecasts indicating that public debt could shoot past 60.0% of GDP by June 2018, especially with the expected March 10-year Eurobond issue.
Should we be concerned?
From the case studies, we note some similarities between the public debt scenarios of the two countries (Ghana and Mozambique) and Kenya as explained below:
- Debt-to-GDP Ratio is upwards slopping, yet GDP growth is downwards sloping,
- Like Ghana in 2013, Kenya seems to be borrowing to pay back maturing obligations, with (a) the 8-year commercial loan of Kshs 77.0 bn from the Eastern and Southern Africa Trade and Development Bank (TDB), formerly PTA Bank, taken on to pay off debt holders of the 2015 syndicated loan who declined to extend maturity, and (b) the March 2018 Eurobond that is expected to be used to offset the maturing USD 750 mn from the 5-year Eurobond issued in 2014 that matures in June 2019 and a USD 800.0 mn syndicated loan that was taken in 2016,
- GDP growth is commodity-dependent with Kenya still reliant on agriculture like Mozambique with oil & gas and Ghana with oil, coca and gold, and,
- The return on debt-funded investments is questionable.
To answer the question as to whether we should be concerned, we have put together a table of metrics, indicating the level of concern based on the current and projected situation.
|
No. |
Metric |
Narrative |
Level of Concern |
|
1. |
Total Government Debt to GDP |
The 2017 Ratio is estimated at 56.2%, up from 52.6% in 2016 and 44.4% in 2010; above the EAC Monetary Union Protocol, the World Bank Country Policy and Institutional Assessment Index, and the IMF threshold of 50.0%. Moody's projects that the ratio will surpass 60.0% by June 2018 unless decisive policies are implemented by the government. The government has outlined sound measures which are pegged on actual implementation but plan to issue a USD 1.5 – 3.0 bn 10 – 15 year Eurobond in March 2018 |
High |
|
2. |
Total Debt Service to Revenue |
The 2017 ratio is estimated at 34.8% up from 16.5% in 2012, and above the 22.0% IMF threshold. IMF estimates show that it will remain above the threshold in the short to medium term and we expect it to rise in tandem with continued non-concessional borrowing. In the year 2015/16, the KRA met its collection target, but years before that and the year after the KRA has failed to meet its target. For the half of the fiscal year 2017/18, the KRA collected Kshs 712.2 bn in revenue, meeting 43.6% of its target of Kshs 1.6 tn. With an expectation of subdued corporate earnings, we don’t expect them to meet their target for 2017/18. With revenue collections lower than expected and non-concessional debt rising, this ratio is also expected to rise |
High |
|
3. |
Total Public Debt Mix |
The external to domestic debt ratio was at 52:48 in November 2017, with more external debt susceptible to external shock. Given the narrow rift however, should the government be prudent in reducing the amount borrowed externally, tables can easily be turned. However, with the expected Eurobond issue, this seems to be unlikely in the short term |
Medium |
|
4. |
External Debt Mix |
Commercial borrowing has been rising steadily while largely concessional multilateral loans have been declining steadily and should this persist, expensive commercial loans could end up being the largest component of external debt, hence increasing the debt service. Foreign debt from commercial banks, which is largely non-concessional, has been rising steadily from 20.3% contribution in March 2015 to 30.7% in September 2017 |
High |
|
5. |
Current Account Balance |
The current account balance worsened to 7.0% of GDP in Q3’2017 from 6.2% recorded in Q2’2016 and 6.0% in Q3’2016, to Kshs 145.4 bn, attributable to imports rising by 20.3% to Kshs 450.9 bn from Kshs 374.8 bn in Q3’2016. Currency risk exists when the shilling depreciates, effectively increasing foreign debt service obligations owed. The CBK has managed to keep the currency stable against the USD, having only depreciating by 0.7% in 2017 and appreciating by 1.9% YTD. The CBK will continue to support the Shilling in the short term through its sufficient reserves of USD 7.1 bn (equivalent to 4.7 months of import cover) |
Medium |
Of the 5 metrics we have taken into account, 3 suggest High concern while 2 suggest Medium concern bringing our conclusion to: Yes, we should be concerned about the country’s debt levels “Unless decisive policies are implemented by the government.”, as Moody’s would put it.
Suggestions for such decisive policies include:
- Improving revenue collection mechanisms to maximize the amount collected in revenue, which will lead to a narrowing budget deficit and reduced total borrowing. Measures outlines in the Draft 2018 BPS such as a complete overhaul of the current Income Tax Act and strengthening tax administration and expansion of the tax base, if implemented, should be an initial step in the right direction,
- Repeal the interest rate cap legislation, which would in turn improve private sector credit growth and in turn improve GDP growth while enabling involvement the private sector in economic development. There is already a step in this direction by the Kenya Parliamentary Budget Office (KPBO), which has put in place a proposition to review the law capping interest rates
- Building an export-driven economy by encouraging growth in the manufacturing sector to increase the value-added exports and hence the value of our exports vis-à-vis imports, leading to an improving current account deficit,
- Restructuring the debt mix to ensure less is borrowed from external sources, ensuring a larger percentage of foreign borrowing is concessional in order to reduce amounts paid in debt service and diversifying currency sources of foreign borrowing in order to diversify currency risk on externally borrowed funds. As per the Draft 2018 BPS, the government plans on adopting a deliberate approach in diversifying currency structure so as to hedge against exchange rate risks especially for new loan commitments. External commercial borrowing will also be limited to development projects with high financial and economic returns, a move that will ensure the more expensive debt is invested in projects that yield more than the market rate charged,
- The government should encourage private sector involvement in development projects in order to reduce the strain on government expenditure and hence borrowing, (as of today, other than in energy, we have not been able to consummate any Public-Private Partnerships (PPPs) in areas such as real estate and housing),
- Better governance and accountability to reduce wastage and corruption levels. We hope that the recent steps by the president to strengthen key institutions of probity, such as the office of the Director of Public Prosecution (DPP), Directorate of Criminal Investigations (DCI) and Attorney General should go a long way in enhancing governance, transparency and accountability around public resources, and,
- Making the public investment procedure more efficient through better administration of borrowed funds and improvement of project selection, fund allocation, monitoring and evaluation; and decreasing opportunities for corruption scandals surrounding large borrowed sums.
Disclaimer: The views expressed in this publication, are those of the writers where particulars are not warranted. This publication, which is in compliance with Section 2 of the Capital Markets Authority Act Cap 485A, is meant for general information only, and is not a warranty, representation, advice or solicitation of any nature. Readers are advised in all circumstances to seek the advice of a registered investment advisor.


