Introduction
Over the past few years, Kenya’s Public Debt has been on the rise as a result of the government’s ambitious development agenda evident in the country’s budgets over the last ten years. We have seen a couple of rating agencies relook at the country’s Sovereign Credit Outlook and change them to a more negative outlook. Below is a summary of those:
- In May, Moody’s Credit Agency released its rating outlook where it changed Kenya’s sovereign credit outlook to “negative”, from a previous outlook of “stable”, but affirmed the earlier on B2 credit rating. The agency highlighted that the negative outlook was a result of rising financial risks brought about by the country’s large borrowing requirements especially during this time where the fiscal outlook is deteriorating, given the erosion of the revenue base and the high debt and increased interest burden. According to Moody’s, the large borrowing needs, the negative fiscal outlook, will and continues to expose Kenya to exchange and interest rate shocks thus threatening any fiscal consolidation measures that had been set by the government.
- In July, the global rating agency, Standard and Poor’s (S&P) also lowered its outlook on Kenya’s economy to “negative” from “stable” while affirming the country’s rating at ‘B+/B’, mainly due to the fallouts from the pandemic which have slowed down the country’s growth and weighed down on its already weak public finances. The negative outlook reflects the worsening fiscal position of the country amidst the pandemic and the disruptions to revenue collection.
- Fitch Ratings similarly revised the outlook on Kenya’s Long-Term Foreign-Currency Issuer Default Rating (IDR) to negative from stable, affirmed the Issuer Default Rating at ‘B+’, and downgraded the country’s ceiling to ‘B+’ from ‘BB-‘. The agency expects a sharp economic slowdown and deterioration in the budget deficit and the ratio of government debt to GDP on the back of weak fiscal consolidation. They forecast government debt to reach 70% of GDP in FY 2022, as a result of delays in fiscal consolidation brought about by the pandemic and weak revenue growth. Despite the above, the ‘B+’ IDR reflects favourable growth potential and relatively stable macroeconomic conditions.
Essentially, the rating downgrades may influence the country’s cost of borrowing in the international financial markets and make it harder for the country to borrow from the international market.
Below are the previous topicals we have done on Kenya’s debt:
- Kenya’s Debt Levels: Are we on a Sustainable Path?– In May 2016, we wrote about the rising debt levels in the country and concluded that they were within the safer bounds in terms of debt levels but needed to look into risks associated with the changing funding patterns that could see the debt levels rise,
- Kenyan Debt Sustainability– In December 2016, we wrote about Kenya’s debt level, questioning its sustainability, and concluded that the government needed to reduce the amount of public debt, giving suggestions as to how this could be achieved, and,
- Kenya’s Public Debt, Should We be concerned? – In February 2018, we wrote about the concerns surrounding the debt level’s the country and concluded that we should be concerned about the country’s debt levels unless decisive policies were implemented,
In this week’s topical, we focus on the current state of affairs regarding the country’s public debt profile and levels and discuss how sustainable the same is. Under this, we shall cover:
- Kenya’s Evolution of Debt,
- Is Kenya’s Debt Sustainable?
- Debt Composition,
- Debt Service to Revenue ratios, and,
- Debt to GDP ratios,
- Conclusion and Recommendations.
Section I: Kenya’s Evolution of Debt
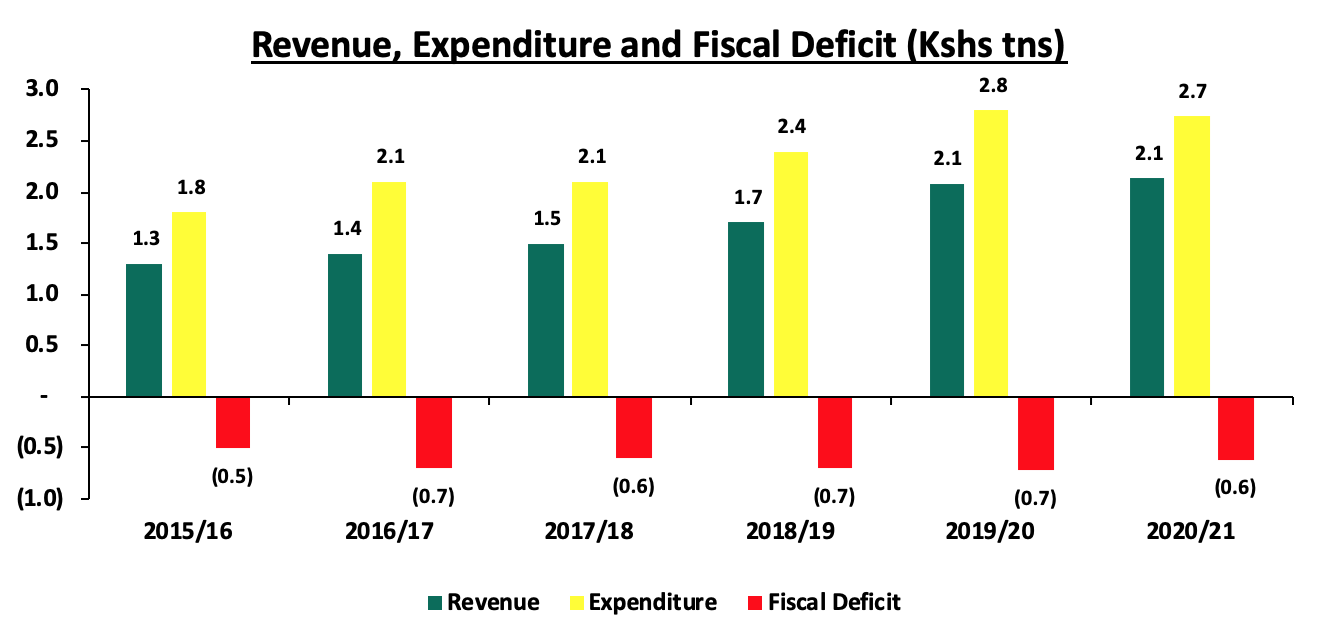
The national budget has continued to grow, with total expenditure growing at a 6-year CAGR of 7.3% to an estimated Kshs 2.7 tn in FY’2020/21 according to the 2020 Budget statement, from Kshs 1.8 tn as at the end of FY’2015/16. Revenue growth, on the other hand, has grown at a faster 6-year CAGR of 8.6% to an estimated Kshs 2.1 tn in FY’2020/21, from Kshs 1.3 tn as at the end of FY’2015/16. The fiscal deficit came in at Kshs 0.6 tn (equivalent to 5.2% of GDP) in FY’2020/21 as highlighted in the chart below,
Source: National Treasury
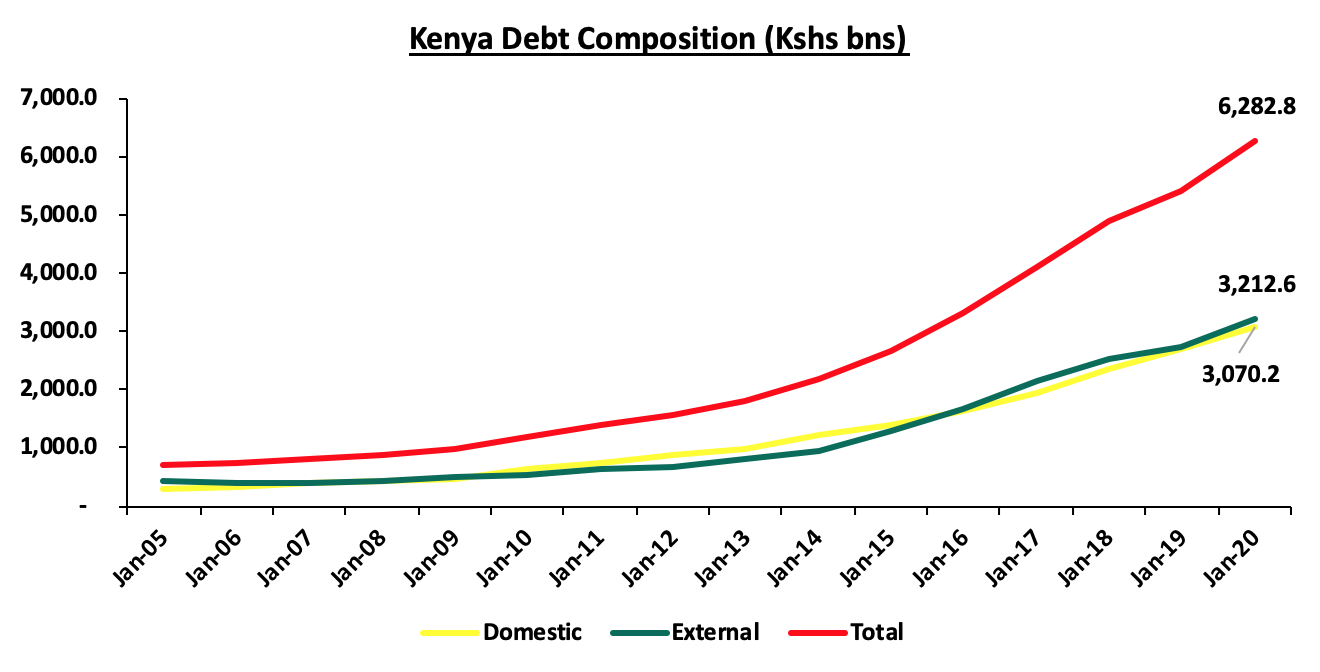
The country’s total public debt as at March 2020 stood at Kshs 6.3 tn, with the country having raised the debt ceiling to the absolute figure of Kshs 9.0 tn from the initial 50% of GDP in October 2019, this means that the government has headroom to borrow an additional Kshs 2.7 tn before the current debt ceiling is exceeded. The debt mix stands at 51:49 external and domestic debt, respectively, meaning foreign borrowing is currently at Kshs 3.2 tn while domestic borrowing came in at Kshs 3.1 tn. Below is a table highlighting the trend in debt composition over the last 15 years;
Source: Central Bank of Kenya
In the current budget, FY2020/21, the government intends to borrow a total of Kshs 569.4 bn comprising of Kshs 247.3 bn from external lenders, a 30.0% decline from the Kshs 353.5 bn seen in FY2019/20 and Kshs 318.9 bn as domestic debt from the projected 300.7 bn in the FY’2019/2020. Consequently, the ratio of domestic to foreign debt will come in at 56:44.
Section II: Is Kenya’s Debt Sustainable?
- Debt composition
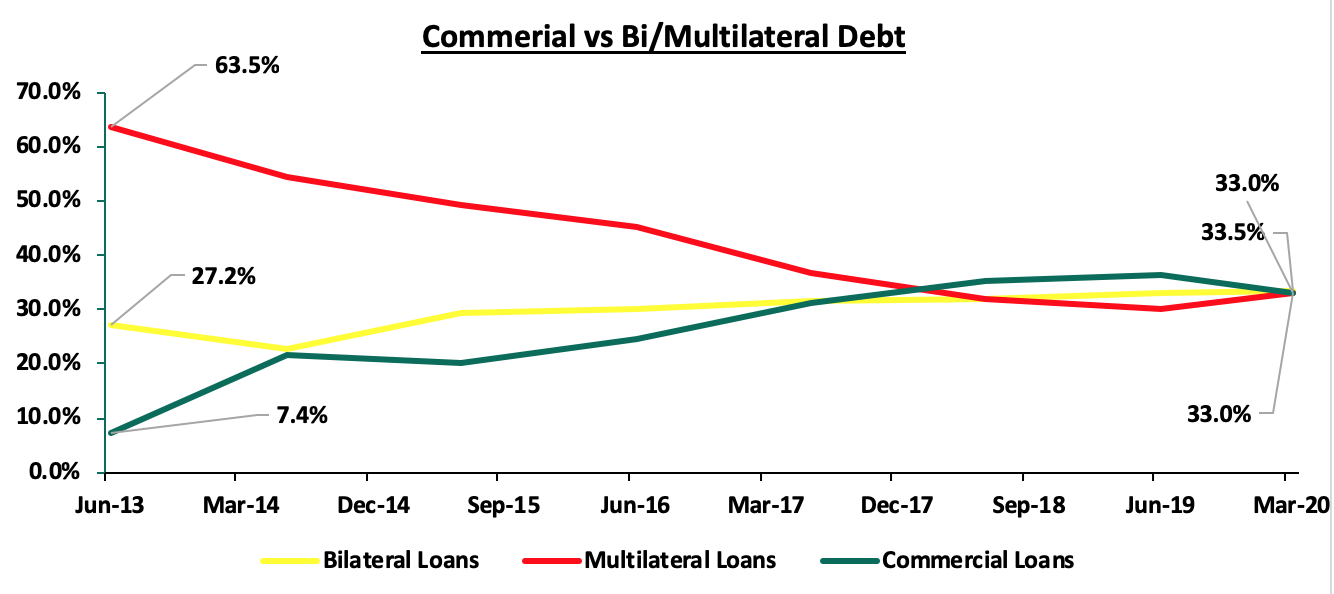
The country’s debt composition has evolved with the exposure to bilateral and multilateral development institutions declining, to a much more commercial funding structure comprising of Eurobonds and syndicated loans. This has seen the proportion of concessional loans (Bilateral and Multilateral debt) which stood at 90.7% of total external debt as at June 2013, decline to approximately 66.5% as of March 2020. This has seen commercial loans, deemed more expensive because of their high-interest costs, grow from a low of Kshs 58.9 bn (equivalent to 7.4% of total external debt) as at June 2013, to Kshs 1.0 tn (equivalent to 33.0% of total external debt) as at March 2020, with suppliers credit accounting for the remaining 0.5% of the total foreign debt. It is key to note that:
- Contribution from both Bilateral foreign debt and Commercial banks’ loans decreased marginally from 33.7% and 34.6%, respectively in March 2019, to 33.5% and 33.0% in March 2020, and,
- Multilateral foreign debt, which is largely composed of concessional facilities from organizations such as the International Development Association (IDA) and the ADB & ADF, increased from 31.1% to 33.0% over the same periods.
This is illustrated in the chart below:
Source: Central Bank of Kenya & National Treasury
- Debt Service to Revenue Ratio:
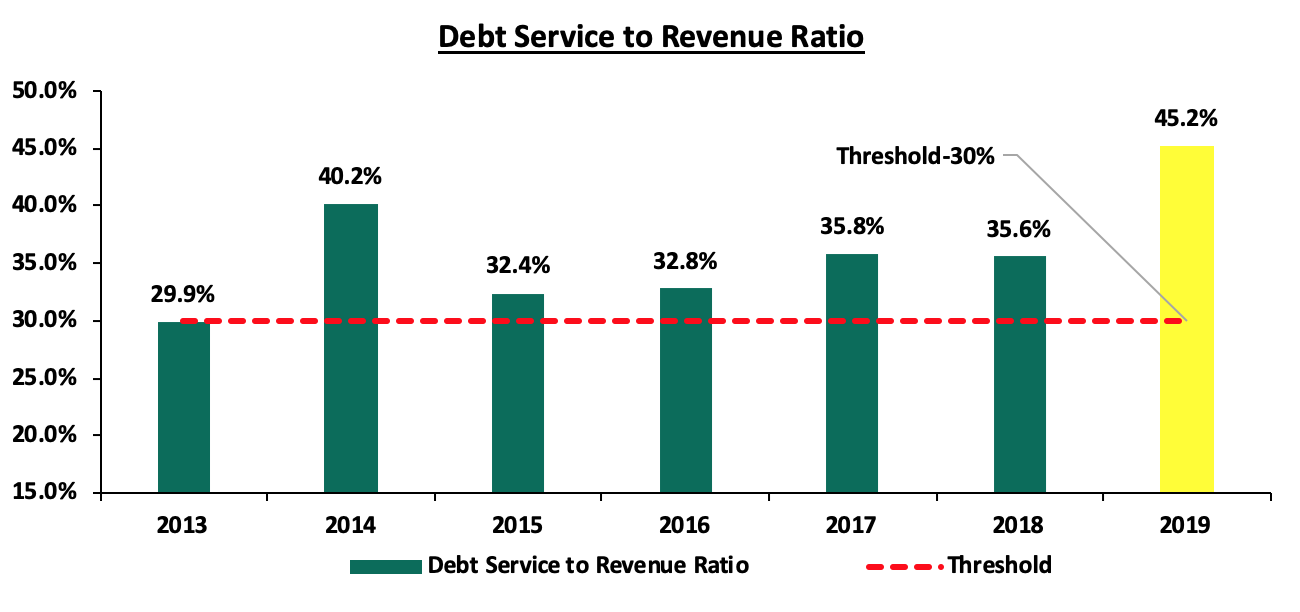
This is a measure of how much of the government’s revenue is used to service debt. For the first half of 2020, revenue collection activities of the government have been affected due to the ongoing pandemic with major economic sectors such as tourism, manufacturing and agriculture feeling the brunt effects of the pandemic following supply-side shocks. According to the National Treasury, the debt to service revenue ratio is estimated at 45.2% at the end of 2019, higher than the recommended threshold of 30.0% and as such elevating the risks of repayment following shocks arising from the ongoing pandemic and low revenue collection. For this financial year, a total of Kshs 904.7 bn has been set aside for debt servicing from the Kshs 2.1 tn projected revenue collection. Below is a chart showing the debt service to revenue ratio;
Source: IMF Country Report & National Treasury Annual Public Debt Report
Further to the above, we expect the country’s cost of debt servicing to rise driven by currency depreciation with the shilling having depreciated by 6.0% year to date to close the week at Kshs/USD107.5. Additionally, the debt service to revenue ratio is expected to increase mainly driven by the expected decline in revenue.
- Debt to GDP Ratio
On the other hand, Kenya’s debt to GDP ratio came in at an estimated 62.1% in 2019, 12.1% above the IMF recommended threshold of 50.0%. Late last year, the treasury amended the Public Finance Management (PFM) regulations to substitute the debt ceiling which was previously set at 50.0% of GDP to an absolute figure of Kshs 9.0 tn to plug the budget shortfalls without hurting the economy since there was no more scope to raise taxes. According to Fitch Ratings, the shocks from COVID-19 are expected to delay the narrowing of the fiscal deficit. Government debt is forecasted to 70.0% of GDP in 2021 on the back of rising debt levels and weak revenue growth. Below is a graph highlighting the trend in the country’s debt to GDP ratio;
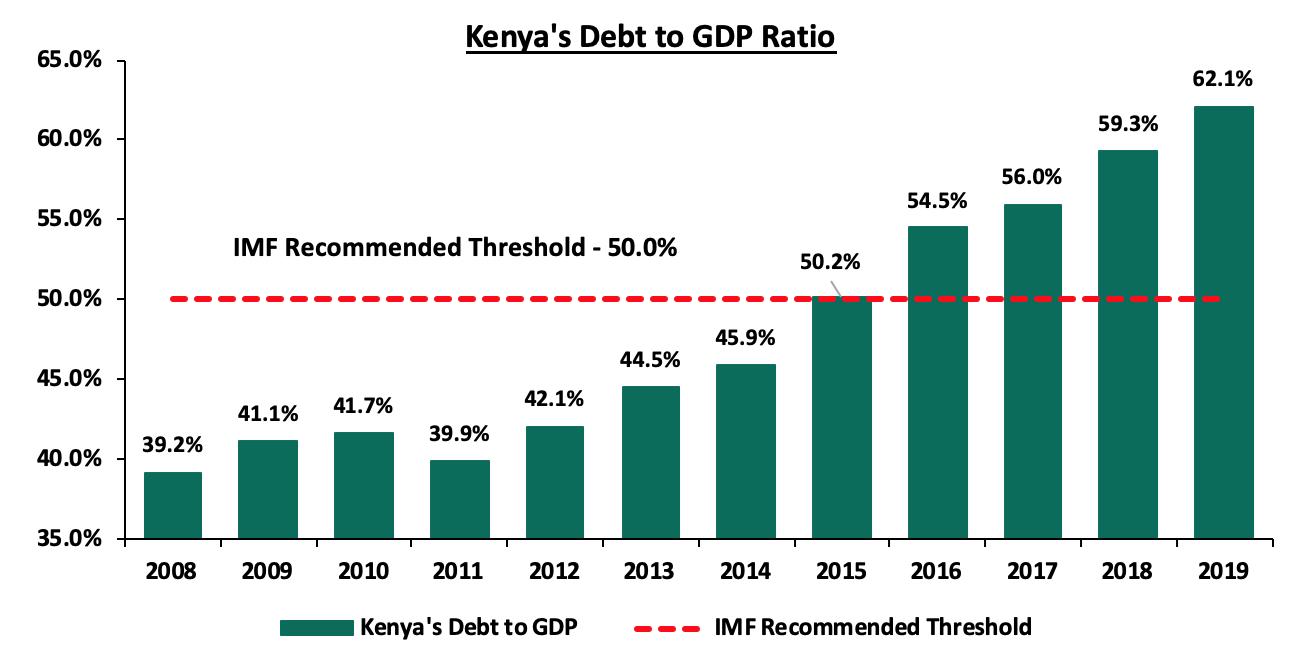
Source: World Bank
Some might argue that the additional debt is being directed towards development projects which will, in turn, lead to faster economic growth but this has not been the case. A significant amount of government spending has gone towards development projects whose expected economic return might not be able to finance the cost of financing. For example, the Exim Bank of China is set to receive Kshs 43.2 bn in debt payments for the SGR in the current fiscal year despite the project facing a variety of challenges such as low cargo volumes.
According to the IMF, the Kenyan economy is expected to grow at 1.0% in 2020, while the National Treasury expects the same to come in at 2.5%. The expected decline in growth is already being seen through the suppressed business activity experienced during the second quarter of the year, evidenced by the country’s Purchasing Manager’s Index which dipped to 34.8 in April 2020, the second-lowest level since the index was set up. The GDP growth for the year is expected to be slower than debt financing meaning the debt to GDP ratio will increase significantly since the denominator - GDP Growth - will grow at a much slower pace.
Below are some of the risks that the high debt levels open the economy to:
- Possible depreciation of the local currency as other governments demand hard currency to service the debt increases,
- The higher cost of debt servicing may lead to higher taxation as the local government tries to keep up with its debt obligations,
- The increased cost of further borrowing since lenders will price the new debt considering the possible increased risks,
- Crowding out of the private sector by the government which largely leads to lower projected economic growth which even impacts collections much further,
- Decreased ability to effectively respond to problems since governments often borrow to address unexpected events. Having a high debt level means there will be fewer options,
To determine whether the current debt is sustainable, we have put together a table of metrics indicating the level of concern based on the current and projected situation
|
No. |
Metric |
Narrative |
Level of Concern |
|
1. |
Total Government Debt to GDP |
The 2019 Ratio is estimated to come in at 62.1%, up from 45.9% in 2014; and well above the IMF threshold of 50.0%. Fitch projects that the ratio will reach 70.0% by June 2021 unless decisive policies are implemented by the government. Despite being above the IMF threshold, the government raised the debt ceiling to the absolute figure of Kshs 9.0 tn, meaning that the government still has room for additional borrowing, |
High |
|
2. |
Total Debt Service to Revenue |
The figure for 2019 is estimated at 45.2% up from 35.6% in 2018 and above the 30.0% IMF threshold. In the year 2019/20, the government had a revenue target of Kshs 2.1 tn which it did not meet due to poor revenue collection in the last quarter of the 2019/20 fiscal year. Going forward we are pessimistic on the government’s ability to meet its revenue collection targets given the current environment, |
High |
|
3. |
Total Public Debt Mix – Domestic vs. External |
The external to domestic debt ratio came in at 51:49 in March 2020, compared to 52:48 in March 2015. Given the marginal difference in the current ratio, the government has the option of being prudent in reducing the amount borrowed externally. |
Medium |
|
4. |
Debt Mix – Commercial vs. Concessional Loans |
The increase in contribution of commercial loans to 33.0% of total external debt in March 2020, from 20.1% in June 2015, has resulted to a higher debt service to revenue ratio for the country since commercial loans attract higher interest rates when compared to a concessional loan. Concessional loans’ contribution has decreased from 78.7% in June 2015 to 66.5% in March 2020 |
High |
|
5. |
Current Account Balance |
The current account balance worsened to 10.2% of GDP in Q1’2020, mainly attributable a 67.0% in the services trade balance to Kshs 20.4 bn from Kshs 61.9 bn in Q1’2019. This was mitigated by the 9.1% narrowing in the merchandise trade deficit mainly supported by a 14.0% increase in exports, outweighing the 0.1% increase in imports. The Kenyan shilling depreciated by 5.1% against the US Dollar during the first half of 2020. Despite this, we expect the shilling to be supported by the CBK’s sufficient reserves, currently at USD 9.7 bn (equivalent to 5.8 months of import cover), above the statutory requirement of 4.5 months import cover. |
High |
Of the 5 metrics we have taken into account, 4 suggest High concern while 1 suggest Medium concern, as such we are of the opinion that the current debt levels are not sustainable and the government should be pro-active in alleviating the pressures on the country’s debt
Section III: Conclusion and Recommendation
The high debt levels in the country have become a point of concern with both the debt to GDP ratio as well as the debt service to revenue ratio having exceeded the recommended threshold. We expect the economy to face fiscal challenges arising from the global pandemic. This sentiment has been echoed by various authoritative bodies, pointing to a possible further downgrading of Kenya’s creditworthiness. Despite this, some investors are optimistic with regards to the country’ outlook evidenced by the decline in Eurobond yields over the month of May, pointing to the perception of lower risk in the country going forward coupled with the additional funding received from both the World Bank and the IMF. Locally, the Central Bank through the Monetary Policy Committee has continued to support the economy through the policy rate and the Cash Reserve Ratio and is confident that the measures put in place are having the desired effect. Similarly, the government has also made some tax amendments to help boost revenue collection and at the same time cushion the economy from the adverse effects of the coronavirus. Below are some actionable steps the government can take towards debt sustainability;
- Restructuring the debt mix: the government should go for more concessional borrowing to reduce the amounts paid in debt service. Additionally, commercial borrowing should be limited to development projects with high financial and economic returns, to ensure that more expensive debt is invested in projects that yield more than the market rate charged,
- The government can carry out capital expenditure cuts during the current period of distress and direct the funds to areas that have a higher economic return such as supporting the manufacturing sector. By scaling down on the funding of new projects and focusing on completing those that are pending the economic benefits will be transmitted into the economy and support overall economic growth,
- The government can focus on developing certain sectors to build an export-driven economy. Encouraging growth in the manufacturing sector will help increase the value of our exports leading to an improved current account. Additionally, they can encourage private sector involvement in such development projects to reduce the strain on government expenditure, and,
- The government should take a more proactive stance in enforcing the recent tax policy changes to prevent tax avoidance and evasion, recent policies such as the introduction of digital tax which are geared towards widening the tax base.
Disclaimer: The views expressed in this publication are those of the writers where particulars are not warranted. This publication is meant for general information only and is not a warranty, representation, advice, or solicitation of any nature. Readers are advised in all circumstances to seek the advice of a registered investment advisor.


