Debt sustainability has been a critical issue in the Sub-Saharan Africa region as several countries are facing high risk of debt distress. We have seen countries such as Zambia and Ghana having to restructure their debt to avoid a complete default on their loans. Similarly, concerns remain high on Kenya’s debt sustainability as a result of the continued rise in country’s debt levels with institutions such as World Bank and the International Monetary Fund (IMF) stressing on the need for Kenya to focus on fiscal consolidation. As of December 2022, total public debt stood at Kshs 9.1 tn translating to a debt to GDP ratio of 63.0%, 13.0% points above IMF’s recommended threshold of 50.0% for developing countries. Additionally, debt service to revenue ratio stood at 47.9%, 17.9% points above IMF’s recommended threshold of 30.0%, highlighting how much public debt servicing weighs on the country’s expenditure. Most of the external debt is denominated in USD at 68.1% and the high depreciation of the shilling has continued to put more pressure on the debt serving, the Kenya shilling, have depreciated by 8.9% year following a 9.0% depreciation recorded in 2022. This week, we shall focus on highlighting the current status of Kenya’s public debt as we approach the end of the FY’2022/2023, discuss the economic consequences of high debt levels as well as give our outlook on the country’s debt sustainability.
We have been tracking the evolution of Kenya’s public debt with the most recent topical being Kenya’s Public Debt 2022; Debt Service Coverage, which was done in July 2022. Here we highlighted the state of affairs concerning the country’s public debt and concluded by discussing strategies that the government could implement in order to reduce the economic consequences of high debt levels as well as mitigate the high risk of debt distress. In this week’s topical, we shall focus on the current status of Kenya’s public debt as we approach the end of the FY’2022/2023. We shall look at what are the economic consequences resulting from high debt levels. We shall also give our outlook on the country’s debt sustainability given upcoming USD 2.0 bn Eurobond maturing in June 2024. The main question being, “Is Kenya debt level sustainable and what can the government do today to reduce the level of debt distress?” We shall cover the following:
- The Current State of Kenya’s Public Debt,
- Kenya’s Debt Servicing Cost,
- Economic Consequences of high Debt levels
- Kenya’s Debt sustainability analysis and projection, and,
- Conclusion and Recommendations.
Section 1: The Current State of Kenya’s Public Debt
According to the National Treasury, Kenya’s Public Debt came in at Kshs 9.1 tn, (equivalent to 63.0% of GDP) as of December 2022, an 11.2% increase from the Kshs 8.2 tn (66.2% of GDP) recorded in December 2021. Additionally, the public debt to GDP is expected to slightly decline to 60.0% in 2023, on the back of the government’s continued focus on prioritizing the payment of debt obligations. However, we expect the government effort to be impeded by the deteriorated macroeconomic environment occasioned by the high inflationary pressures, aggressive currency depreciation, and slower economic growth which is expected to stifle revenue collection. Below is a graph highlighting the trend in the Kenya’s debt to GDP ratio:
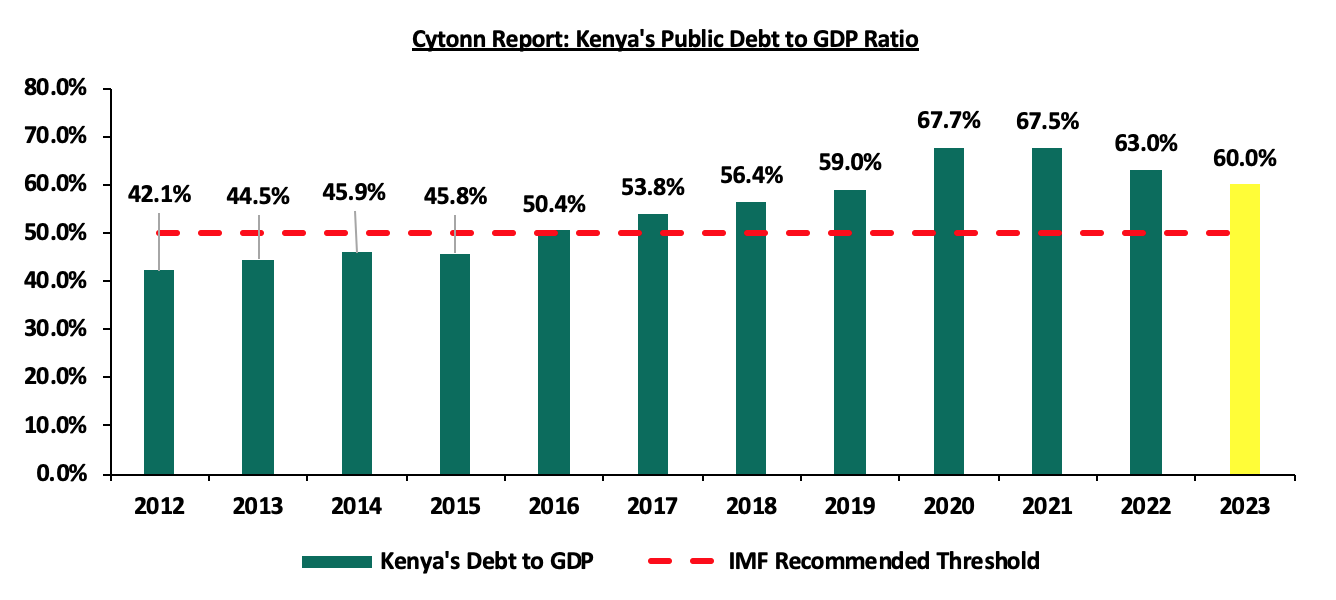
Source: National Treasury
The debt levels have continued to grow due to the government continuously running budget deficits. The fiscal deficit has averaged 8.1% over the last ten years due to the focus on both development and recurrent expenditure. Both the revenue and expenditure has grown over the last ten years , however, the government expenditure has grown at a 10-year CAGR of 12.7% to Kshs 3.0 tn as at the end of FY’2021/2022, from Kshs 0.9 tn at the end of FY’2011/2012, while revenue has grown a slower pace of 10-year CAGR of 12.3% to Kshs 2.2 tn at the end of FY’2021/2022, from Kshs 0.7 tn at the end of FY’2011/2012. The chart below shows the growth in Kenya’s total revenue and expenditure in the last 10 financial years:
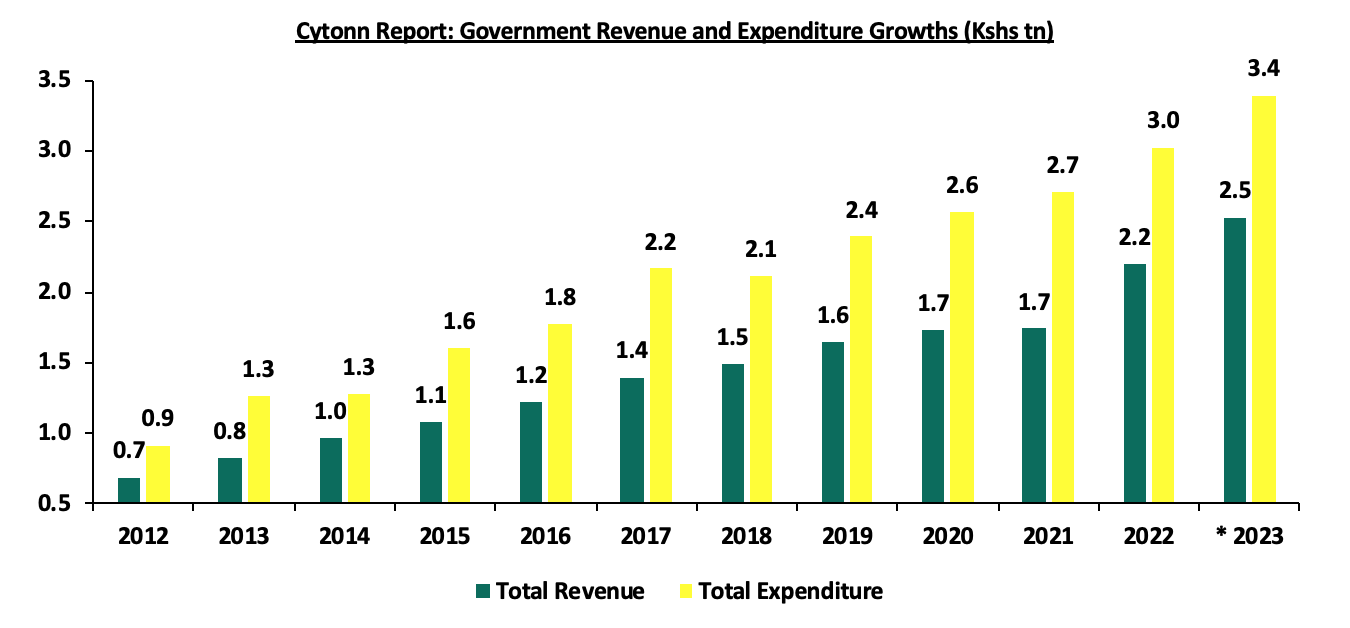
* Annualized for FY’2022/2023
Source: Central Bank of Kenya
- The Nature of Kenya’s Debt Composition (Domestic vs External)
The country’s debt composition has averaged about 50.0% for both domestic to foreign debt. As at December 2022 the proportion of domestic to foreign debt stood at 48.9% to 51.1% compared to 54.2% to 45.8% in December 2012. The above has been necessitated by the need to balance against suffocating the private sector locally while not getting to much foreign exchange exposure. The external debt has increased at a higher of 10-year CAGR of 19.0% to Kshs 4.7 tn as at December 2022, from Kshs 0.8 tn in December 2012 while the domestic debt has increased at a lower 10-year CAGR of 16.5% to Kshs 4.5 tn as at December 2022 from Kshs 1.0 tn over the same period. Below is a graph highlighting the trend in the external and domestic debt composition over the last 10 years;
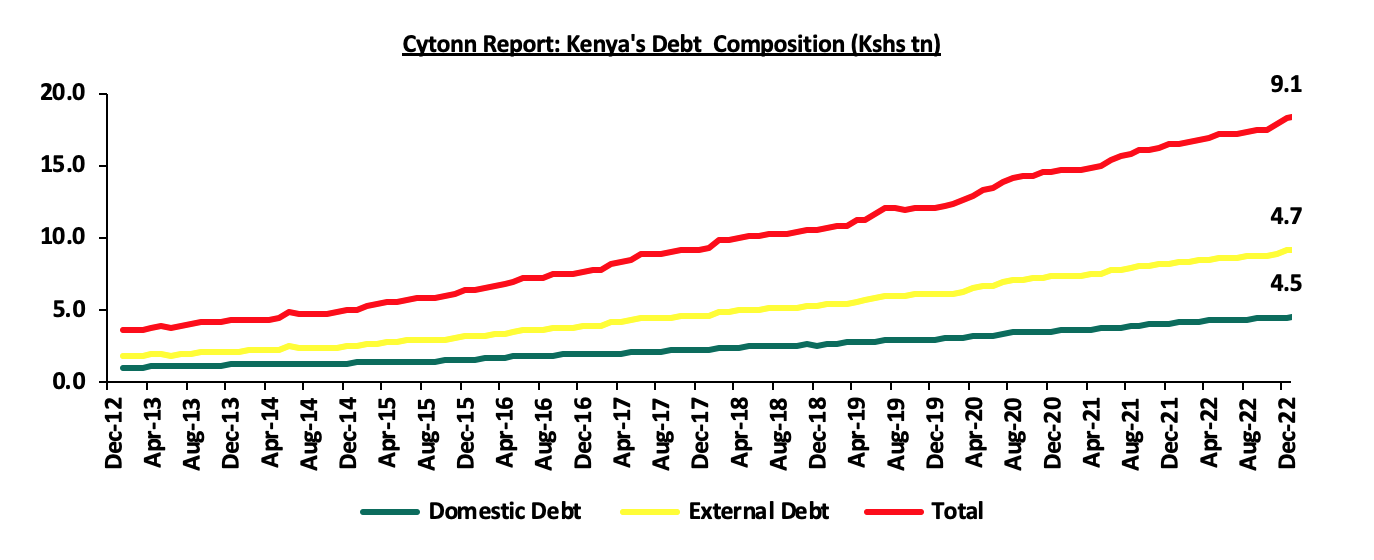
Source: National Treasury and Central Bank of Kenya
The holders of the Kenya’s public debt cut across various institutions banks and Non-Bank institutions (Pension funds, parastatals and insurance companies). The Non-Banks constituted the largest holding of 25.5%, while external supplier’s credit had the least holdings at 0.1%. Below is a graph showing the holders of the country’s cumulative public debt:
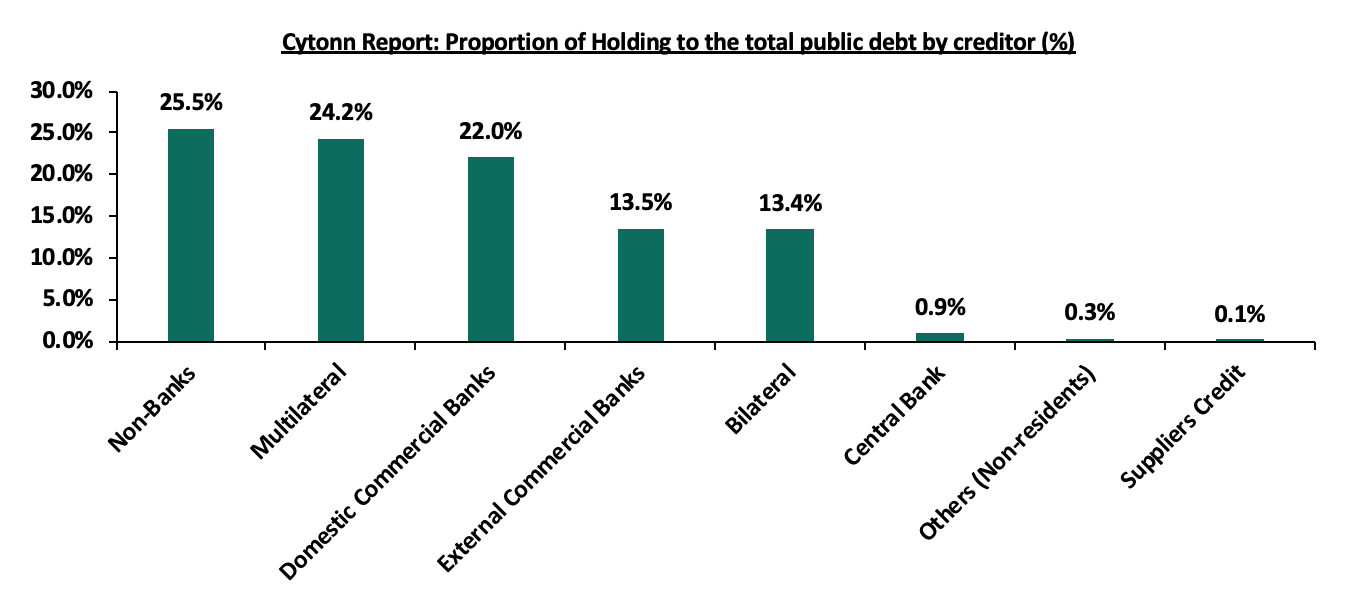
Source: Office of Controller of Budget
- Public Debt Mix by Holders
- External Debt Composition by Holders (Bilateral, Multilateral, and Commercial Banks)
External debt comprises majorly of multilateral loans, bilateral loans and commercial loans. In FY’2021/2022, Kenya’s exposure to bilateral and multilateral loans was on the rise, attributable to favourable terms offered in terms of low interest rates and longer repayment periods. Notably, increased interest rates in the international finance market during the FY’2021/2022 made Eurobond (commercial borrowing) expensive. This was attributable to the heightened perceived risk stemming from economic uncertainties, due to the elevated global inflationary pressures as well as heightened debt sustainability concerns in most developing countries. As a result, (Bilateral and Multilateral) increased by 24.2% to Kshs 2.2 tn in December 2022, from Kshs 1.8 tn in December 2021, while commercial loans grew by 3.4% to Kshs 1.2 tn as at December 2022, from Kshs 1.1 tn as at December 2021. The chart below shows external debt composition by Creditors:
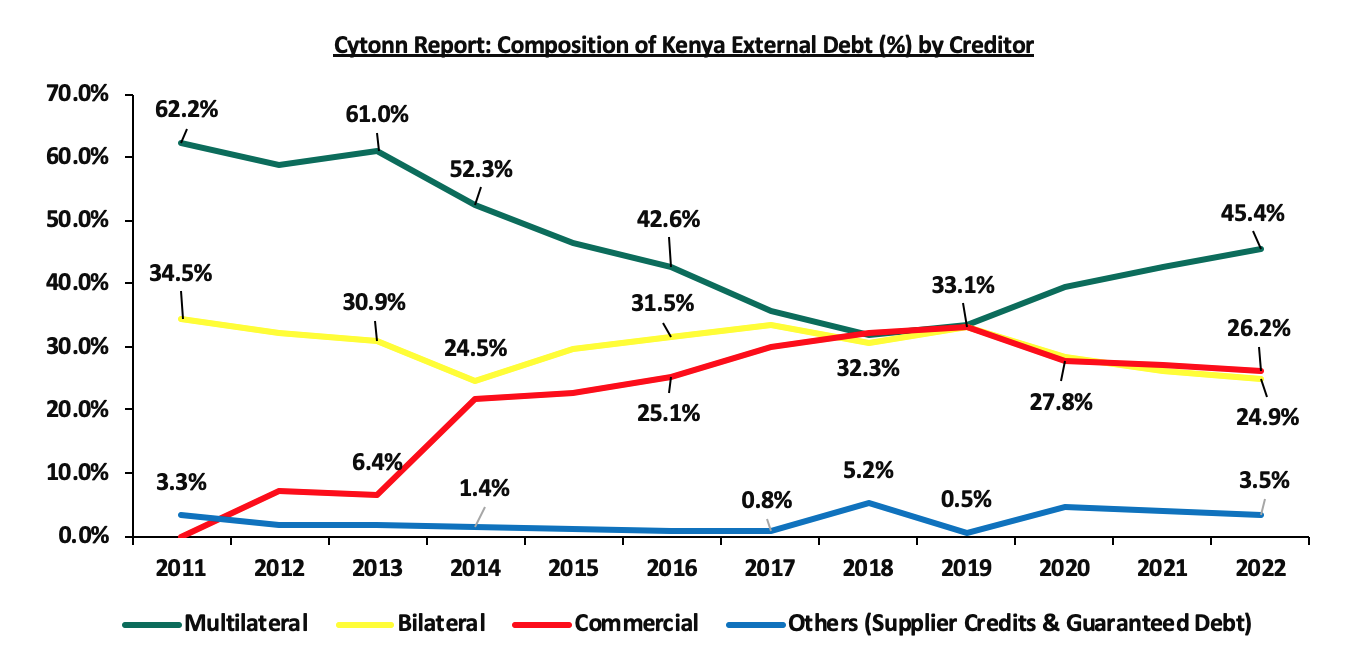
Source: National Treasury
It is key to note that:
- The portion of multilateral debt increased by 4.7% points to 47.4% in December 2022, from 42.7% in December 2021, due to loans worth USD 750 mn (Kshs 80.9 bn) under the Development Policy Operation (DPO) from the World Bank and a total of USD 683.0 (Kshs 83.8 bn) from the IMF under the Extended Credit Facility arrangement (EFF/ECF) for budgetary support, during the period. On the other hand, Bilateral debt decreased by 1.9% points to 24.3% in December 2022, from 26.2% in December 2021,
- Commercial debt as a percentage of external debt reduced by 2.4% points to 24.8% of total external debt in December 2022 from 27.2% in December 2021, mainly attributable to Kenya’s government shunning away from the more expensive debt due to the prevailing market conditions and,
- As of December 2022, 68.1% of the external debt was US Dollar denominated which is likely to continue contributing to the increasing debt servicing cost given the shilling’s continuous depreciation. The table below shows currency composition of the external debt stock:
|
Cytonn Report: Currency composition of the External Debt Stock (%) |
||
|
Currency |
December 2021 |
December 2022 |
|
USD |
67.0% |
68.1% |
|
EUR |
19.0% |
19.8% |
|
Yen |
6.0% |
4.2% |
|
Yuan |
6.0% |
5.4% |
|
GBP |
2.0% |
2.4% |
|
Other Currencies |
0.0% |
0.2% |
Source: National Treasury
- Domestic Debt Composition by Holders
Banking institutions account for the highest percentage of domestic debt in terms of government securities holdings at 47.1%, but this has been reducing as the exposure by pensions schemes have been on the rise. The percentage holding by banking institutions declined by 3.1% points to 47.1% in December 2022, from 50.2% in December 2021 due to increased lending by majority of the banks in Q4’2022, on the back of reduced credit risk as well as increased economic activities in the country as a result of improvement in the country’s business environment. Pension funds holdings on the other hand increased by 1.9% points to 33.3% in December 2022, from 31.4% in December 2021. Below is a table of the composition of government domestic debt by holders:
|
Cytonn Report: Composition of Government Domestic Debt by Holder |
|||||||||||
|
Domestic debt |
Dec-12 |
Dec-13 |
Dec-14 |
Dec-15 |
Dec-16 |
Dec-17 |
Dec-18 |
Dec-19 |
Dec-20 |
Dec-21 |
Dec-22 |
|
Banking institutions |
52.1% |
49.2% |
54.3% |
55.4% |
52.2% |
54.6% |
54.5% |
54.3% |
53.3% |
50.2% |
47.1% |
|
Insurance Companies |
10.5% |
10.2% |
9.9% |
8.4% |
7.3% |
6.4% |
6.1% |
6.4% |
6.4% |
6.8% |
7.4% |
|
Parastatals |
4.8% |
3.5% |
2.8% |
4.6% |
5.8% |
6.9% |
7.3% |
6.5% |
5.7% |
5.6% |
6.0% |
|
Pension Funds |
20.7% |
26.1% |
23.9% |
25.4% |
28.2% |
27.5% |
27.6% |
28.6% |
30.3% |
31.3% |
33.1% |
|
Other domestic investors |
11.9% |
11.0% |
9.0% |
6.2% |
6.5% |
4.6% |
4.6% |
4.2% |
4.3% |
6.1% |
6.4% |
|
TOTAL |
100.0% |
100.0% |
100.0% |
100.0% |
100.0% |
100.0% |
100.0% |
100.0% |
100.0% |
100.0% |
100.0% |
Source: Central Bank of Kenya
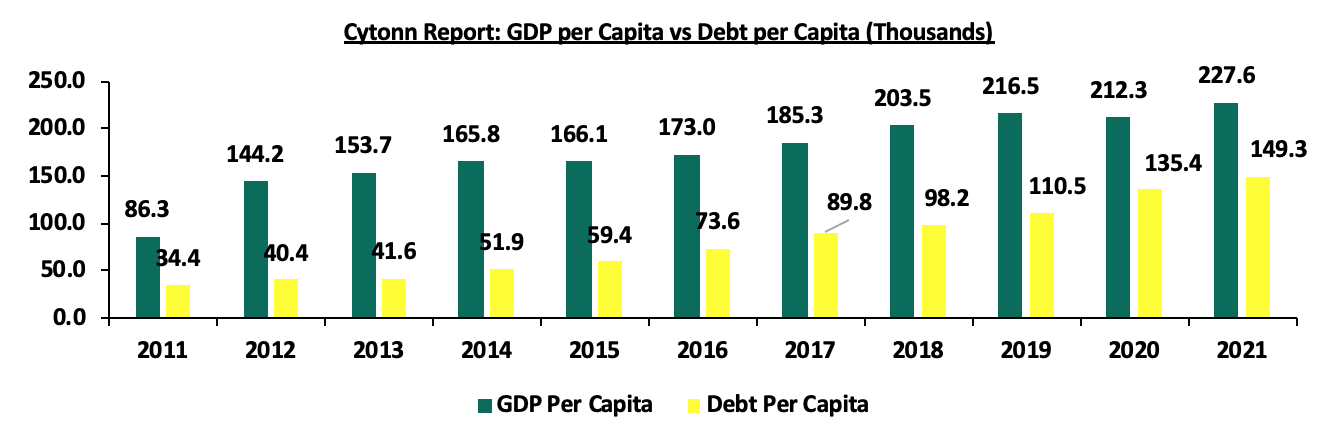
- GDP per Capita vs Debt per Capita
According to the World Bank, Kenya’s Public Debt per Capita has increased at a 10-year CAGR of 15.8% to Kshs 149,252.3 in 2021, from Kshs 34,400.0 in 2011. On the other hand, GDP per Capita has grown at a slower 10-year CAGR of 10.2% to Kshs 227,597.0 in 2021, from Kshs 86,300.0 in 2011, an indication that the debt being incurred is not translating into economic growth. The chart below compares Kenya’s GDP per capita to the debt per capita:
Source: World Bank and CBK
Factors that have accelerated the growth in Kenya’s Public debt;
- Fiscal Deficit – Kenya has witnessed a persistent fiscal deficit averaging at 8.1% of the GDP for the last 10 financial years and is projected to come down to 6.1% of the GDP at the end of FY’2022/2023. The controller of budget highlights in the Budget Implementation Review Report for H1’2022/2023 that the current approved budget stands at Kshs 4.2 tn against a targeted revenue collection of Kshs 2.1 tn, hence the need to borrow an additional Kshs 1.0 tn domestically as well as Kshs 349.3 bn of externally,
- Debt Servicing Costs – Debt servicing cost has increased over the years mainly due to the continuous accumulation of external debt and the depreciation of the currency. Consequently, the higher cost of debt servicing has continued to put further pressure on debt sustainability and the Kenyan shilling. To keep with the payments and to maintain some of the borrowing covenants we have seen the government continue to increase taxation as it tries to keep up with its debt obligation,
- Short falls of Revenue collections – Though there has been a significant growth in tax revenues, the Kenya Revenue Authority (KRA) has consistently fallen short on its tax revenue targets, which has been complemented by increased borrowing both locally and from externally to plug the budget deficits increasing the country’s debt profile over time, and,
- Guaranteed loans by the Government of Kenya – The total state corporations guaranteed loans by the government as at December 2022 was Kshs 164.6 bn. Such guaranteed loans put pressure on the need for excessive spending, despite poor performances by the state corporation, resulting in borrowing to finance the loans.
Section 2: Kenya’s Debt Servicing Cost
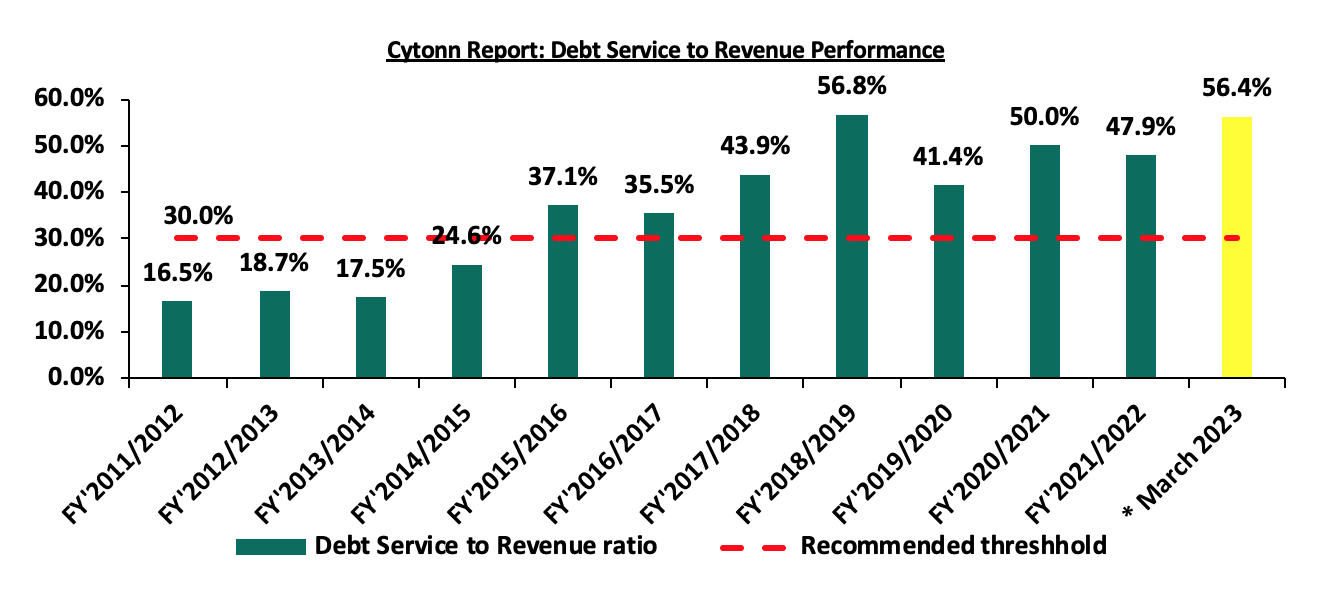
According to the National Treasury’s Annual Public Debt Management Report 2022, in FY’2021/2022, the total public debt service increased by 17.6% to Kshs 917.8 bn, from Kshs 780.6 bn in FY’2020/2021. Additionally, the debt service to revenue ratio was estimated at 47.9%, 17.9% points higher than IMF’s recommended threshold of 30.0%, but 2.1% points lower than 50.0% debt service to revenue ratio recorded in FY’2020/2021. The sustained high debt service to revenue ratio above the recommended threshold is a worrying sign. The debt servicing cost has continued to rise with the latest revenue and net expenditures for the nine months of FY’2022/2023, ending 31 March 2023, highlighting that debt servicing to total revenue stood at 56.4%. Below is a chart showing the debt service to revenue ratio for the last ten fiscal years:
Source: National Treasury
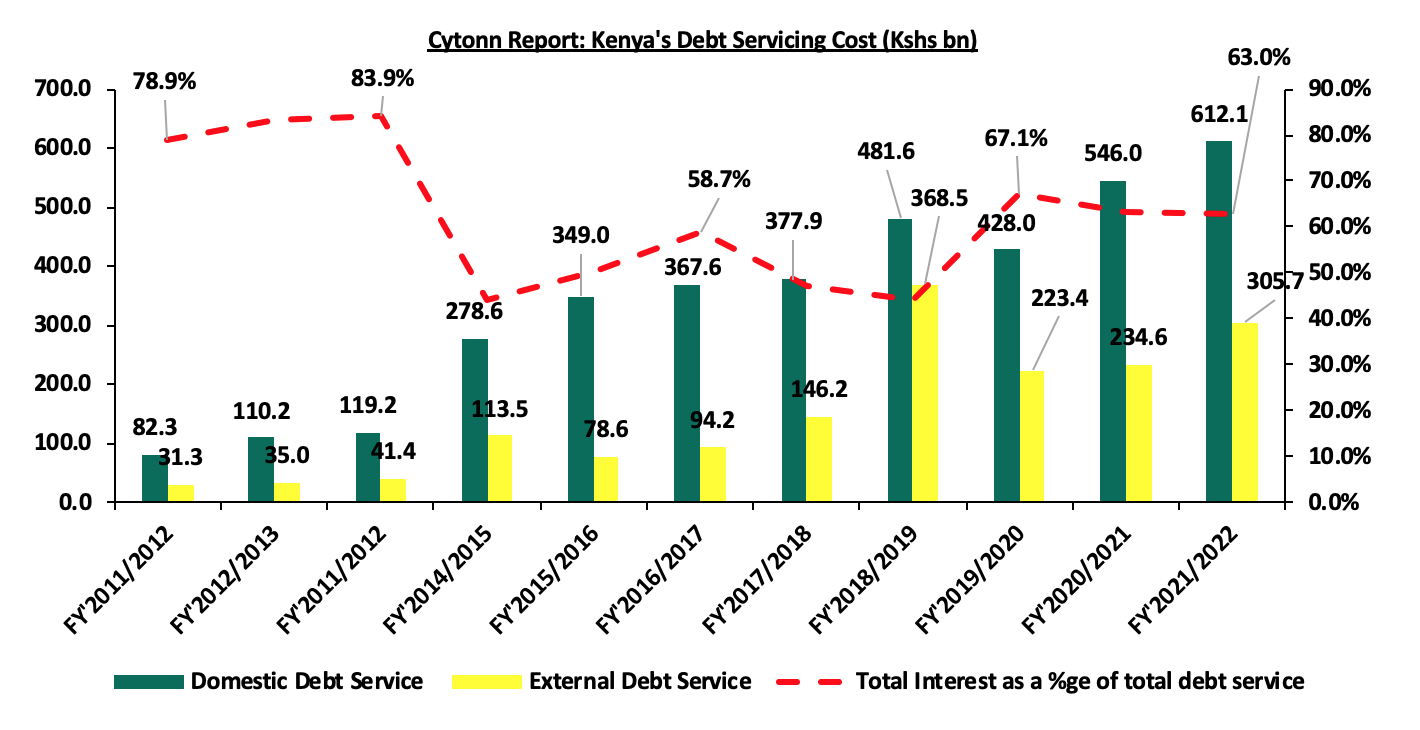
Kenya’s debt servicing costs have continued to increase over time growing at a 10-year CAGR of 23.2% to Kshs 917.8 bn in FY’2021/2022, from Kshs 113.6 bn in FY’2011/2012. The graph below compares the domestic debt servicing cost to the external debt servicing cost over the last ten fiscal years:
Source: National Treasury
The key take-outs from the chart include:
- Total debt service for the FY’2021/2022 stood at Kshs 917.8 bn, a 17.6% increase from Kshs 780.6 bn in FY’2020/2021. Domestic debt service remains the highest representing 66.7% of the total debt service while external debt service represented 33.3% in FY’2021/2022, and,
- Interest payments carry the bulk of Kenya’s debt servicing cost coming in at 63.0% in FY’2021/2022. Notably, for the domestic interest payments came in at Kshs 612.1 bn, while the external interest payment was Kshs 305.7 bn.
Section 3: Economic Consequences of High Debt Levels
The slowdown in economic growth on the back of geopolitical tensions, supply chain constraints, subdued business environment and elevated inflationary pressures have forced majority of the developing countries including Kenya to borrow more in order to cushion their economies. However, continued increase in borrowing has led to high accumulated debt level, with the following being some of the consequences on the Kenyan economy;
- High Cost of Debt Servicing - Elevated cost of debt servicing due to debt obligations in foreign currencies given the weakening local Currency, resulting to increased taxation as the government tries to meet its debt obligations,
- Elevated Cost of New Borrowings – High debt levels are likely to lead to increased cost of additional borrowing as lenders demand higher rates for new debts considering the heightened risk of debt distress which stifles the private sector and economic growth,
- Limited Fiscal Space –High debt levels in most cases lead to a narrow fiscal space hence reduced resources for undertaking further infrastructure and capital expenditure, and,
- Crowding Out of the Private Sector - Because of the increased domestic borrowing, the government crowds out the private sector which leads to a subdued private sector, subsequently impacting revenue collections.
Section 4: Kenya’s Debt sustainability analysis and outlook
As seen in the above section, the country’s risk of debt distress is extremely high as evidenced by the high debt service to revenue ratio of 47.9%. Additionally, Kenya’s debt to GDP ratio stood at 63.0% in 2022, 13.0% points above IMF’s recommended threshold of 50.0% for developing countries. We note that the growth of Public Debt at a 10-year CAGR of 17.7% to Kshs 9.1 tn in December 2022, has outpaced economic growth that has averaged at 4.5% for the last 10 years, with the International Monetary Fund (IMF) expecting Kenya’s 2022 GDP growth to come in at 5.4%. This points towards a high risk of debt distress as revenue alone might not be sufficient to service the accumulated public debt. The fiscal deficits resulting from the revenue-expenditure mismatch have also presented an ever present challenge in fiscal consolidation as revenue continues to lag behind expenditure.
Further, the recent downgrades by both Fitch and S&P credit agencies on the back of tightened liquidity and surging debt profiles affirms concerns that the level of borrowing needs a fresh relook. The downgrades of Kenya’s credit score by both Fitch and S&P Global have dimmed the country’s ability to access cheaper loans in the international financial markets despite upcoming debt maturities especially for the 2014 Eurobond issue. On 24 February 2023, S&P Global downgraded Kenya’s credit outlook to negative from stable, while Fitch Ratings on 14 December 2022, downgraded the country’s Long Term Foreign Currency issuer default ratings. Below is a summary of the credit rating on Kenya by various rating agencies:
|
Cytonn Report: Kenya Credit Rating Agencies Ratings |
||||
|
Rating Agency |
Previous Rating |
Current Rating |
Current Outlook |
Date Released |
|
Fitch Ratings |
B+ |
B |
Stable |
14th December 2022 |
|
S&P Global |
B |
B |
Negative |
24th February 2023 |
Source: Fitch Ratings, S&P Global
With the current macro-economic environment, the government’s ambition of projecting an increase in the revenue collection may not bear fruits hence the need for continuous borrowing is inevitable. The table below gives the trend of both expenditure and revenue growths in the last five financial years and projections in the medium term;
|
Cytonn Report: Public Debt (Kshs tn) |
|||||||
|
FY'2017/18 |
FY'2018/19 |
FY'2019/20 |
FY'2020/21 |
FY'2021/22 |
FY2022/23 |
FY2023/2024 |
|
|
Cumulative Domestic Debt |
2.5 |
2.8 |
3.2 |
3.7 |
4.3 |
4.7 |
5.2 |
|
Cumulative External Debt |
2.6 |
3.0 |
3.5 |
4.0 |
4.3 |
4.7 |
4.9 |
|
Total |
5.0 |
5.8 |
6.7 |
7.7 |
8.6 |
9.4 |
10.1 |
|
Expenditure |
2.1 |
2.4 |
2.6 |
2.8 |
3.0 |
3.4 |
3.7 |
|
Revenue Collected |
1.5 |
1.7 |
1.7 |
1.8 |
2.2 |
2.5 |
2.9 |
|
Budget Deficit |
0.6 |
0.7 |
0.8 |
1.0 |
0.8 |
0.9 |
0.8 |
|
Domestic Borrowings |
0.3 |
0.3 |
0.5 |
0.6 |
0.6 |
0.4 |
0.5 |
|
External Borrowings |
0.4 |
0.4 |
0.3 |
0.3 |
0.1 |
0.4 |
0.2 |
|
Total |
0.6 |
0.7 |
0.8 |
1.0 |
0.7 |
0.8 |
0.7 |
|
Domestic debt service |
0.4 |
0.5 |
0.4 |
0.5 |
0.6 |
0.8 |
0.8 |
|
External debt Service |
0.2 |
0.4 |
0.2 |
0.2 |
0.3 |
0.4 |
0.6 |
|
Total Debt Service |
0.6 |
0.9 |
0.7 |
0.8 |
0.9 |
1.2 |
1.5 |
|
Debt service to Revenue |
39.2% |
50.0% |
37.5% |
43.3% |
41.7% |
47.1% |
50.8% |
Source: National Treasury (Annual Public Debt Management Report and Budget Policy Statement)
Key take outs;
- Debt servicing costs is expected to remain high in the FY’2023/2024 due to the need for more borrowings at high cost. The high borrowings are to go towards, debt repayment, financing the increasing fiscal deficit as KRA lags behind target and increased debt repayment due to a depreciating currency
Our View: Despite debt service projected to grow albeit at a slower rate in FY’2022/2023 and FY’2023/2024, we expect the debt servicing cost will remain high due to upcoming Eurobond maturity worth USD 2.0 bn and continued local debt maturities,
- Revenue is expected to grow at a 5-year CAGR of 11.2% to Kshs 2.9 tn by the end of FY’2023/2024, from Kshs 1.7 tn in FY’2018/2019, attributable to the governments focus to increased tax revenues. However, given the subdued business environment, coupled with elevated inflationary pressures and tightened liquidity in the country, revenue collections are expected to fall short of the projection. As a result, revenue collection is largely pegged on economic performance of the country as well as how soon the general business environment will improve,
- Expenditure is expected to grow at a relatively slower 5-year CAGR of 8.5% to Kshs 3.7 tn by the end of FY’2023/2024, from 2.4 tn recorded in FY’2018/2019, on the back of increased recurrent expenditure, accelerated currency depreciation and persistent current account deficit, and,
- The budget deficit is expected to widen in the projected years due to a mismatch in revenue against expenditure growths despite revenue projected to increase at a faster rate compared to expenditure. The persistent budget deficit in the projected financial years, is an indication of the need for further borrowing. This will impede the government’s effort to try and sustain the current debt level.
It is clear that the government faces challenges on how they shall finance their operations in the next couple of months as the debt servicing is high and the economic activity is much slower. The KRA collection in the first nine months of the FY’2022/2023, lagged behind with the government having collected Kshs 1.4 tn (equivalent to 88.1% prorated revenue target of Kshs 1.6 tn) as the end of March 2023, mainly on the back of the tough macroeconomic situation in the country. The situation is exacerbated by the tightened liquidity that currently stands at 8.5% in the local market as of 14th April 2023 amidst the deteriorated business environment. Additionally, despite the government’s announcement to cut down expenditure by Kshs 300.0 bn in FY’2022/2023, currently, a total of Kshs 2.1 tn had been spent as at March 2023, surpassing the Kshs 1.4 revenue collected. Further, the weakening of the Kenyan shilling has increased the cost of repaying foreign loans. As a result, concerns remain high on the government’s ability to repay its upcoming maturities as well as to sufficiently pay its debt obligations.
Section 5: Conclusions and Recommendations
Despite the heightened debt sustainability concerns, we commend the government on the continuous efforts to boost revenue collection but we believe a lot needs to be done. Below are some actionable steps that the government can take to reduce the debt overhang as well as mitigate the risk of debt distress;
- Enhance Fiscal Consolidation – High fiscal deficit is attributable to higher growth in expenditure volumes relative to revenue collections, creating the need for excessive borrowing levels. The government needs to implement robust fiscal consolidation through expenditure reduction by introducing austerity measures and limit capital expenditure to projects with either high social impact or have a high Economic Rate of Return (ERR), and high economic benefits outweighing costs,
- Promote Capital Markets - The government should channel efforts towards strengthening the Capital Markets structure to ease the pooling of funds by investors to undertake development projects. Key to note, Kenya’s capital market remains underfunded and overshadowed with banking markets having mobilized Kshs 4.4 tn in deposits compared to Collective Investment Schemes at only Kshs 0.2 tn as at September 2022, hence the need to increase support to the sector,
- Reduce the recurrent expenditure - Currently, the mix of recurrent to development expenditure in Kenya is 76:24 as at December 2022. There is need to reduce the portion of recurrent expenditure, which majorly encompasses public wages. This will in effect reduce the overall expenditure basket, freeing up the debt level.
- Improving the Country’s Exports – The government should formulate export and manufacturing favorable policies to improve the current account. This would stabilize the exchange rate and stop our foreign denominated debt from increasing as the shilling depreciates,
- Implementation of Private Public Partnerships (PPPs) – The government should fully implement Private Public Partnerships (PPPs) and joint ventures to attract more private sector involvement in funding development projects such as infrastructure, and thus reduce the need for borrowing
- Better governance and accountability – Better governance will help to reduce wastage and corruption levels that had impeded proper allocation of funds towards designated projects, resulting in misappropriation of funds, and,
- Privatization of State Parastatals - The government should privatize poorly performing parastatals as discussed in our Cytonn Weekly #12/2023 to release capital, lower debt and also to prevent the widening of debt from losses and inefficiencies.
Disclaimer: The views expressed in this publication are those of the writers where particulars are not warranted. This publication, which is in compliance with Section 2 of the Capital Markets Authority Act Cap 485A, is meant for general information only and is not a warranty, representation, advice or solicitation of any nature. Readers are advised in all circumstances to seek the advice of a registered investment advisor.


