Kenya is one of the fastest growing economies in Sub-Saharan Africa, having registered a growth rate of 5.4% in the second quarter of 2023. However, the country also faces significant challenges in managing its public debt, which has increased rapidly in recent years. According to the latest data from the Central Bank of Kenya (CBK), the total public debt stood at Kshs 10.2 tn as of June 2023, compared to Kshs 8.6 tn recorded in June 2022. This has in turn increased the debt to GDP ratio to 70.2% as of June 2023, 20.1% points higher than the International Monetary Fund (IMF) threshold of 50.0% for developing countries, up from the 66.7% recorded in June 2022. The public debt comprises both external and domestic debt, where the ratio of the external debt to domestic debt remains high at 54.3% to 45.7% as of September 2023. The government has been working on trimming the domestic borrowing so as to ease the pressure on interest rates, with the short-day papers all crossing the 15.0% mark in the current auction results. The reduction in local borrowing is also meant to address the private sector crowding out. The main sources of external debt are multilateral and bilateral creditors, while the main instruments of domestic debt are Treasury bonds and Treasury bills. Likewise, the debt service to revenue ratio has increased over the period to 64.3% as of September 2023, 34.3% points higher than the IMF threshold of 30.0%. Notably, the debt service to revenue ratio hit an all-time high of 101.4% as of July 2023, indicating how debt servicing continues to weigh on the government’s expenditure.
The rising public debt has raised concerns about its sustainability and implications for fiscal and macroeconomic stability. With the upcoming maturity of the USD 2.0 bn Eurobond in June 2024, there are concerns whether the government will meet the debt repayment. This is as the public debt situation continues to deteriorate on the back of high fiscal deficits, and the depreciation of the Kenyan Shilling, which has depreciated by 21.4% on a year to date basis, given that 67.1% of Kenya’s external debt is USD denominated, thus putting more pressure on debt servicing. This has been worsened by the conflict in Eastern Europe, which has raised the expenditure on imports; and the adverse effects of climate change have worsened the fiscal position and debt vulnerability of Kenya.
We have been tracking the evolution of the public debt and below are the most recent topicals we have done on Kenya’s debt:
- Kenya's Public Debt Review 2023: Is Kenya's Public Debt Level Sustainable- In April 2023, we highlighted the state of affairs concerning the country’s public debt and concluded by discussing strategies that the government could implement in order to reduce the economic consequences of high debt levels as well as mitigate the high risk of debt distress,
- Kenya’s Public Debt 2022; Debt Service Coverage- In July 2022, In December 2016, we wrote about Kenya’s debt level, questioning its sustainability, and concluded that the government needed to reduce the amount of public debt, giving suggestions as to how this could be achieved, and,
- Kenya’s Public Debt: On a path to Distress?- In October 2021, we highlighted the state of affairs concerning the country’s public debt profile and levels and concluded that Kenya’s risk of debt distress remained elevated.
In this week’s topical, we shall focus on the current status of Kenya’s public debt as at the end of the first quarter of the FY’2023/2024. We shall look at what are the economic consequences resulting from high debt levels. We shall also give our outlook on the country’s debt sustainability given upcoming USD 2.0 bn Eurobond maturing in June 2024. The report also compares Kenya’s public debt situation with other sub-Saharan countries, using various indicators such as the debt-to-GDP ratio, and the debt service-to-revenue ratio.
This we shall cover as follows;
- The Current State of Kenya’s Public Debt,
- Kenya’s Debt Servicing Cost,
- Economic Consequences of high Debt levels,
- Kenya’s Debt sustainability analysis and projection, and,
- Conclusion and Recommendations.
Section 1: The Current State of Kenya’s Public Debt
According to the Central Bank’s Quarterly Economic Review Report for Q2’2023, Kenya’s public debt stood at Kshs 10.2 tn, (equivalent to 70.2% of GDP) as of June 2023, an 18.8% increase from the Kshs 8.6 tn (66.2% of GDP) recorded in June 2022. Amidst the government’s fiscal consolidation efforts by broadening the tax revenue base and minimizing non-priority expenditures, the public debt to GDP ratio is projected to slightly decline to 60.0% in 2023. However, we expect the government efforts to be impeded by the deteriorated macroeconomic environment as evidenced by the decline in Purchasing Manager’s index to 47.8 in September 2023, down from 50.6 in August 2023, resulting from the high inflationary pressures following a hike in fuel prices, aggressive currency depreciation, and slower economic growth which is expected to stifle revenue collection. Below is a graph highlighting the trend in the Kenya’s debt to GDP ratio over the last 10 years:
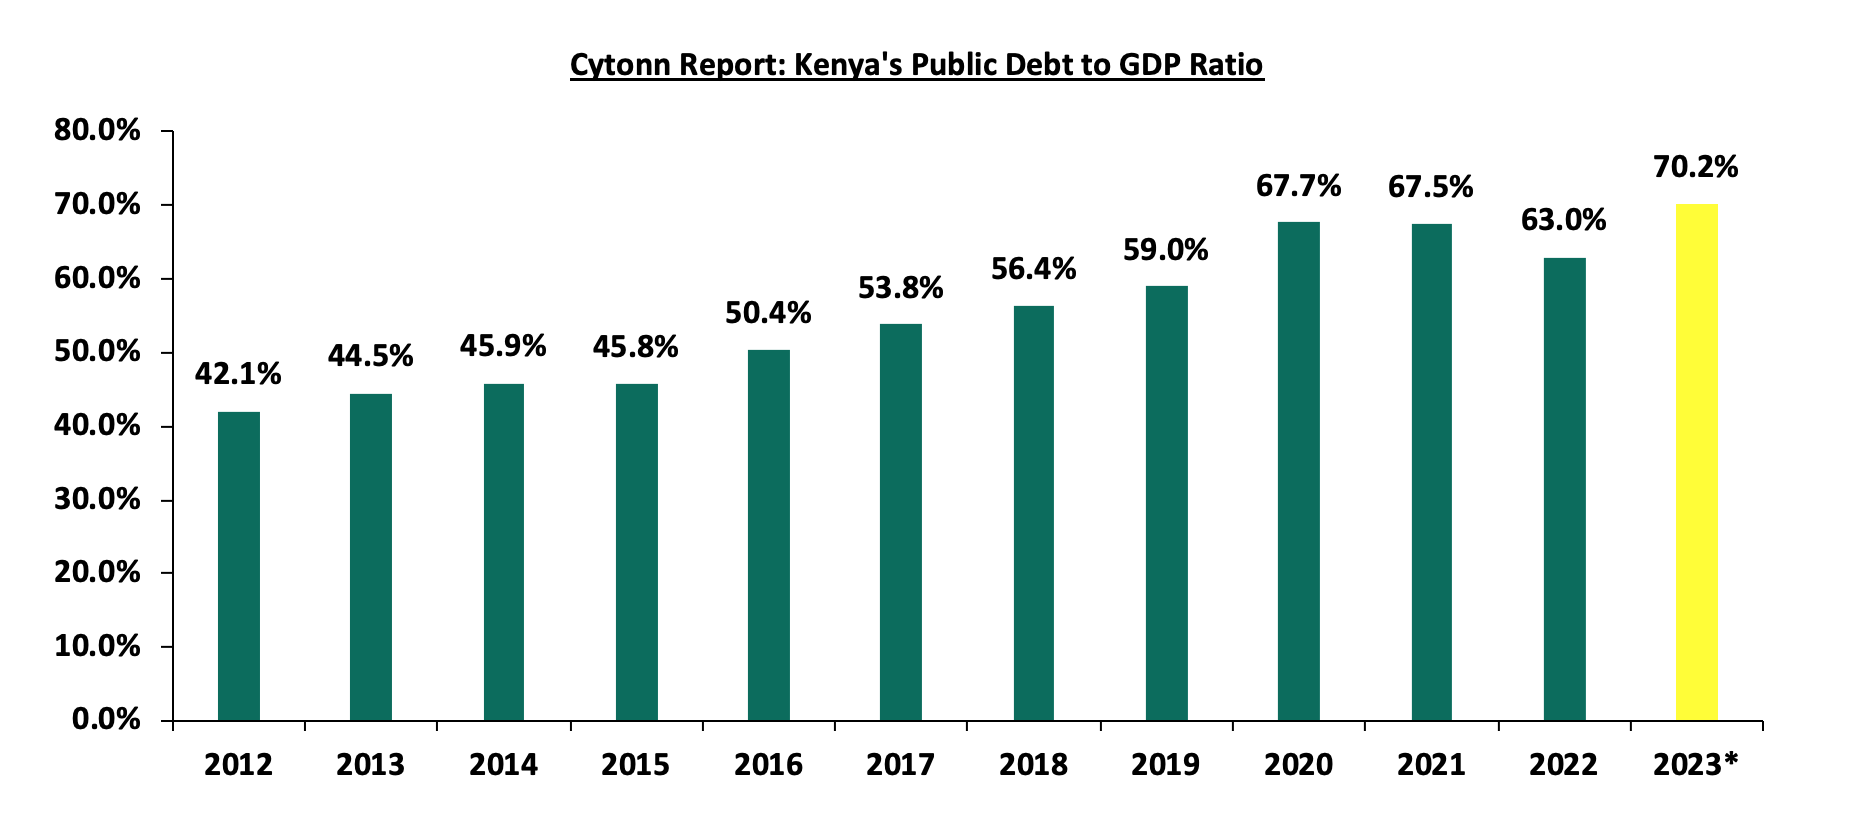
Source: National Treasury, *Data as of June 2023
Kenya’s debt level has been on the rise due to the continued growth in fiscal deficits over the years, averaging 7.6% of the GDP for the last 9 financial years, driven by the sustained recurrent expenditure and a focus on development projects. Over a ten-year period, the growth in government revenue registered a 10-year CAGR of 11.2% to Kshs 2.4 tn as at the end of FY’2022/23, from Kshs 0.8 tn at the end of FY’2012/13. This outpaced the growth of government expenditure at a 10-year CAGR of 9.5% to Kshs 3.1 tn at the end of FY’2022/23, from Kshs 1.3 tn at the end of FY’2012/13. The chart below shows the growth in Kenya’s total revenue and expenditure in the last 10 fiscal years:
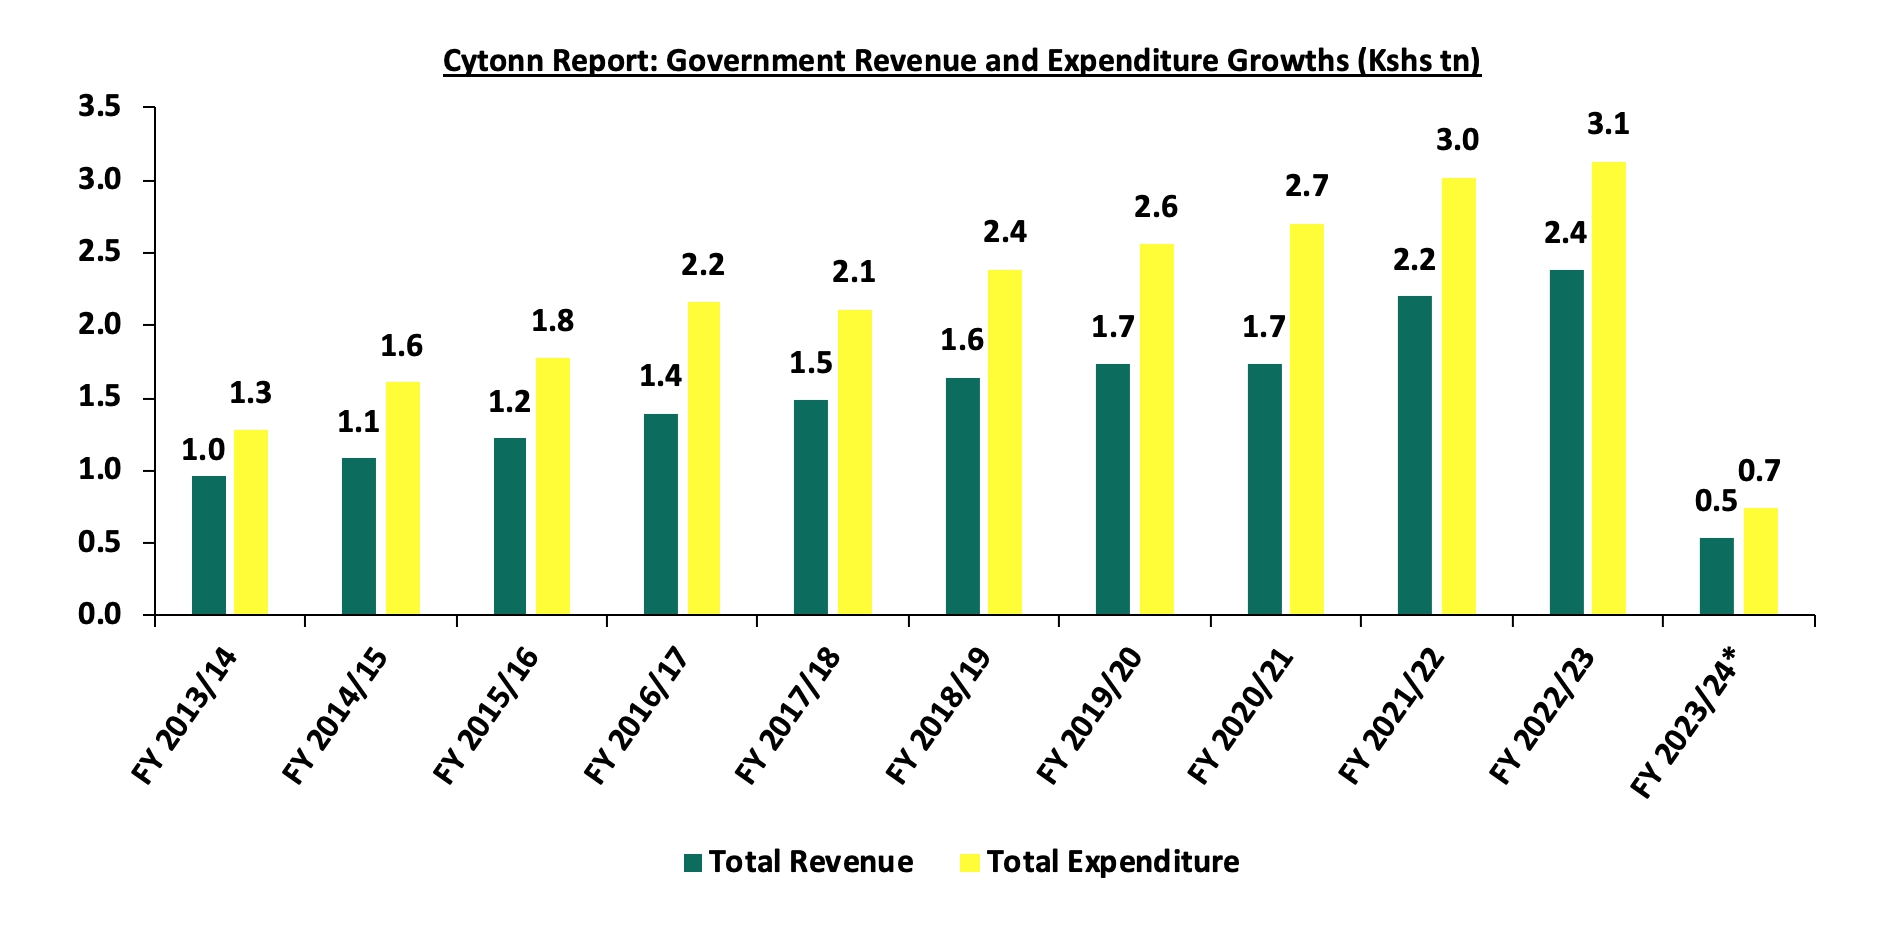
Source: Central Bank of Kenya, *Data as of September 2023
- The Nature of Kenya’s Debt Composition (Domestic vs External)
Over the years, Kenya’s debt composition has been evenly distributed between domestic and external borrowing. However, since the beginning of 2023, there has been a shift towards external borrowing with the proportion of external debt against domestic debt standing at 54.3% to 45.7% in September 2023, compared with 49.8% to 50.2% observed over a similar period in 2022. The shift has been brought about by the government’s revision of its domestic borrowing target for the FY202/24 from the initial Kshs 586.5 bn to Kshs 316.0 bn, a move aimed at mitigating the upward pressure on the domestic borrowing rates while at the same time bolstering foreign reserves by increasing the government’s efforts on sourcing for bilateral and multilateral funding. Notably, external debt increased at a 10-year CAGR of 20.5% to Kshs 5.7 tn as at August 2023, from Kshs 0.9 tn in August 2013, higher than the 15.7% CAGR recorded by domestic debt to Kshs 4.8 tn as at August 2023 from Kshs 1.1 tn in August 2013. Below is a graph highlighting the trend in the external and domestic debt composition over the last 10 years;
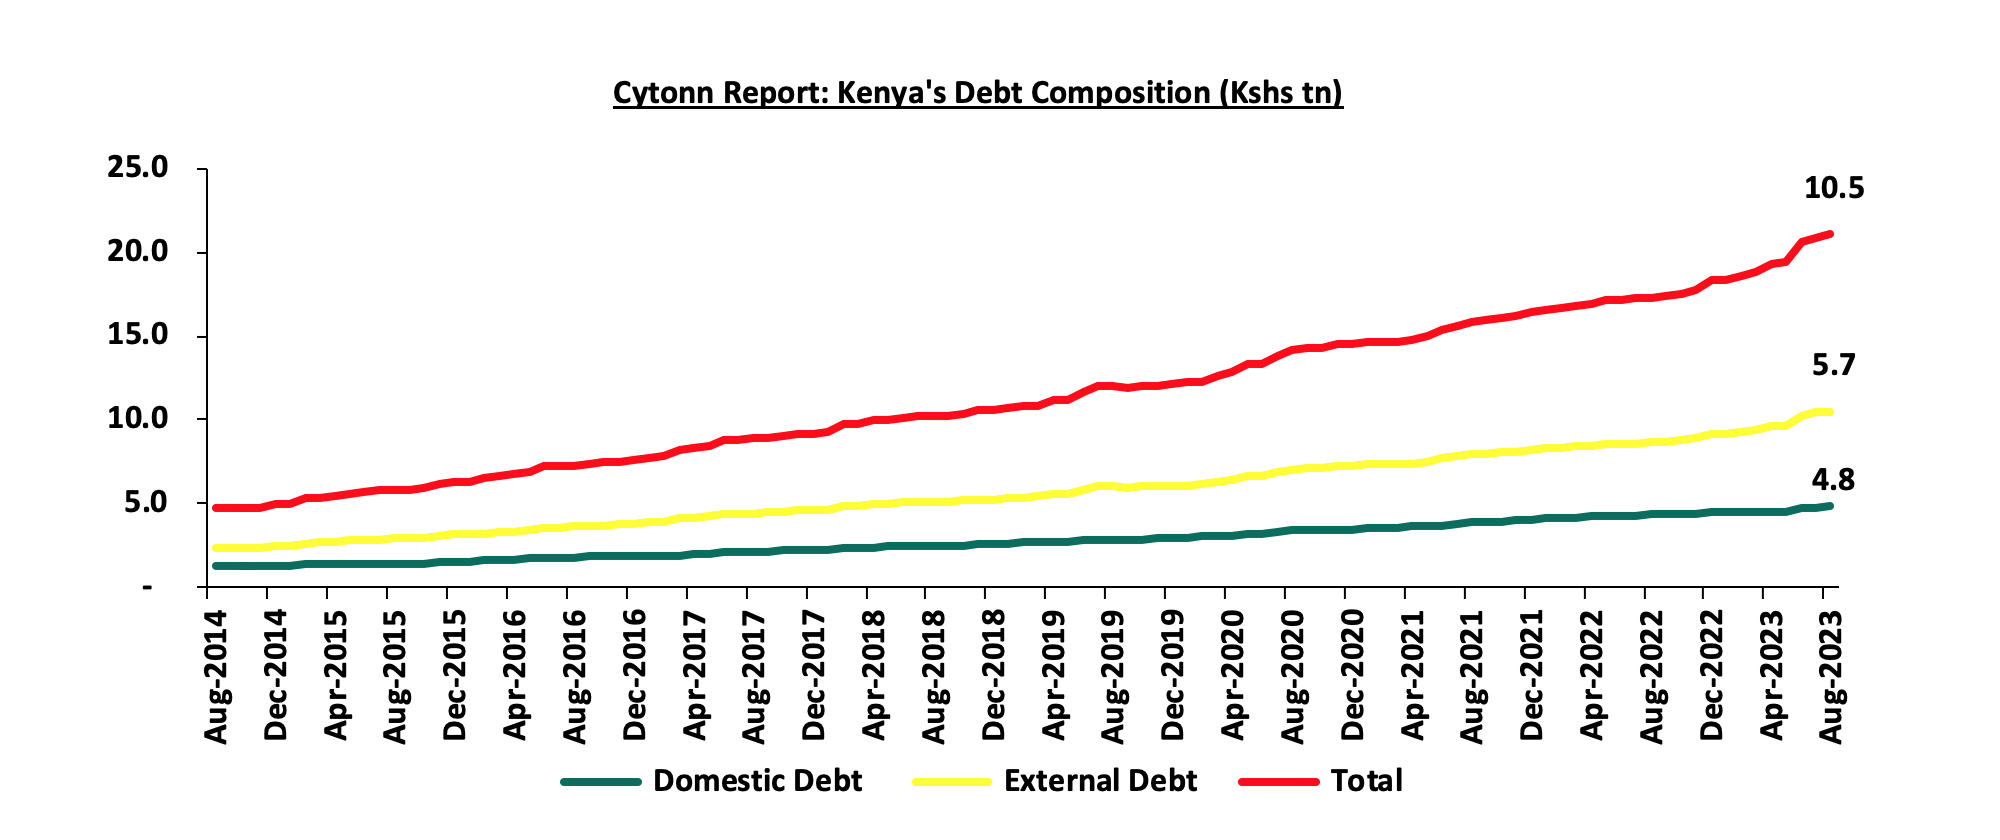
Source: National Treasury and Central Bank of Kenya
Below is a graph highlighting the composition of domestic and external debt as a percentage of total public debt over the last 10 years:
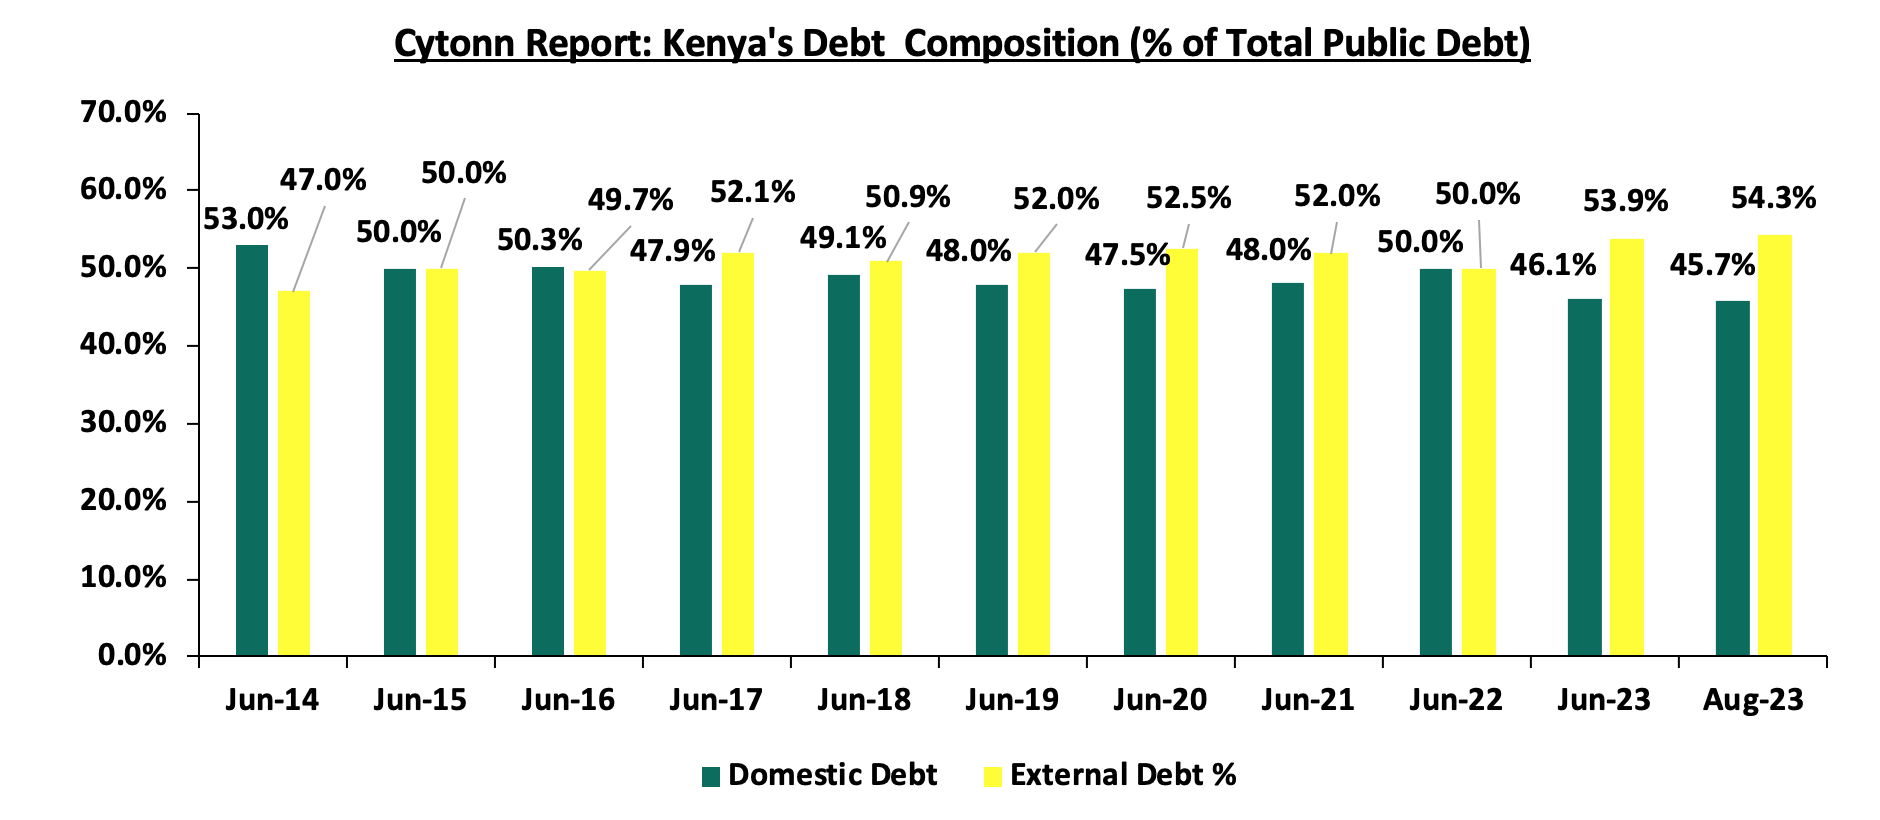
Source: National Treasury and Central Bank of Kenya
- Public Debt Mix by Holders
- External Debt Composition by Holders (Bilateral, Multilateral, and Commercial Banks)
Kenya’s external debt stock is mainly composed of multilateral loans, bilateral loans and commercial loans. In FY’2022/23, Kenya’s exposure to multilateral loans recorded a significant growth, attributable to favourable terms offered in terms of low interest rates and longer repayment periods, when compared to bilateral loans and commercial loans. Notably, during the FY’2022/23, Kenya has been unable to issue new Eurobonds due to the increased interest rates making borrowing expensive in the international finance market. The rising Eurobond yields are a result of the heightened perceived risk stemming from economic uncertainties and debt sustainability concerns especially in the Sub-Saharan Africa region with Kenya and Ethiopia facing Eurobond maturities in 2024. The chart below shows external debt composition by Creditors:
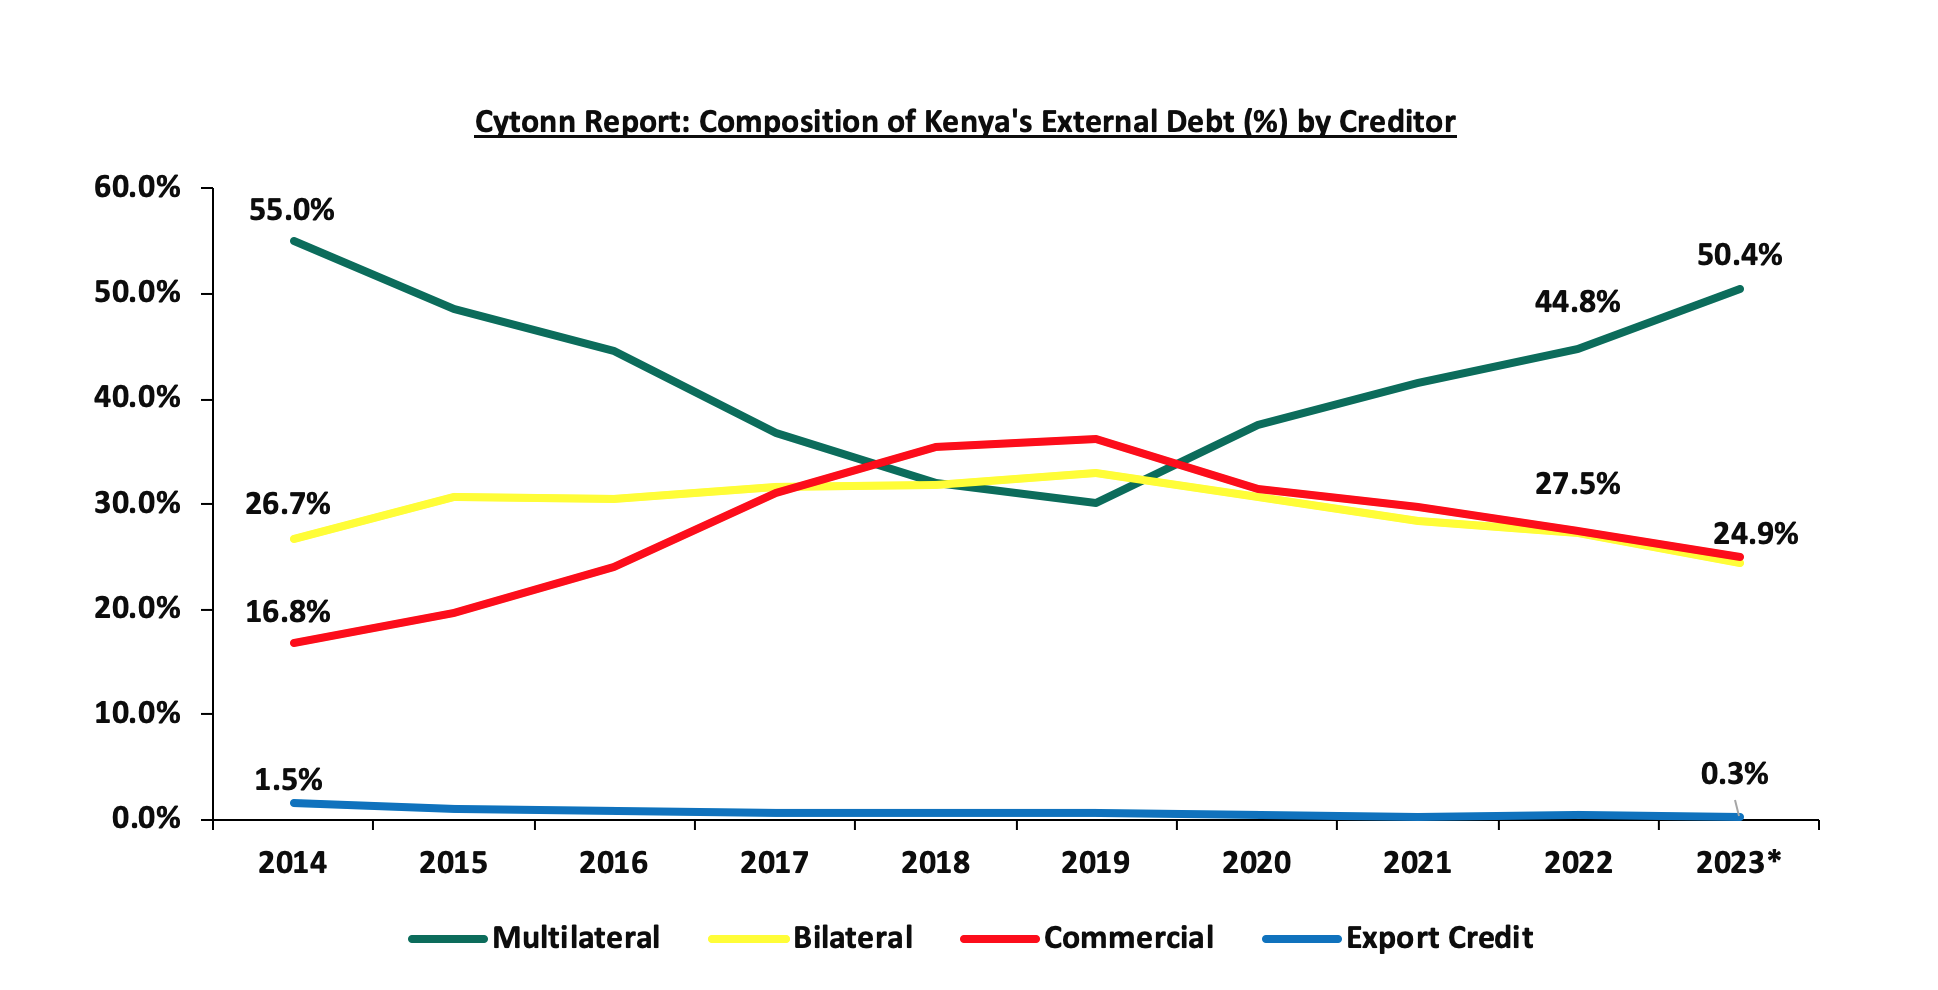
Source: National Treasury, *Provisional value as at June 2023
It is key to note that:
- The portion of multilateral debt increased by 5.6% points to 50.4% in June 2023, from 44.8% recorded over a similar period in 2022, due to loans worth USD 1.0 bn (Kshs 138.6 bn) under the Development Policy Operation (DPO) from the World Bank and a total of USD 415.4 mn (Kshs 58.9 bn) from the IMF under the Extended Credit Facility arrangement (EFF/ECF) for budgetary support during the period. This was in addition to the USD 551.4 mn (Kshs 78.1 bn) approved under the Resilience and Sustainability Facility (RSF), following the completion of IMF’s fifth review of the 38-months Extended Fund Facility (EFF) and Extended Credit Facility (ECF) financing. Notably, Bilateral debt decreased by 2.9% points to 24.4% in June 2023, from 27.3% in June 2022,
- Commercial debt as a percentage of external debt reduced by 2.6% points to 24.9% of total external debt in June 2023 from 27.5% in June 2022, mainly attributable to Kenya’s government shunning away from the more expensive debt due to the prevailing market conditions. Notably, Kenya secured a medium-term commercial loan amounting to USD 500.0 mn (Kshs 69.6 bn) in July 2023 from a syndicate of global banks consisting of American Citibank, British Standard Chartered Bank, Stanbic Bank, and South Africa’s RMB Holdings Ltd, and,
- According to the CBK Quarterly Economic Review as at June 2023, 67.1% of the external debt was US Dollar denominated contributing to the increasing debt servicing cost given the shilling’s continuous depreciation having lost against the USD by 21.4% since the year began. The table below shows currency composition of the external debt stock:
Cytonn Report: Currency composition of the External Debt Stock (%)
Currency
June-2022
June-2023
USD
67.9%
67.1%
EUR
18.6%
21.3%
Yen
5.7%
3.9%
Yuan
5.3%
5.1%
GBP
2.3%
2.3%
Other Currencies
0.2%
0.2%
Source: Central Bank of Kenya
- Domestic Debt Composition by Holders
Banking institutions make up for the highest percentage of domestic debt, accounting for 45.2% of government securities holdings as at 13th October 2023, albeit 2.5% points lower than the 47.7% share recoded over a similar period in 2022, with the reduction mainly attributed heightened credit risk in the market due to the upcoming Eurobond maturity in 2024. On the other hand, government securities holding by other domestic investors registered a 3.3%-points increase to 9.6% as at 13th October 2023, from the 6.3% recorded over a similar period in 2022. Notably, pension funds accounted for the second largest portion with 31.9% of holdings in government securities as at 13th October 2023, albeit 0.7% points lower than the 32.6% registered the previous year. Below is a table of the composition of government domestic debt by holders:
|
Cytonn Report: Composition of Government Domestic Debt by Holder |
|||||||||||
|
Domestic debt |
Dec-13 |
Dec-14 |
Dec-15 |
Dec-16 |
Dec-17 |
Dec-18 |
Dec-19 |
Dec-20 |
Dec-21 |
Dec-22 |
Oct-23 |
|
Banking institutions |
49.2% |
54.3% |
55.4% |
52.2% |
54.6% |
54.5% |
54.3% |
53.3% |
50.2% |
46.8% |
45.2% |
|
Insurance Companies |
10.2% |
9.9% |
8.4% |
7.3% |
6.4% |
6.1% |
6.4% |
6.4% |
6.8% |
7.4% |
7.3% |
|
Parastatals |
3.5% |
2.8% |
4.6% |
5.8% |
6.9% |
7.3% |
6.5% |
5.7% |
5.6% |
6.1% |
6.0% |
|
Pension Funds |
26.1% |
23.9% |
25.4% |
28.2% |
27.5% |
27.6% |
28.6% |
30.3% |
31.3% |
33.3% |
31.9% |
|
Other domestic investors |
11.0% |
9.0% |
6.2% |
6.5% |
4.6% |
4.6% |
4.2% |
4.3% |
6.1% |
6.4% |
9.6% |
|
TOTAL |
100.0% |
100.0% |
100.0% |
100.0% |
100.0% |
100.0% |
100.0% |
100.0% |
100.0% |
100.0% |
100.0% |
Source: Central Bank of Kenya
- GDP per Capita vs Debt per Capita
According to Central Bank data, Kenya’s Public Debt per Capita has increased at a 10-year CAGR of 15.2% to Kshs 169,283.9 in 2022, from Kshs 41,011.0 in 2012. On the other hand, GDP per Capita has grown at a slower 10-year CAGR of 8.6% to Kshs 249,558.2 in 2022, from Kshs 109,024.7 in 2012, implying that the increase in debt being incurred is not directly translating into economic growth. The chart below compares Kenya’s GDP per capita to the debt per capita over the last 10 years:
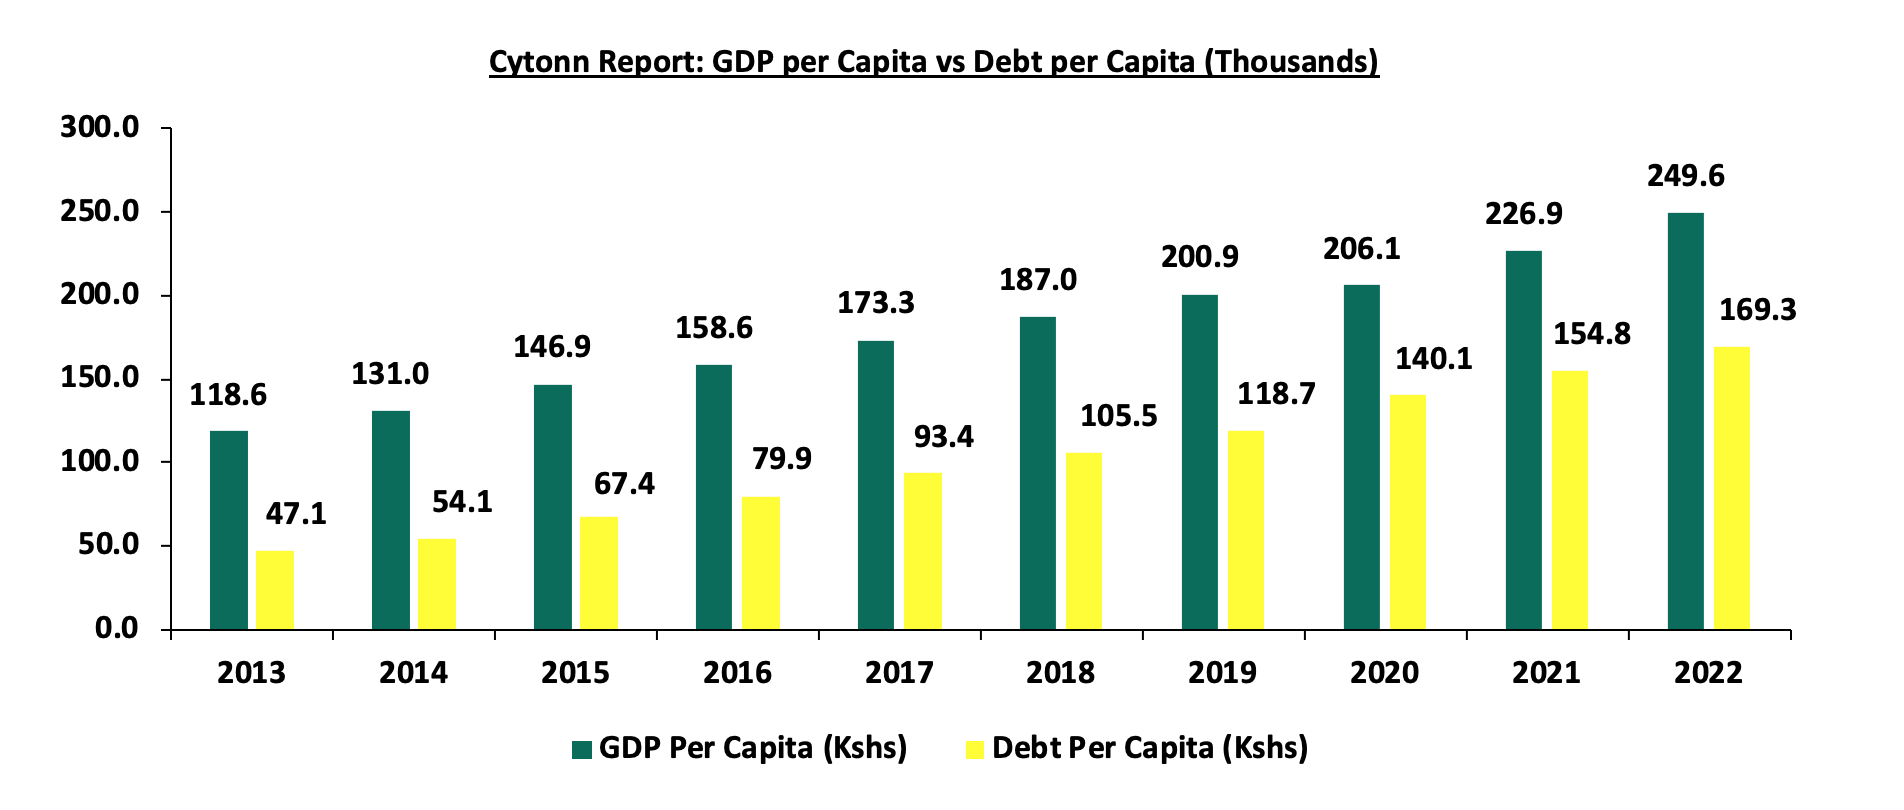
Source: World Bank, CBK
Factors that have accelerated the growth in Kenya’s Public debt;
- Fiscal Deficit – Kenya has witnessed a persistent fiscal deficit averaging at 7.6% of the GDP for the last 9 financial years and is projected to ease to 4.4% of the GDP at the end of FY’2023/24, from the 5.7% recorded in FY 2022/23. According to Budget Policy Statement FY'2023/24 released by the controller of budget, the approved budget for the FY’2023/24 is projected to be Kshs 3.7 tn against a targeted revenue collection of Kshs 2.9 tn, hence the need to borrow an additional Kshs 0.3 tn domestically and Kshs 0.5 tn of externally,
- Debt Servicing Costs – Debt servicing cost has been on the rise, with the debt service to revenue ratio averaging 41.2% over the last 10 financial years and standing at 64.3% as of September 2023. The rising debt servicing cost is attributed to the continuous accumulation of external debt and the depreciation of the currency,
- Short falls of Revenue collections – Despite the significant growth in tax revenues, the Kenya Revenue Authority (KRA) has consistently fallen short on its tax revenue targets, with the tax collections for FY'2022/23 increasing by 6.6% to Kshs 2.2 tn from Kshs 2.0 tn in FY’2021/22, albeit short of the Kshs 2.3 tn target. To plug the budget deficits, the government has had to borrow externally and also from the domestic market thereby increasing the country’s debt profile over time, and,
- Guaranteed loans by the Government of Kenya – The national government incurred Kshs 12.3 bn guaranteed debt payment on behalf of Kenya Airways (KQ) during FY’2022/23. As a consequence, guaranteed loans on state corporations put pressure on the need for excessive spending, the despite poor performances by the said state corporations.
Section 2: Kenya’s Debt Servicing Cost
According to the Revenue and Net Expenditures Report for the FY’2022/23 by the National Treasury, the cumulative public debt servicing cost amounted to Kshs 1,161.6 bn which was 83.9% of the revised estimates of Kshs 1,385.1 bn, and 83.4% of the original estimates of Kshs 1,393.1 bn. Notably, the Kshs 1,161.6 bn debt servicing cost was equivalent to 56.8% of the actual revenues collected as at the end of FY’2022/23, which was 26.8% points above IMF’s recommended threshold of 30.0%. Similarly, according to the National Treasury’s Annual Public Debt Management Report 2022, the debt service to revenue ratio was estimated at 47.9% for the FY’2022/23 which was 2.1% points lower than 50.0% debt service to revenue ratio recorded in FY’2020/21. The sustained high debt service to revenue ratio above the recommended threshold is a worrying sign. A ratio approaching 50.0% means that nearly half of the government's revenue is being allocated to servicing debt which may leave limited fiscal space for public investments, social programs, and other critical government functions, which are essential for the long-term well-being of country. Notably, the debt servicing cost has continued to rise with the latest revenue and net expenditures for the three months of FY’2023/2024 ending 30th September 2023, highlighting that debt servicing to total revenue stood at 64.3%. Below is a chart showing the debt service to revenue ratio for the last ten fiscal years:
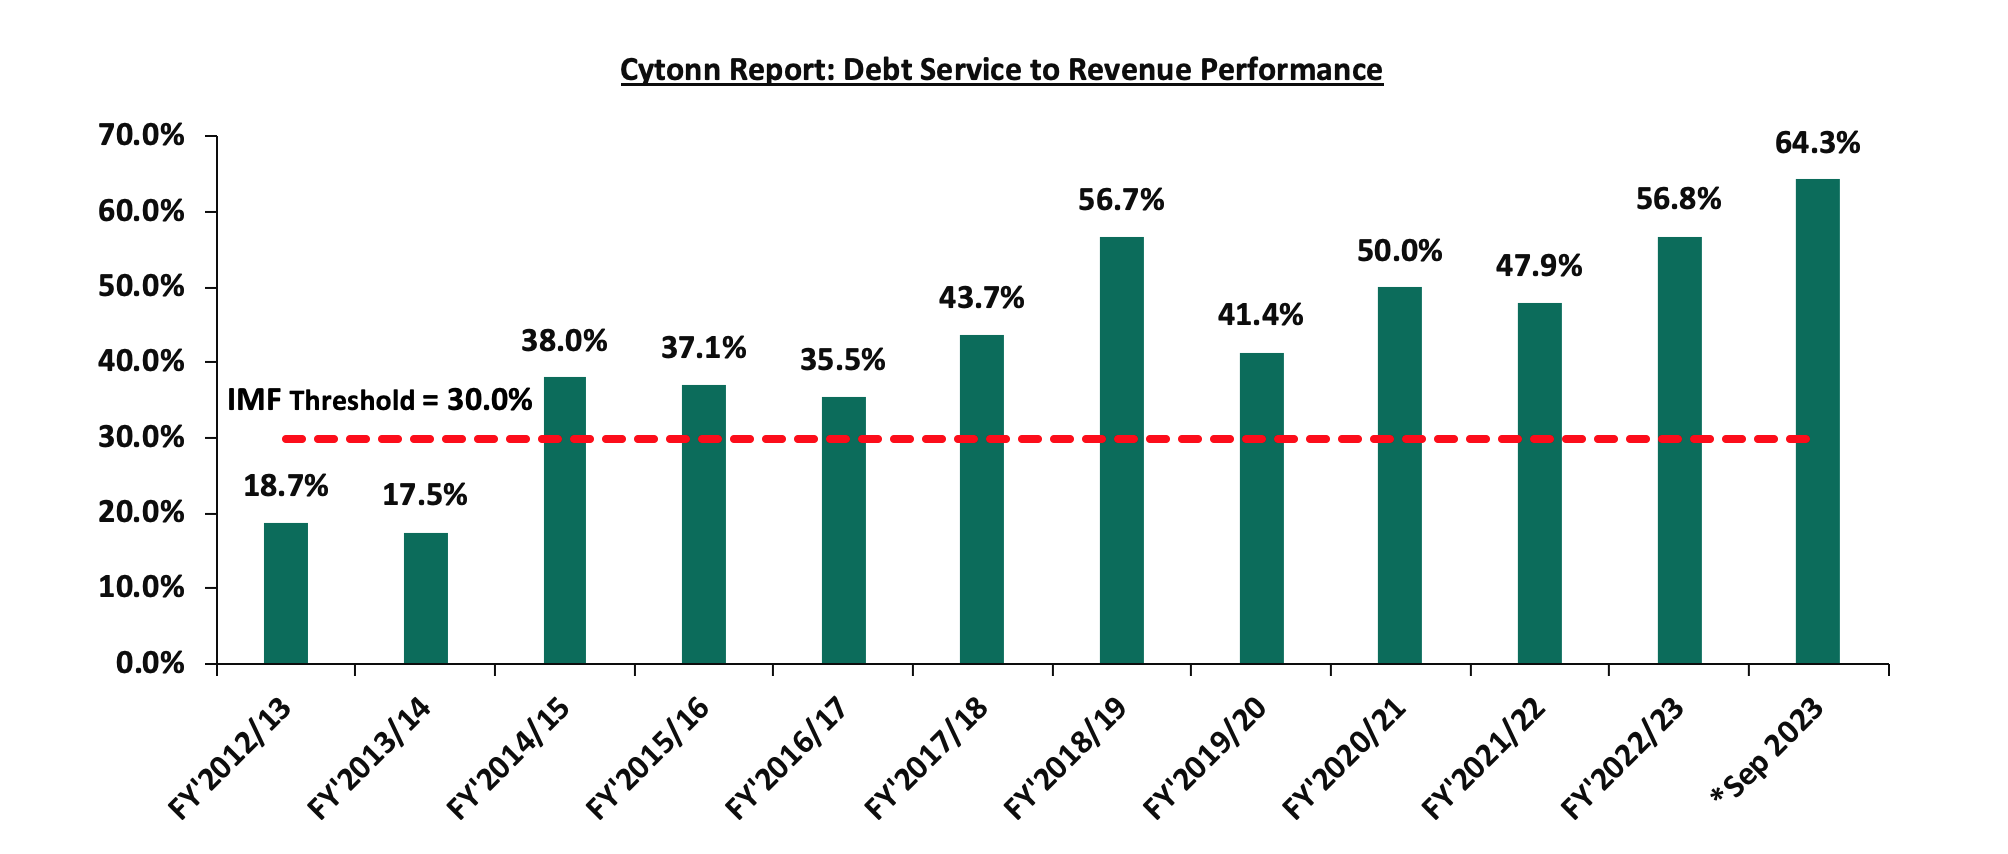
Source: National Treasury
Kenya’s debt servicing costs have continued to increase over time growing at a 10-year CAGR of 23.2% to Kshs 917.8 bn in FY’2021/2022, from Kshs 113.6 bn in FY’2011/2012. The graph below compares the domestic debt servicing cost to the external debt servicing cost over the last ten fiscal years:
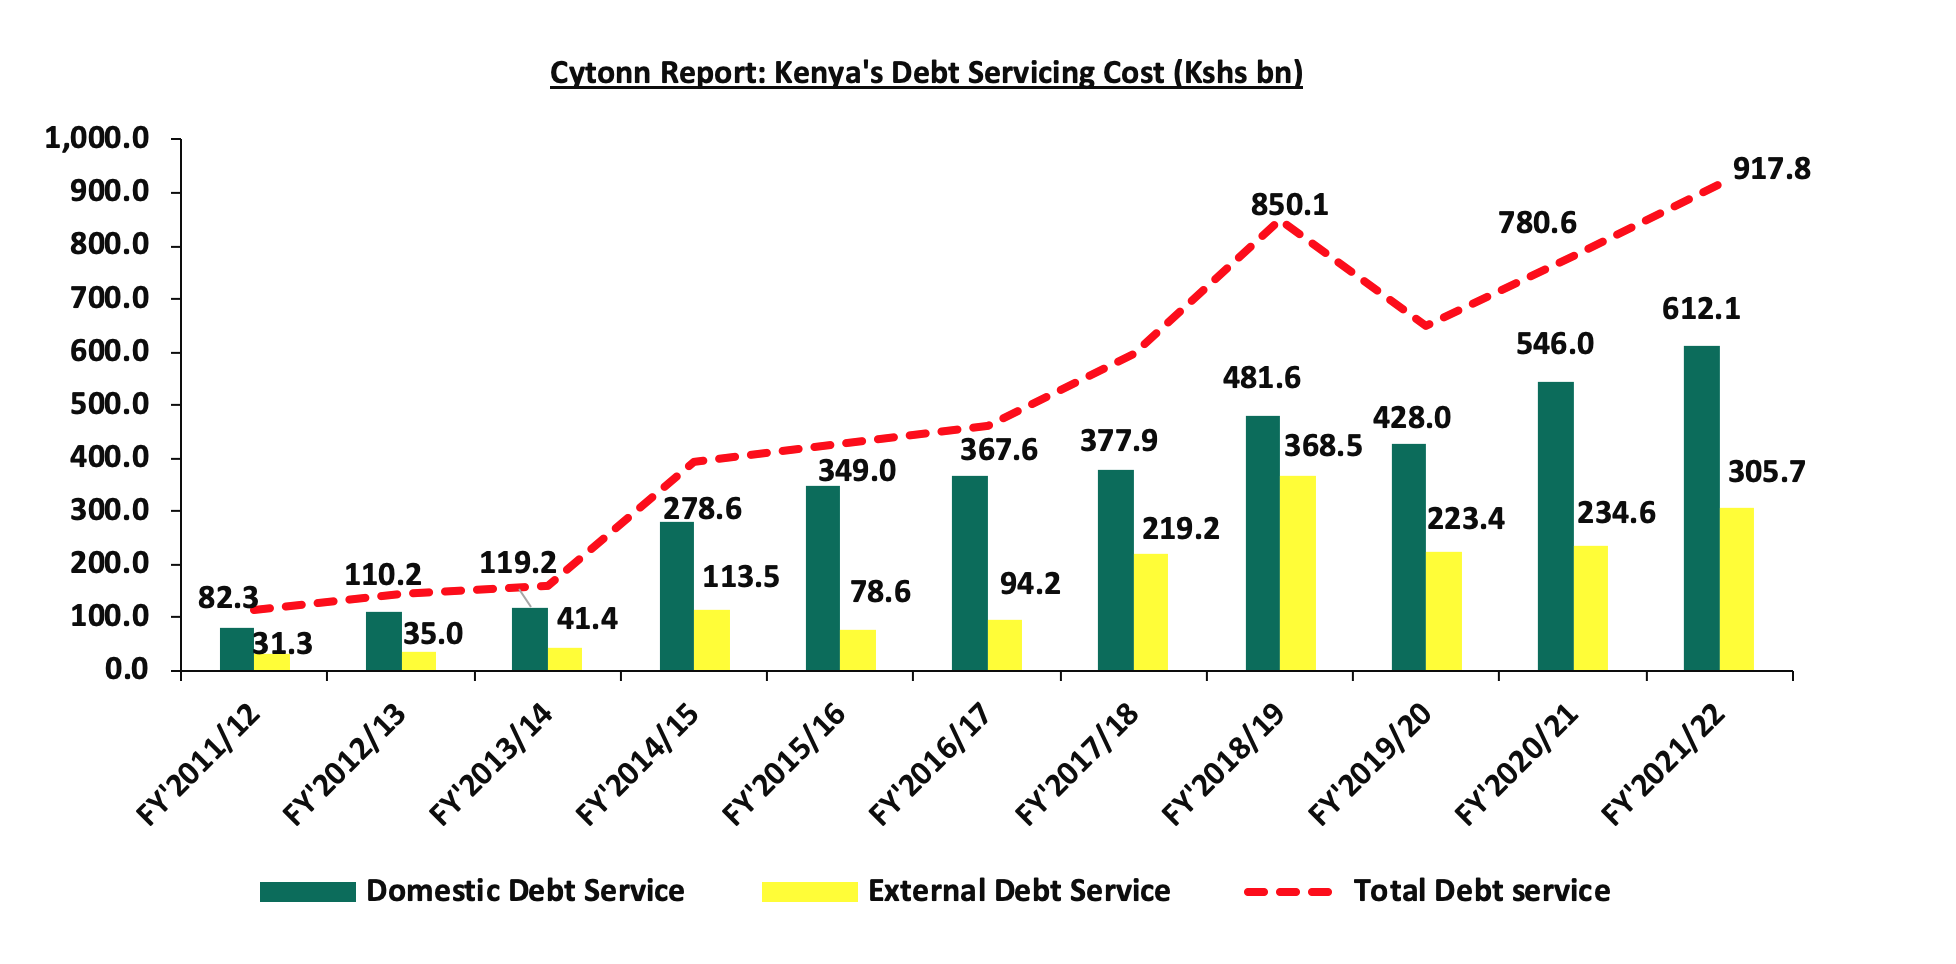
Source: National Treasury
The key take-outs from the chart include:
- Total debt service for the FY’2021/22 stood at Kshs 917.8 bn, a 17.6% increase from Kshs 780.6 bn recorded in FY’2020/21. Domestic debt service took the largest share, accounting for 66.7% of the total debt service while external debt service represented 33.3% in FY’2021/22, and,
- Interest payments made up the bulk of Kenya’s debt servicing costs coming in at 63.0% in FY’2021/2022. Notably, the domestic interest payments came in at Kshs 612.1 bn, while the external interest payment was Kshs 305.7 bn.
Section 3: Economic Consequences of High Debt Levels
The COVID-19 pandemic left many countries in sub-Saharan Africa struggling with a weak global economy, rising prices, expensive loans, and a high cost of living. Many of them still face challenges such as high inflation, high interest rates, currency fluctuations, and political unrest. As such, many developing countries including Kenya have had to borrow more in order to cushion their economies against the additional economic shocks resulting from internal geopolitical tensions and supply chain constraints amid arising global conflicts. However, this continuous borrowing has resulted in high levels of accumulated debt, with several implications for the Kenyan economy;
- Increased Debt Servicing Costs – High debt levels have led to increased costs of debt servicing given that a significant portion of the debt is in foreign currencies and the local currency has been weakening. The government has had to increase taxes and cut spending in other areas to meet its debt obligations and the conditions set by Multilateral lenders such as the IMF,
- Higher Borrowing Costs on New Loans – Given the country’s high levels of debt, lenders perceive Kenya’s credit environment to be riskier, therefore demanding higher interest rates for new borrowing. This makes it more expensive for the government to finance its operations and investments,
- Reduced Fiscal Space – High debt levels tend to limit a government’s fiscal space, or its ability to respond to economic shocks with fiscal policy. This is because a large portion of the government’s budget gets tied up in debt servicing, leaving less money for other expenditures and development,
- Crowding Out of the Private Sector – Because of the increased domestic borrowing, the government crowds out the private sector by driving up interest rates in the economy thus making it difficult for both businesses and individuals to borrow, and,
- Risk of Default – High levels of debt can lead to default, where a country is unable to meet its debt obligations. For Kenya’s situation, credit rating agencies such as Fitch and Moody’s have downgraded the country’s credit outlook from stable to negative resulting in increased borrowing costs and loss of investor confidence.
Section 4: Kenya’s Debt sustainability analysis and outlook
As discussed in above sections, the country’s risk of debt distress remains elevated as evidenced by the high debt service to revenue ratio of 64.3%. Additionally, Kenya’s debt to GDP ratio stood at 70.2% in June 2023, 20.2% points above IMF’s recommended threshold of 50.0% for developing countries. Notably, Kenya’s public debt recorded 10-year CAGR of 18.0% to Kshs 10.5 tn in August 2023, outpacing the economic growth’s 10 year average of 4.5%, with the International Monetary Fund (IMF) projecting Kenya’s 2023 GDP growth to come in at 5.0% as of July 2023, a downward revision from its projection of 5.3% made in April 2023 as a result of elevated inflation and high interest rates. The persistent fiscal deficits resulting from the revenue-expenditure mismatch continue to hamper fiscal consolidation efforts as revenue continues to lag behind expenditure.
Kenya’s debt levels have been of concern, with the recent ratings by S&P Global, Fitch and Moody’s credit agencies downgrading the country’s credit outlook from stable to negative. The downgrades of Kenya’s credit score have dimmed the country’s ability to access cheaper loans in the international financial markets, with the yields on the 10-year 2014 Eurobond Issue reaching a high of 20.3% on 3rd October 2023. Below is a summary of the credit rating on Kenya by various rating agencies:
|
Cytonn Report: Kenya Credit Rating Agencies Ratings |
|||||
|
Rating Agency |
Previous Rating |
Current Outlook |
Current Rating |
Current Outlook |
Date Released |
|
Moody’s Ratings |
B3 |
Stable |
B3 |
Negative |
28th July 2023 |
|
Fitch Ratings |
B |
Stable |
B |
Negative |
20th July 2023 |
|
S&P Global |
B |
Stable |
B |
Negative |
24th February 2023 |
Source: Fitch Ratings, S&P Global
With the tough macro-economic environment currently being witnessed in the country, the government’s projection of increased revenues especially through tax collection may fall short of its target, thus leading to continuous need for borrowing. The table below gives the trend of both expenditure and revenue growths in the last five financial years and projections in the medium term;
|
Cytonn Report: Public Debt (Kshs tn) |
|||||||
|
FY'2018/19 |
FY'2019/20 |
FY'2020/21 |
FY'2021/22 |
FY2022/23 |
FY2023/24 |
FY2024/25 |
|
|
Cumulative Domestic Debt |
2.8 |
3.2 |
3.7 |
4.3 |
4.7 |
5.1 |
5.5 |
|
Cumulative External Debt |
3.0 |
3.5 |
4.0 |
4.3 |
5.5 |
5.9 |
6.1 |
|
Total |
5.8 |
6.7 |
7.7 |
8.6 |
10.3 |
10.9 |
11.6 |
|
Expenditure |
2.4 |
2.6 |
2.8 |
3.0 |
3.1 |
3.7 |
4.0 |
|
Revenue Collected |
1.5 |
1.6 |
1.6 |
1.9 |
2.4 |
2.6 |
2.9 |
|
Budget Deficit |
0.9 |
1.0 |
1.2 |
1.1 |
0.7 |
1.2 |
1.1 |
|
Domestic Borrowings |
0.3 |
0.5 |
0.6 |
0.6 |
0.6 |
0.3 |
0.4 |
|
External Borrowings |
0.4 |
0.3 |
0.3 |
0.1 |
0.1 |
0.3 |
0.3 |
|
Total |
0.7 |
0.8 |
1.0 |
0.7 |
0.7 |
0.6 |
0.7 |
|
Domestic debt service |
0.5 |
0.4 |
0.5 |
0.6 |
1.0 |
0.8 |
0.9 |
|
External debt Service |
0.4 |
0.2 |
0.2 |
0.3 |
0.4 |
0.6 |
0.4 |
|
Total Debt Service |
0.9 |
0.7 |
0.8 |
0.9 |
1.4 |
1.5 |
1.4 |
|
Debt service to Revenue |
56.7% |
41.4% |
50.0% |
47.9% |
56.8% |
57.2% |
47.5% |
Source: National Treasury (Annual Public Debt Management Report and Budget Policy Statement)
Key take outs;
- Debt servicing costs is expected to remain high in the FY’2023/24 due to the need for more borrowings. The high borrowings are expected to be channelled to debt repayment, financing the increasing fiscal deficit as KRA lags behind target and the depreciating shilling continues to increase debt repayment costs,Our View: Debt service projected to grow in FY’2022/23 with debt servicing cost remaining high due to upcoming Eurobond maturity worth USD 2.0 bn and continued local debt maturities,
- Revenue is expected to grow at a 5-year CAGR of 12.8% to Kshs 2.9 tn by the end of FY’2024/25, from Kshs 1.6 tn in FY’2019/20, attributable to the governments focus to increased tax revenues. Due to the unfavourable business climate, combined with high inflation and limited liquidity in the country, it is anticipated that revenue collections will not meet the target. Consequently, the success of revenue collection is heavily reliant on the country’s economic performance and how quickly the business environment improves,
- Compared to revenue, expenditure is expected to grow at a relatively slower 5-year CAGR of 9.2% to Kshs 4.0 tn by the end of FY’2024/25, from 2.6 tn recorded in FY’2019/20, on the back of increased recurrent expenditure, sustained currency depreciation and persistent current account deficit, and,
- The budget deficit is expected to widen in the projected years due to a mismatch in revenue against expenditure growths despite revenue projected to increase at a faster rate compared to expenditure. The persistent budget deficit in the projected financial years, is an indication of the need for further borrowing, impeding the government’s in managing the current debt level.
It is clear that the government faces challenges on how they shall finance their operations in the next couple of months as the debt servicing is high and the economic activity is much slower. The KRA collections for the FY’2022/23 amounted to Kshs 2.2 tn, falling short of the tax revenue target of Kshs 2.3 tn, mainly attributed the tough macroeconomic situation in the country. The situation is exacerbated by the tightened liquidity that currently stands at 12.6% in the local market as of 19th October 2023 amidst the deteriorated business environment. Further, the weakening of the Kenyan shilling has increased the cost of servicing and repaying loans denominated in foreign currencies. As a result, the government’s capability to repay its upcoming maturities and meet its debt obligations is still a major concern.
Section 5: Conclusions and Recommendations
Kenya's public debt situation underscores the need for prudent fiscal management and strategic planning to ensure that the debt remains sustainable and does not compromise the country's economic prospects. It is essential to strike a balance between funding the government's development projects and maintaining debt at manageable levels. To address the challenges posed by the high public debt in Kenya, here are some actionable steps that the Kenyan government can consider:
- Enhanced Debt Management – Implement a comprehensive debt management strategy that encompasses short, medium, and long-term objectives which regularly assess the cost and risk profile of the debt portfolio as well as Prioritizing refinancing high-cost debt with lower-cost alternatives to reduce debt service obligations,
- Capital Markets Reform – The government should strengthen the regulatory and supervisory framework for capital markets and improve the efficiency, stability, and inclusiveness of the financial sector, especially the markets for stocks, bonds, and other securities to improve capital formation and foreign direct investments (FDIs) flowing into the country,
- Improve Ease of Doing Business – The government should improve the competitiveness and attractiveness of the country for investors and entrepreneurs. This can be achieved by simplifying and streamlining the procedures and requirements for starting, operating, and closing a business. This also includes promoting a conducive and competitive business environment that fosters innovation, productivity, and growth. These measures will spur business growth and improve the country’s production thus allowing the government to collect more revenue inform of taxes,
- Economic Diversification – The government should put more efforts on diversifying the economy by encouraging the growth of non-traditional sectors such as technology, agribusiness, manufacturing, and renewable energy as well as Implement structural reforms to improve the ease of doing business and attract foreign direct investment (FDI) which would in turn increase the country’s revenue collection,
- Fiscal Consolidation – High fiscal deficit is attributable to higher growth in expenditure volumes relative to revenue collections, creating the need for excessive borrowing levels. The government needs to implement robust fiscal consolidation through expenditure reduction by introducing austerity measures and limit capital expenditure to projects with either high social impact or have a high Economic Rate of Return (ERR), and high economic benefits outweighing costs,
- Investment in Productive Sectors – Direct investments toward sectors that have the potential for high economic growth and job creation, such as infrastructure, agriculture, and manufacturing as well as developing targeted incentive programs to attract both domestic and foreign investments in these sectors,
- Public-Private Partnerships (PPPs) – The government should identify infrastructure projects suitable for PPP arrangements and incentivize the private sector to participate in such projects, thus sharing the financial burden and transferring project risk to the private sector,
- Improving the Country’s Exports – The government should formulate export and manufacturing favourable policies to improve the current account. This would stabilize the exchange rate and stop our foreign denominated debt from increasing as the shilling depreciates,
- Efficient Tax Collection – The government should strengthen tax collection and administration to improve revenue collection without increasing tax rates significantly. This can be done through broadening the tax base while ensuring tax policies are equitable and do not disproportionately burden the lower-income segments of the population,
- Transparency and Accountability: Maintain transparency in the utilization of borrowed funds and ensure that loans are allocated to projects with measurable returns. Better governance will help to reduce wastage and corruption levels that had impeded proper allocation of funds towards designated projects, resulting in misappropriation of funds, and,
- Monitoring and Reporting: Establish mechanisms for continuous monitoring of debt levels and fiscal health, with regular reporting to stakeholders and the public.
Addressing the public debt issue is a collective effort that requires cooperation among policymakers, stakeholders, and the general public, all working together to secure the country’s financial future and prosperity.
Disclaimer: The views expressed in this publication are those of the writers where particulars are not warranted. This publication, which is in compliance with Section 2 of the Capital Markets Authority Act Cap 485A, is meant for general information only and is not a warranty, representation, advice or solicitation of any nature. Readers are advised in all circumstances to seek the advice of a registered investment advisor.


