Following the release of the FY’2024 results by all four authorized Real Estate Investment Trusts (REITs) in Kenya, the Cytonn Real Estate Research Team undertook an analysis of the financial performance of the REITs and identified the key factors that shaped the performance of the sector. For the earnings notes of the various REITs, click the links below:
- ILAM Fahari I-REIT FY’2024 Earnings Note
- LapTrust Imara I-REIT FY’2024 Earnings Note
- Acorn I-REIT FY’2024 Earnings Note
- Acorn D-REIT FY’2024 Earnings Note
In the report we will assess the financial performance of the current REITs in the market during FY’2024 in terms of operational metrics, profitability metrics, leverage ratios, liquidity ratios, and valuation metrics. In addition, we highlight the outlook regarding our expectations for the REITs sector going forward. This we will cover as follows;
- Overview of the REITs Sector in Kenya,
- Themes that shaped the Real Estate Sector in FY’2024,
- Summary Performance of the REITS in FY’2024, and,
- Conclusion and Outlook for the REITs sector.
Section I: Overview of the REITs Sector in Kenya
In FY’2024, the general Real Estate sector continued to witness considerable growth in activity in terms of property transactions and development activities. Consequently, the sector’s activity contribution to Gross Domestic Product (GDP) grew by 5.5 % to Kshs 283.8 bn in Q3’2024, from Kshs 268.9 bn recorded during the same period in 2023. In addition, the sector contributed 10.8% to the country’s GDP, 0.3% points increase from 10.5% recorded in Q3’2023. Cumulatively, the Real Estate and construction sectors contributed 16.5% to GDP, 0.2% points decrease from 16.7% in Q3’2023, attributable to decline in construction contribution to GDP by 0.4% points, to 5.7% in Q3’2024, from 6.1% recorded in Q3’2023. The decline in Construction sector was attributable to the high cost of building materials that led to a 2.0% contraction in the construction sector in Q3’2024, compared to a 4.0% increase in Q3’2023. The graph below highlights the Real Estate and Construction sectors’ contribution to GDP from 2020 to Q3’2024;
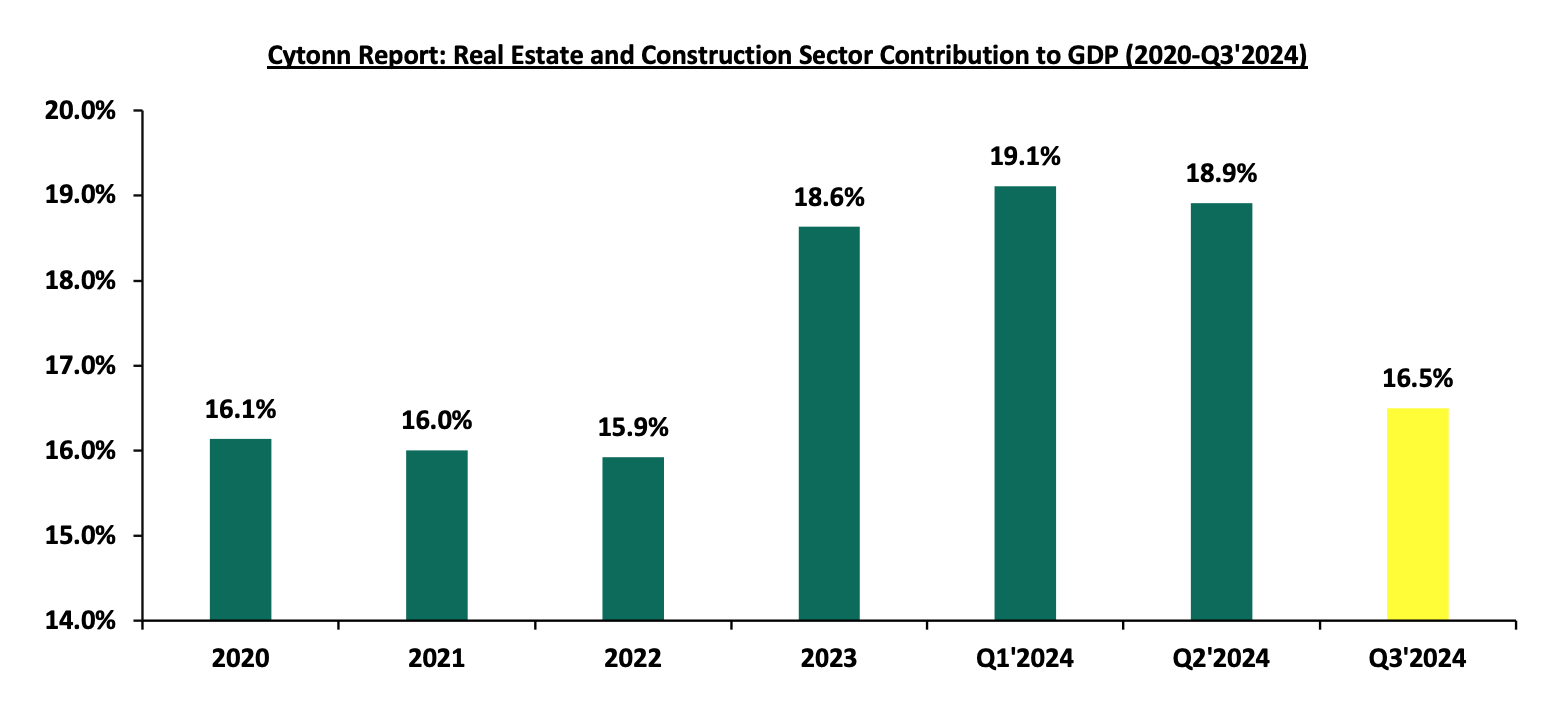
Source: Kenya National Bureau of Statistics (KNBS)
As the REITs continue to gain popularity in Kenya, we set to explore and review the REITs environment in 2024 building to the previous reports we did, which include: Real Estate Investment Trusts (REITs) progress in Kenya ,Kenya’s REITs H1’2024 ,Review of Real Estate Investments Trusts in Kenya 2024
Section I: Overview of the REITs Sector in Kenya
Real Estate Investment Trusts are crucial to the development given the limited funding available to the developers. Real Estate Investment Trusts (REITs) represent an innovative financing avenue for real estate development in Kenya. REITs provide a structured mechanism for pooling resources from multiple investors to finance or acquire income-generating real estate assets. The Capital Markets Authority (CMA) regulates REITs in Kenya, ensuring transparency and investor protection. Despite being relatively new in the Kenyan financial market, REITs have shown potential as a transformative tool for real estate financing.
In Kenya, REITs are classified into two main types:
- Development REITs (D-REITs): These focus on financing the construction of new real estate projects. Developers utilize D-REITs to raise capital for large-scale projects, such as residential complexes, commercial buildings, or mixed-use developments. Investors in D-REITs anticipate returns from the eventual sale or lease of the completed properties. Example of this REIT include Acorn D-REIT.
- Income REITs (I-REITs): These are designed for properties that generate consistent rental income. I-REITs appeal to investors seeking steady cash flow from established properties such as office buildings, shopping malls, or industrial parks. In Kenya examples of I-REITs include Acorn I-REIT and Stanbic Fahari I-REITs.
REITs in Kenya are governed by strict regulations aimed at safeguarding investors. They operate as collective investment schemes where a REIT manager oversees the fund's operations. Investors purchase units of the REIT, similar to shares in a company, granting them proportional ownership of the underlying real estate assets. These units are typically traded on the Nairobi Securities Exchange (NSE), providing liquidity and enabling investors to buy or sell their stakes easily.
REITs must allocate a significant portion of their income, often up to 90.0% to investors as dividends, making them attractive to those seeking regular income. Additionally, REITs benefit from tax incentives, such as exemptions on corporate tax, which enhance their appeal to both developers and investors.
In 2013, the Capital Markets Authority (CMA) introduced a detailed framework and regulations for REITs, enabling developers to secure capital through this investment avenue.
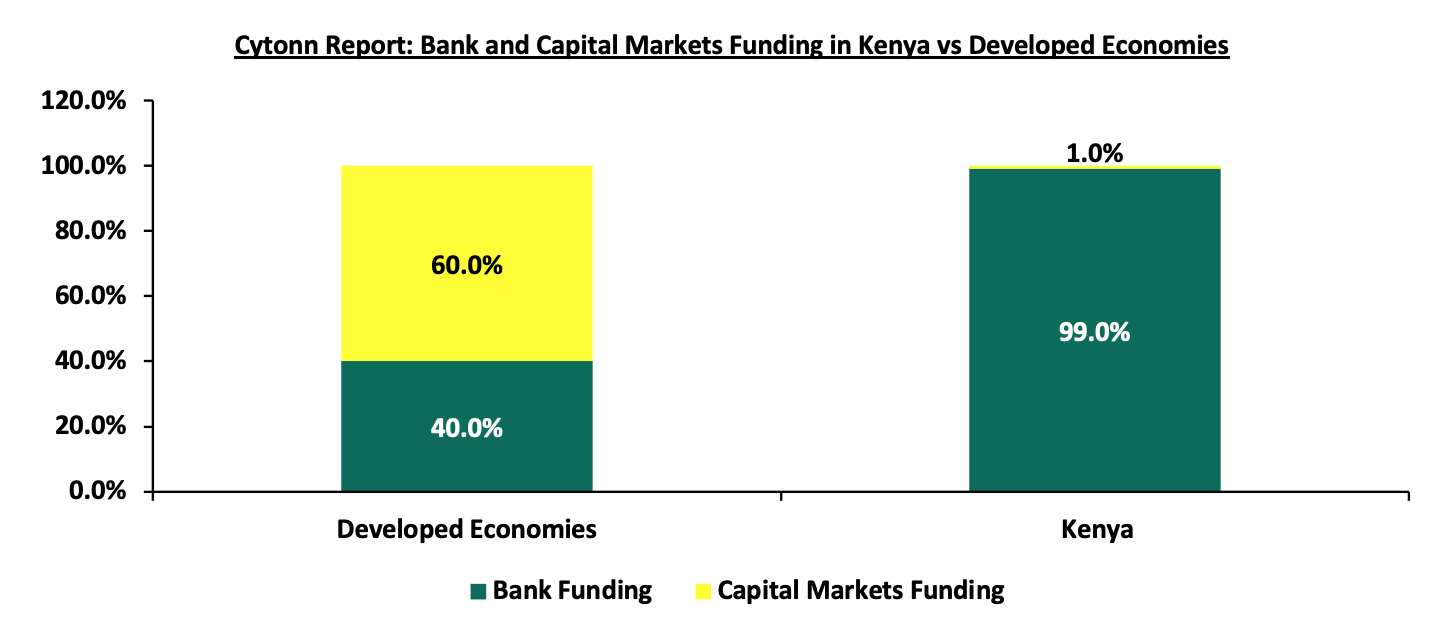
Kenya's Real Estate sector has been expanding due to ongoing construction activities driven by strong demand for real estate developments. The residential market is significantly under-supplied, with an 80.0% housing deficit; only 50,000 units are delivered annually against an estimated need for 200,000 units per year. Additionally, the formal retail market in Kenya is still in its nascent stages, with a penetration rate of approximately 30.0%, as reported by the world bank. Despite the high demand, developers in Kenya encounter limited financing options, with local banks providing nearly 99.0% of construction financing, in stark contrast to the 40.0% typically seen in developed countries. The graph below illustrates the comparison of construction financing in Kenya versus developed economies;
To bridge the funding gap, developers are increasingly turning to alternative financing methods. In 2013, the Capital Markets Authority (CMA) introduced a regulatory framework for Real Estate Investment Trusts (REITs) in Kenya. REITs are collective investment vehicles that pool funds from investors, who then acquire rights or interests in a trust divided into units. Investors benefit from profits or income generated by the real estate assets held within the trust. To ensure transparency, accountability, and the protection of investors' interests, four essential entities play key roles in the REIT structure in Kenya. Click here to read more on the key entities and how the REIT structure operates.
Since its introduction in 2013, the REIT market in Kenya has faced several hurdles that have hindered its growth. Key challenges include the hefty capital requirement of Kshs 100.0 mn for trustees, limiting this role largely to banks, and a protracted approval process for setting up REITs. Additionally, the high minimum investment threshold of Kshs 5.0 mn discourages potential investors, while a lack of sufficient investor education and awareness further impedes market expansion. As a result, the REIT market capitalization in Kenya remains significantly lower compared to other regions.
The underdeveloped capital markets in Kenya has continually failed to provide alternative means of financing Real Estate developments. Due to this, most property developers rely on conventional sources of funding such as banks, compared to other developed countries. As a result, Kenya’s REIT Market Capitalization to GDP has remained significantly low at 0.1%, compared to other countries such as South Africa with 1.9%, as shown below;
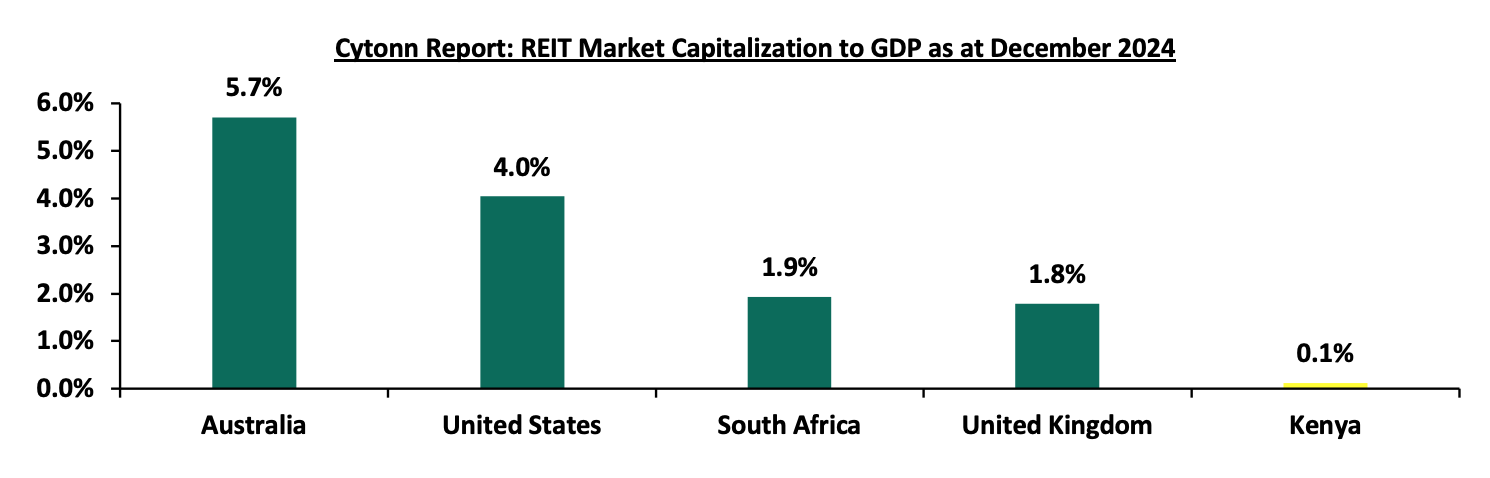
Source: European Public Real Estate Association (EPRA), World Bank, Cytonn Research
Most property developers in Kenya continue to rely on traditional funding sources, such as banks, unlike in more developed markets. Since the establishment of REIT regulations, four REITs have been approved in Kenya, all structured as closed-ended funds with a fixed number of shares. However, none of these REITs are actively trading on the Main Investment Market Segment of the Nairobi Securities Exchange (NSE). Following the recent delisting of ILAM Fahari I-REIT, LAPTrust Imara I-REIT is the only listed REIT in the country, quoted on the restricted market sub-segment of the NSE's Main Investment Market. It is important to note that Imara did not raise funds upon listing. The ILAM Fahari I-REIT, Acorn I-REIT and D-REIT are not listed but trade on the Unquoted Securities Platform (USP), an over-the-counter market segment of the NSE. The table below outlines all REITs authorized by the Capital Markets Authority (CMA) in Kenya
|
Cytonn Report: Authorized REITs in Kenya |
||||||
|
# |
Issuer |
Name |
Type of REIT |
Listing Date |
Market Segment |
Status |
|
1 |
ICEA Lion Asset Management (ILAM) |
Fahari |
I-REIT |
July 2024 |
Unquoted Securities Platform (USP) |
Trading |
|
2 |
Acorn Holdings Limited |
Acorn Student Accommodation (ASA) – Acorn ASA |
I-REIT |
February 2021 |
Unquoted Securities Platform (USP) |
Trading |
|
3 |
Acorn Holdings Limited |
Acorn Student Accommodation (ASA) – Acorn ASA |
D-REIT |
February 2021 |
Unquoted Securities Platform (USP) |
Trading |
|
4 |
Local Authorities Pension Trust (LAPTrust) |
Imara |
I-REIT |
March 2023 |
Restricted Market Sub-Segment of the Main Invesment Market |
Restricted |
Source: Nairobi Securities Exchange, CMA
Section II: Themes that Shaped the REIT Sector in FY’2024
In our report on review of the REITs sector, we explored how evolving regulations, strategic acquisitions, and capital-raising initiatives have influenced the REIT industry's trajectory. Additionally, we provide insights into the broader factors that have impacted the sector's performance and overall direction during this period. For more information on themes that shaped the REIT sector in 2024, please visit our report Review of Real Estate Investments Trusts in Kenya 2024
Section III: Summary Performance of the REITs in FY’2024
The tables below highlight the performance of the Kenyan REITs sector, showing the performance using several National Association of Real Estate Investments Trusts (NAREIT) approved metrics, and the key take-outs include;
|
Cytonn Report: Summary Performance Kenya REITs in FY’2024 |
|||||||||||||||
|
|
Imara I-REIT |
ILAM Fahari I-REIT |
Acorn I-REIT |
Acorn D-REIT |
Average FY'2023 |
Average FY'2024 |
y/y change |
||||||||
|
|
FY'2023 |
FY'2024 |
y/y Change |
FY'2023 |
FY'2024 |
y/y Change |
FY'2023 |
FY'2024 |
y/y Change |
Fy'2023 |
FY'2024 |
y/y Change |
|||
|
Operating Metrics |
|||||||||||||||
|
Net Operating Income (NOI) |
244.6 |
353.9 |
44.7% |
148.7 |
113.6 |
(23.6%) |
340.1 |
662.6 |
94.8% |
368.6 |
1152.7 |
212.7% |
1102.0 |
2282.8 |
107.1% |
|
Profitability Metrics |
|||||||||||||||
|
Funds from Operations |
57.2 |
283.1 |
394.8% |
(0.3) |
377.2 |
126831.0% |
501.8 |
972.5 |
93.8% |
368.6 |
1152.7 |
212.7% |
927.3 |
2785.6 |
200.4% |
|
Adjusted FFO |
57.2 |
283.1 |
394.8% |
(6.1) |
391.2 |
6526.8% |
501.8 |
972.5 |
93.8% |
368.6 |
1152.7 |
212.7% |
921.5 |
2799.6 |
203.8% |
|
Cash Available for Distribution (CAD) |
195.7 |
283.1 |
44.7% |
148.7 |
113.6 |
(23.6%) |
235.7 |
234.6 |
(0.5%) |
239.8 |
293.2 |
22.2% |
819.9 |
924.5 |
12.8% |
|
Cash Amounts Distributed (CAD) |
57.2 |
283.1 |
394.7% |
126.7 |
54.3 |
(57.1%) |
154.1 |
125.6 |
(18.5%) |
71.6 |
839.9 |
1073.8% |
409.6 |
1302.9 |
218.1% |
|
Valuation Metrics |
|||||||||||||||
|
Net Asset Value (NAV) |
6,981.9 |
6,452.0 |
(7.6%) |
3,306.4 |
0.1 |
7.6% |
7,377.5 |
8,122.1 |
10.1% |
6,560.9 |
7339.7 |
11.9% |
6,056.7 |
5,581.3 |
(7.8%) |
Source: Cytonn Research
Key takeaways from the table include:
- The combined Net Operating Income (NOI) of Kenyan REITs saw a 107.1 % increase, reaching Kshs 2,282.8 mn in FY’2024, up from Kshs 1102.0 mn in FY’2023. This growth was largely driven by a 212.7% rise in the net operating income of Acorn D-REIT, which increased to Kshs 1152.7 mn from Kshs 368.6 mn in FY’2023. Additionally, Acorn I-REIT reported a notable NOI growth of 94.8%, reaching to Kshs 662.6 mn from Kshs 340.1 mn in similar period in 2023, further contributing to the overall positive performance. ILAM Fahari I-REIT’s NOI saw the largest drop, falling by 23.6% to Kshs 113.6 mn from Kshs 148.7 mn in FY’2023
- Combined Funds from Operations (FFO) of Kenyan REITs increased by 200.4% in FY’2024, increasing to Kshs 2,785.6 mn from Kshs 927.3 mn in FY’2023. Similarly, Adjusted FFOs for Kenyan REITs increased by 203.8%, reaching Kshs 2799.6 mn in FY’2024 from Kshs 921.5 mn in FY’2023. This increase was largely due to significant increases in NOIs except for ILAM Fahari I-REIT which recorded a decrease of 23.6% during the period,
- The REITs combined Cash amounts available for paying dividends to REIT investors which we measured using the Cash Available for Distribution (CAD) metric increased by 12.8% in FY’2024 to Kshs 924.5 mn from Kshs 819.9 mn in FY’2023. The performance was propelled by Laptrust Imara I-REIT’s distributable earnings which increased by 394.7% to come in at Kshs 283.1 mn from Kshs 195.7 mn during the same period last year. Additionally, Acorn D-REIT distributed earnings stood at Kshs 293.2 mn which was an improvement from the Kshs 239.8 mn earnings recorded in FY’2023 which was a 22.2% improvement.
- Notably, the REIT managers of all four REITs recommended provisional dividends. For Laptrust Imara I-REIT, the REIT Manager suggested a first dividend distribution of Kshs 283.1 mn, amounting to Kshs 0.82 per unit, which was approved by the Trustee for the FY’2024, ILAM Fahari I-REIT’s manager proposed a first and final dividend of Kshs 0.3 per unit, making Kshs 54.3 mn available for distribution out of Kshs 113.6 mn. Acorn I-REIT increased its total distribution for the year to Kshs 125.6mn, translating to Kshs 0.4 per unit, marking a 18.5 % drop from the Kshs 154.1 mn distributed in FY’2023. Acorn D-REIT recommended a distribution of Kshs 293.2 mn, equivalent to Kshs 1.1 per unit, which was an improvement from the 0.9 per unit distribution in FY’2023, and,
- The combined Net Asset Values (NAV) for Kenyan REITs decreased by 7.8% to reach Kshs 22,325.1 mn in FY’2024, from Kshs 24,226.7 mn in FY’2023. This decline was driven by a 52.6% decrease in the NAV of Imara I-REIT, reaching Kshs 3,306.4 mn from Kshs 6,981.9 mn in FY’2023. All other REITS recorded an increase in NAV by 7.6%, 10.1% and 11.9% for ILAM Fahari I-REIT, Acorn I-REIT and D-REIT respectively.
The table below makes a comparison of the leverage and liquidity ratios of all four Kenyan REITs during FY’2024 and FY’2023;
|
Cytonn Report: Operation & Liquidity Ratios of Kenyan REITs |
|||||||||||||||
|
|
Imara I-REIT |
ILAM Fahari I-REIT |
Acorn I-REIT |
Acorn D-REIT |
FY'2023 |
FY'2024 |
y/y change |
||||||||
|
FY'2023 |
FY'2024 |
y/y Change |
FY'2023 |
FY'2024 |
y/y Change |
FY'2023 |
FY'2024 |
y/y Change |
FY'2023 |
FY'2024 |
y/y Change |
||||
|
Operating Metrics |
|||||||||||||||
|
Debt to Equity Ratios |
0.0% |
0.0% |
0.0% |
0.0% |
0.0% |
0.0% |
0.0% |
0.0% |
0.0% |
16.5% |
59.2% |
42.7% |
7.5% |
24.5% |
17.0% |
|
Debt to Total Market Cap Ratio |
0.0% |
0.0% |
0.0% |
0.0% |
0.0% |
0.0% |
0.0% |
0.0% |
0.0% |
16.0% |
66.2% |
50.2% |
7.3% |
27.5% |
20.1% |
|
Debt to Gross Book Value Ratio |
0.0% |
0.0% |
0.0% |
0.0% |
0.0% |
0.0% |
0.0% |
0.0% |
0.0% |
9.4% |
28.3% |
18.9% |
4.3% |
11.7% |
7.4% |
|
Debt to EBITDA Multiple |
0.0 |
0.0 |
0.0% |
0.0 |
0.0 |
0.0% |
0.0 |
0.0 |
0.0% |
2.9 |
3.7 |
80.3% |
134.0% |
154.8% |
15.5% |
|
Liquidity Ratio |
|||||||||||||||
|
Debt Service Coverage Ratio |
0.0 |
0.0 |
0.0% |
- |
0.0 |
0.0% |
- |
- |
0.0% |
34.1% |
26.5% |
(7.6%) |
15.6% |
11.0% |
(4.6%) |
|
Implied Capitalization Rate |
3.6% |
21.3% |
17.8% |
21.3% |
7.4% |
(13.9%) |
4.0% |
6.8% |
2.8% |
3.5% |
9.0% |
5.5% |
8.1% |
11.1% |
3.0% |
Source: Cytonn Research
Key takeaways from the table include;
- Majority of the REITs remained ungeared during FY’2024, with their leverage ratios remaining at zero except Acorn D-REIT. Acorn D-REIT debt ratios increased in FY’2024 on account of a 301.9% increase in its long-term borrowings to Kshs 4.3 bn from Kshs 1.5 bn in FY’2023,
- Notably, Acorn D-REIT’s Debt to EBITDA Multiple increased by 80.3% to 3.7x in FY’2024, from 2.9x recorded in FY’2023. This was on the back of a faster rise in the REIT’s long-term borrowings which outpaced the EBITDA’s incline. Acorn D-REIT EBITDA in FY’2024 increased by 215.4% to Kshs 1,163.8 mn from Kshs 369.0 mn in FY’2023, compared to a 301.9% decrease in the REIT’s long-term debt, and,
- Imara I-REIT traded at the highest implied capitalization rate of 21.3%, signifying a higher return on investment compared to other REITs. In contrast, Acorn I-REIT had the lowest implied capitalization rate of 6.8%.
The table below presents a summary of key valuation metrics of Kenyan REITs in FY’2024;
|
Cytonn Report: Summary Performance Kenya REITs in FY’2024 |
|||||||||||||||
|
|
Imara I-REIT |
ILAM Fahari I-REIT |
Acorn I-REIT |
Acorn D-REIT |
FY'2023 |
FY'2024 |
y/y change |
||||||||
|
|
FY'2023 |
FY'2024 |
y/y Change |
FY'2023 |
FY'2024 |
y/y Change |
FY'2023 |
FY'2024 |
y/y Change |
FY'2023 |
FY'2024 |
y/y Change |
|||
|
Operating Metrics |
|||||||||||||||
|
Price/FFO per share |
121.0 |
24.5 |
(79.8%) |
(3830.5) |
(1.6) |
100.0% |
14.2 |
7.5 |
(47.2%) |
18.3 |
5.7 |
(68.9%) |
(919.3) |
9.0 |
(101.0%) |
|
Dividend Yield |
2.8% |
4.1% |
1.3% |
11.1% |
2.7% |
(8.4%) |
2.2% |
1.7% |
(0.4%) |
3.6% |
4.5% |
0.9% |
4.9% |
3.3% |
(1.7%) |
|
Dividend Coverage/Payout Ratio |
80.0% |
80.0% |
0.0% |
85.2% |
47.8% |
(37.4%) |
45.3% |
19.0% |
(26.3%) |
19.4% |
72.9% |
53.4% |
57.5% |
54.9% |
(2.6%) |
|
Net Asset Value |
6,981.9 |
6452.0 |
(7.6%) |
3,306.4 |
3556.9 |
7.6% |
7377.5 |
8122.1 |
10.1% |
6,560.9 |
7,339.7 |
11.9% |
24226.7 |
25470.7 |
5.1% |
|
Net Asset Value per share |
20.2 |
18.6 |
(7.6%) |
18.3 |
19.7 |
7.6% |
22.5 |
24.6 |
9.1% |
24.6 |
27.5 |
11.6% |
21.4 |
22.6 |
5.6% |
|
Implied Capitalization Rate |
3.6% |
5.1% |
1.5% |
21.3% |
7.4% |
(13.9%) |
4.0% |
6.8% |
2.8% |
3.5% |
9.0% |
5.5% |
8.1% |
7.1% |
(1.0%) |
|
Annualised Divided Yield |
5.7% |
8.2% |
2.5% |
11.4% |
2.7% |
(8.7%) |
2.2% |
1.7% |
(0.4%) |
3.6% |
4.5% |
0.9% |
5.7% |
4.3% |
(1.4%) |
Source: Cytonn Research
- Acorn I-REIT units are trading at a premium relative to its peers, with a Price to FFO per share multiple of Kshs 24.5, however this was a decrease of 79.8% from Kshs 121.0 price per FFO per share multiple,
- Laptrust Imara I-REIT’s and Acorn D-REIT posted the highest annualized dividend yield in FY’2024 at 8.2% and 4.5% respectively, surpassing ILAM Fahari I-REIT 2.7% and Acorn I-REIT’s 1.7%. On the payout side, Imara’s dividend payout was 85.2%, adhering to Kenya's REIT regulations that mandate distributing at least 80.0% of net profits after tax as dividends. Conversely, Acorn I-REIT and ILAM Fahari I-REIT had lower payouts of 19.0% and 47.8%, respectively, falling short of the regulatory threshold, which might raise compliance issues with CMA and,
- Acorn D-REIT recorded the highest NAV per share at Kshs 27.5, a 11.6% increase from FY’2023’s NAV per share of Kshs 24.6. This is on the back of an increase in the number of shares, which increased by 0.2% to 267.3 mn from Kshs 266.7 mn in FY’2023; and a 11.9% growth in the Net Asset Value (NAV) to Kshs 7.3 bn from Kshs 6.6 mn in FY’2023. Imara I-REIT had the lowest NAV per share at Kshs 18.6, a 7.6% decline from 20.2 recorded in FY’2023. This is attributable to a 4.0% decrease in total assets to Kshs 6.7 bn from Kshs 7.3 bn in FY’2023.
The REITs registered positive returns of 10.2%, 7.7%, 9.2% and 1.6% for Acorn I-REIT, Fahari I-REIT, Laptrust Amara IREIT and Acorn D-REIT respectfully. Acorn D-REIT registered the lowest yield due to reduction in the rental income by 44.0% to 181.7 bn in 2024 from 324.5 bn in 2023 majorly attributable to the sale of two residential properties Qwetu Hurlingham and Qwetu Aberdare Heights II. On average, REITS yields came in at 7.2% showing lower returns as compared to other assets. The chart below shows the comparison of REITs yield performance versus other assets.
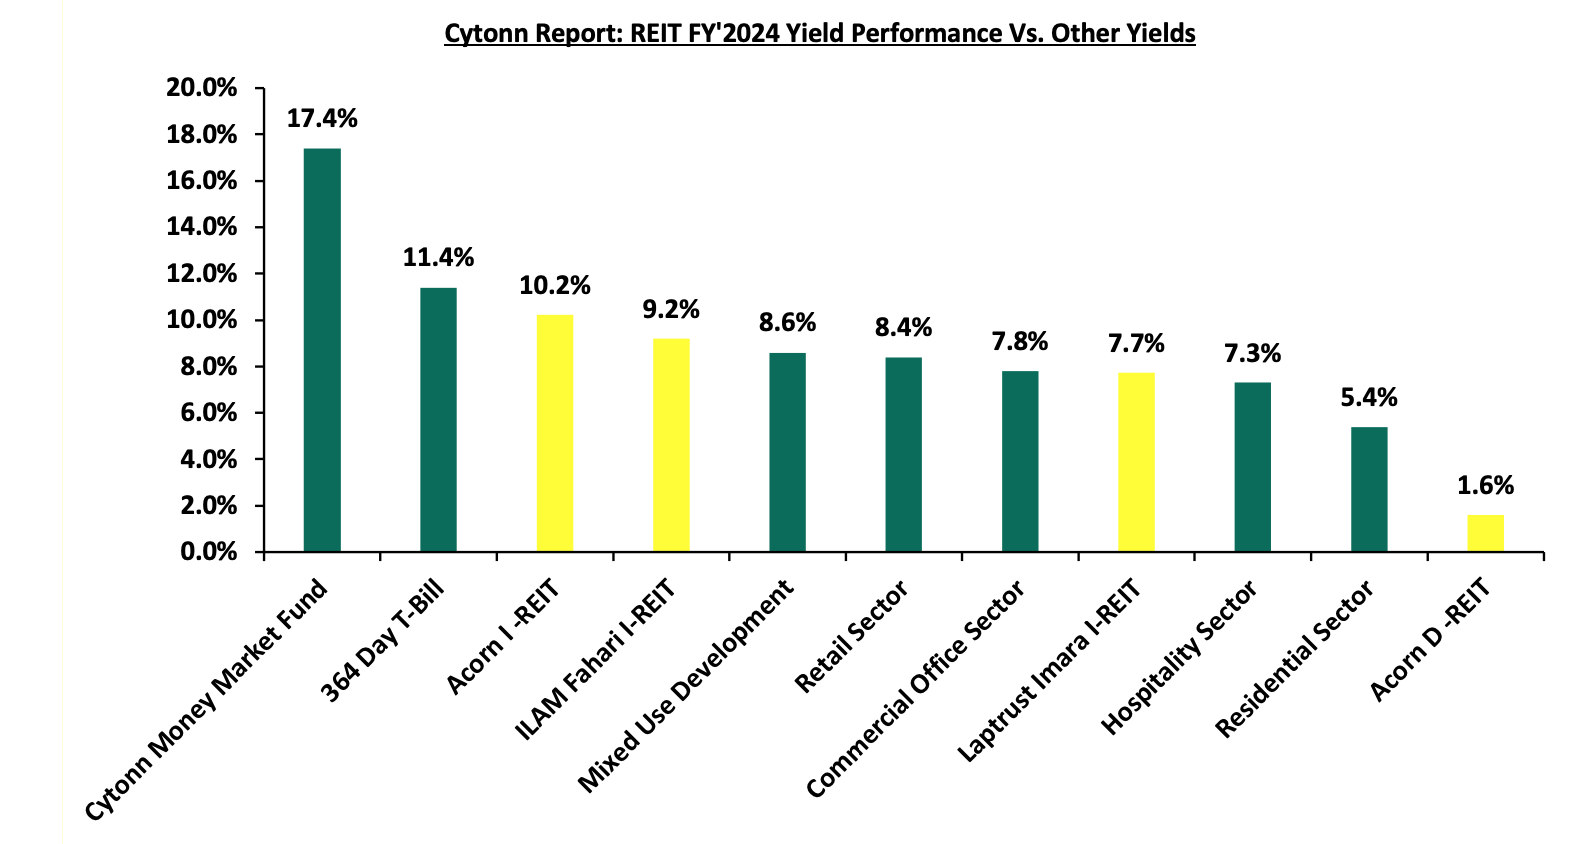
Source: Cytonn Research
Section IV: Conclusion, Recommendations, and Outlook for the REITs Sector
Kenya's REITs market has seen moderate performance, shaped by various factors. Despite challenges, there are encouraging trends, such as growth in net operating incomes, indicating improved financial performance. Additionally, leverage ratios for most REITs have remained low, with many REITs being ungeared and relying on short-term debt for their operations to avoid overexposure to rising interest rates. This trend is expected to continue as REITs seek to maintain financial sustainability, as evidenced by Acorn Holdings' issuance of a green bond.
Recommendations to Enhance the REITs Sector:
- Stakeholder education: There is a pressing need to educate all key stakeholders on the REIT structure. Implementing comprehensive investor education and awareness campaigns is essential to inform potential investors about both the benefits and inherent risks of REIT investments. By enhancing investor knowledge and understanding, a larger pool of individuals can be encouraged to participate in the REIT market, ultimately driving its growth and fostering sustainable development.
- Expanding legal entities: In South Africa, the REIT framework allows for a variety of legal entities to form REITs, unlike in Kenya where the structure is predominantly limited to trusts. In countries like Belgium and the United States, REITs can be established using diverse legal structures such as public limited companies, limited liability companies, cooperatives, or trusts. This flexibility accommodates different investor preferences and business models. To strengthen the Kenyan REIT market, it is advisable to broaden the range of permissible structures beyond traditional trust models to include corporations, partnerships, and limited liability companies. Such diversification would better cater to various investor needs and lower the barriers to market entry, ultimately promoting a more robust and dynamic REIT sector.
- Streamlined approval process: To enhance the efficiency of REIT approvals, consolidating the current dual-agency process—managed by the Capital Markets Authority (CMA) and the Kenya Revenue Authority (KRA)—into a single regulatory body is recommended. By centralizing the approval process, REIT managers and potential issuers would no longer need to navigate two separate regulatory frameworks. This consolidation is expected to streamline the process, reduce associated costs, and improve overall transparency and accountability.
- Introduce hybrid REIT vehicles: At present, investors are often required to subscribe to separate REIT classes, which leads to duplicate costs and complicates the investment process. Introducing a hybrid REIT structure would integrate the high returns associated with development-focused assets with the stable income streams characteristic of income-oriented REITs. Such a unified vehicle would simplify the investment process by eliminating redundant costs and offering investors a balanced risk-reward profile, thereby enhancing overall market appeal.
- Flexibility in listing: Given the apprehensions of many companies regarding an immediate shift to public listing, a phased approach is recommended. Providing REITs with an initial period of private operation before mandating public listing could ensure a smoother transition and align with corporate comfort levels. For example, Belgium’s model—requiring 30% public shareholding—strikes a balance between public participation and promoter flexibility. Kenya could adopt a similar strategy, or even consider offering REITs the choice between public and private listings, which would foster inclusivity and better accommodate diverse investor preferences while bolstering market liquidity.
- Lower capital requirement for trustees: Currently, the minimum capital requirement for REIT trustees is set at Kshs 100.0 mn, a threshold that effectively restricts trusteeship primarily to major banking institutions. With only a handful of banks registered as REIT trustees—such as Kenya Commercial Bank (KCB), Co-operative Bank, Housing Finance Bank, and NCBA Bank Kenya—it is recommended that this minimum be reduced to Kshs 10.0 mn. This adjustment, aligning with the minimum standards set for Pension Fund Trustees, would expand the pool of potential trustees and encourage more competitive, innovative service provision for REIT managers.
- Introduce tokenization of REITs: Embracing the concept of tokenization presents an innovative avenue to broaden market participation. By digitizing REIT units into smaller denominations—potentially allowing investments as low as Kshs 100.0—it becomes possible to lower entry barriers, enhance liquidity, and attract a broader range of investors, including those with limited capital.
- Diminishing Entry Barriers: Revisiting the current minimum investment requirement of Kshs 0.1 mn for D-REITs and Kshs 5.0 mn for the restricted I-REIT, is essential to eliminate barriers that restrict individual participation. Notably, given that D-REITs are riskier compared to I-REITS, it makes no sense having I-REITs with higher minimum investment requirements compared to D-REITs. Lowering this threshold to Kshs 50,000 for I-REITs would foster a more inclusive investment environment, allowing a wider array of investors to access and benefit from the REIT market, ultimately bolstering overall market vibrancy and liquidity.
The outlook for Kenya's REITs sector remains cautiously optimistic. While challenges such as high construction costs and market saturation in certain areas persist, the continued government support through infrastructure development and affordable housing initiatives provides a positive backdrop. Investors are expected to remain focused on income-generating REITs, particularly those tied to resilient sectors like retail and commercial properties. The sector's growth will likely hinge on increased investor awareness and the broadening of investment options within the REITs market.
In 2025, we expect REITS to gain popularity as developers such as Future construkt being licenced as REIT managers by the Capital Market Authority. Centum Real Estate are looking forward to launch a dollar based Income REIT and we expect that the dollar based I-REIT will: i) increase foreign investments by boosting investors’ confidence against local currency uncertainties, ,ii) dollar-denominated REITs provide an alternative for investors seeking more liquid and globally recognized investment options, iii) the dollar based move is likely to set a precedent for other players in the market, encouraging the development of more innovative and investor-centric financial products, and, iv) the fund could force policy regulatory framework improvement to ensure transparency and investments protection.
In addition, we expect the sector will continue to lag behind in comparison to other African countries such as South Africa, attributable to several challenges facing the sector such as; i) lack of sufficient investor awareness regarding the potential of REITs as an investment tool, ii) lengthy approval procedures for establishing REITs have hindered their formation and deployment in the market, iii) high minimum capital requirement of Kshs 100.0 mn for REIT trustees compared to Kshs 10.0 mn for pension funds Trustees, essentially limiting the licensed REIT Trustee to banks only,, and, iv) steep minimum subscription amounts or offer parcels set at Kshs 0.1 mn for D-REITs and Kshs 5.0 mn for restricted I-REITs.
However, we also expect the trend of strategic acquisitions to persist, with REITs actively seeking opportunities to broaden and diversify their portfolios, cater to evolving market demands and also set standards in promoting environmental sustainability such as execution of green bonds by Acorn holding. While there are supportive factors for the growth of REITs in Kenya, such as urbanization and government infrastructure projects, challenges like high interest rates and regulatory constraints may tamper performance. Stakeholders in the REIT sector are advised to monitor these dynamics closely and engage in strategic planning to navigate the evolving market landscape effectively.
Disclaimer: The views expressed in this publication are those of the writers where particulars are not warranted. This publication, which is in compliance with Section 2 of the Capital Markets Authority Act Cap 485A, is meant for general information only and is not a warranty, representation, advice, or solicitation of any nature. Readers are advised in all circumstances to seek the advice of a registered investment advisor.


