In line with our regional expansion strategy, we continue to assess investment opportunities in the Kenyan Counties, to enable us to diversify our portfolio of real estate investments for our clients. So far, we have covered 13 Kenyan Counties, including; Nyeri, Laikipia, Meru, Mombasa, Narok, Homabay, Kisii and Uasin Gishu. In line with this, in August 2016 we released the Kisumu Real Estate Investment Opportunity 2016, a research note that focused on the real estate market performance in Kisumu covering the residential, commercial offices, retail and hospitality themes. According to the research note, the market recorded average rental yields of 7.0%, with office, retail, and residential themes recording average rental yields of 7.0%, 9.0%, and 5.1%, respectively. In this focus, we update that research note with data collected in May 2018. We will cover the performance in terms of rental yields, price appreciation, uptake and occupancy rates and compare with the performance in May 2016 to gauge trends, opportunities, outlook and hence investment opportunities in Kisumu. We will start by giving a general overview of Kisumu City, and then cover the key drivers and challenges facing the real estate market, followed by an analysis of the performance of the various themes, before finally concluding by giving our outlook, and the real estate investment opportunity.
- Overview of Kisumu City
Kisumu City is the principal city of Western Kenya, situated approximately 341.6 km West of Kenya's capital city, Nairobi. It is the third largest city in Kenya after Nairobi and Mombasa. The City serves as the headquarters of Kisumu County, and it was formerly the central administrative headquarters of Nyanza Province. Kisumu has witnessed growth in infrastructure and amenities, with the development of roads such as the Nyamasaria - Magadi- Manyatta Road, Kisumu - Kisian Highway, and the upgrading of Kisumu International Airport to international status. In terms of real estate, Kisumu offers a unique blend of upper-mid to low-income residential units, commercial malls and office blocks, which mainly host county headquarters and serve the Kisumu urban population.
The main factors driving the real estate market in Kisumu are:
- Positive Economic Growth – Kisumu County ranks as the 17th richest county in Kenya with a GDP per Capita of USD 625, against a Kenyan average of USD 634 according to a 2015 survey by World Bank. This is boosted by tourism, trade and commerce, as well as agriculture, hence increasing the disposable income and boosting demand for real estate products in Kisumu City,
- Devolution – Devolution has opened up Kisumu City, attracting government institutions, private investors, and entrepreneurs to the county headquarters. This has therefore created demand for office space, retail space and residential units to host all the investors and government officials. Devolution has also placed the onus on the Kisumu County Government to spearhead development in the county, leading to the upgrading of housing developments in a bid to make them more habitable, such as in Okore, Migosi, Celtel, Mosque, Makasembo and Arina Estates,
- Positive Demographics – Kisumu City has a growing population, both organic and from immigration. The population has been growing at a rate of 2.8% p. a, compared to the Kenya average of 2.6% p.a. This results in higher demand for residential real estate products, resulting in the growth of the real estate sector in Kisumu City, as this population looks to purchase residential units,
- Infrastructural Development – Kisumu City has seen a lot of infrastructural developments in the recent years, which have opened it up for development. These include upgrading of the airport to international status, slum-upgrading programs by National Youth Service (NYS), and development of roads such as the Nyamasaria - Magadi- Manyatta Road and Kisumu - Kisian Highway. The area is also connected to mains water and sewerage connection from Kisumu Water and Sewerage Company (KIWAS), hence allowing for high densities.
However, despite all the factors supporting the real estate sector in Kisumu, there are still a number of factors, which if not properly addressed will present challenges to real estate development in the county, and these include:
- Unstructured Planning Regulations - The city is poorly planned, and is based on a Town Plan developed in 1974. There is little clarity on policies guiding the planning; in the past, expansion of roads led to a disruption of sewer and water lines in the city. If this is not addressed, it may lead to urban sprawl in urban centers and reduce land use maximization,
- Lack of Space for Expansion – As a result of the poor planning, residential developments in areas such as Milimani are close to the city center and hence the city’s commercial hub cannot expand outwards. This problem can be solved by rezoning Milimani to be a commercial center, with Riat Hills being the main high-end residential zone, hence enabling expansion of the CBD,
- Poor Land Administration – According to the Agricultural Sector Development Support Program (ASDSP), only 63% of the land parcels in Kisumu actually have title deeds and many buyers have been conned off land or settled in land parcels belonging to other people, and hence landowners are losing their property. This is a trend that has also made investors wary of investments in the city, and,
- Political Instability and Intolerance - In times of political instability, property destruction has resulted in large losses. This discourages investments in the real estate sector by investors for fear of destruction, in times of violence
- Kisumu Market Performance:
Our market research focused on:
- Plinth Area - Research on the size of the units found in the market allows us to gauge the current offering, and put into consideration the home buyer’s preferences for sizes of houses,
- Prices - Research on prices will be used in the comparison of our products against the market prices,
- Rental Rates - Research on rental income allows us to inform potential investors on the current rental rates in other developments and also inform the investors on the prospective rental yield they can gain from investing in Kisumu, and,
- Annual Uptake - This allows the investor to appreciate the rate at which available homes are sold over a specific period, allowing the investor to gauge on whether it is profitable to invest in a given area.
The key themes covered are:
- Residential
Generally, the residential sector in Kisumu is nascent with most of the mega developments such as Victoria Gardens in Riat Hills, Translakes Estate in Mamboleo, and Lake View Breeze in Milimani Estate coming up in the last 5-years. The increase in developments is attributable to government decentralization and urbanization. As at May 2018, the sector’s performance softened, with the sector recording a decline of 3.2% points in total returns from 10.1% in May 2016 to 6.9% in May 2018, attributable to political uncertainties in the area over the 2017 election.
In our residential sector analysis, we classified the various suburbs in Kisumu into two segments:
- High-End Segment – Consists of prime suburbs in Kisumu, such as Milimani and its environs, housing mainly high net worth individuals. Houses in this segment have price points of between Kshs 11.2 mn and Kshs 14.3 mn, and,
- Middle-Income Segment – Consists of suburbs such as Kibos Estate, Kanyakwar, and Mamboleo, characterized by both high rise and low-density houses, housing mainly the middle-class. Houses in this segment have price points of between Kshs 6.3 mn and Kshs 7.6 mn.
To note:
- Detached Units refer to stand-alone houses such as townhouses, maisonettes and bungalows, and,
- Apartments refer to a self-contained housing unit occupying part of a building, also called flats
The performance of the residential theme in Kisumu is as summarized below:
- Apartments
Apartments recorded an average total return of 8.5%, with a rental yield of 5.5% and price appreciation of 3.0%. This is a 0.1% points increase in rental yield from 5.4% in May 2016, and a 1.3%points annualized decline in price appreciation from 5.6% in the same period, attributable to the political uncertainties over the 2017 election period.
The performance of the various market segments is as summarized below:
- High-End Market
The high-end segment consists of prime suburbs in Kisumu, such as Milimani and its environs. The segment recorded a decline in performance, with the rate of growth of price appreciation declining by 1.8% points p.a. from 5.9% in May 2016 to 2.4% in May 2018, and rental yields declining by 0.1% points p.a. from 5.7% to 5.6% in the same period. The decline in performance is attributable to wait and see attitude by investors over the prolonged 2017 electioneering period, which reduced economic activity in the city.
The performance of high-end apartments is as summarized below;
All values in Kshs, unless stated otherwise
|
Kisumu Apartments Performance Summary and Analysis - May 2018 |
|||||||||||||||||
|
Unit |
Unit Plinth Area (SQM) |
Price 2018 (mn) |
Price Per SQM 2018 |
Rent 2018 |
Rent Per SQM 2018 |
Annual Uptake |
Price App. 2018 |
Rental Yield 2018 |
Total Return 2018 |
Price Per SQM 2016 |
Rent Per SQM 2016 |
Annual Price App. 2016 |
Rental Yield 2016 |
Total return 2016 |
∆ in Price App. p.a |
∆ in Rental Yield p.a |
∆ in Total Return p.a |
|
2 Bed |
115 |
11.2 |
100,175 |
52,143 |
475 |
15.4% |
2.4% |
5.6% |
8.0% |
88,696 |
424 |
5.7% |
5.7% |
11.4% |
(1.7%) |
(0.1%) |
(1.7%) |
|
3 Bed |
149 |
14.3 |
99,812 |
65,000 |
449 |
16.7% |
2.3% |
5.5% |
7.8% |
90,604 |
419 |
6.1% |
5.6% |
11.7% |
(1.9%) |
0.0% |
(1.9%) |
|
Mean |
99,994 |
462 |
16.1% |
2.4% |
5.6% |
7.9% |
89,650 |
422 |
5.9% |
5.7% |
11.5% |
(1.8%) |
(0.1%) |
(1.8%) |
|||
|
|||||||||||||||||
Source: Cytonn Research May 2018
- Mid – End Market
Mid-end segment consists of estates such as Kibos, Kanyakwar, and Mamboleo, and are characterized by both high-rise and low-density houses mainly for the middle-class population of the city. This segment recorded an annual uptake of 23.4%, higher than the high-end segment at 16.1%, attributable to mid-end apartments’ affordability as they are 29.4% cheaper than the high-end segment, with a price per SQM of Kshs 99,994, against an average of Kshs 77,250 per SQM for mid-end apartments.
The performance of mid-end apartments in Kisumu is as summarized below:
All values in Kshs, unless stated otherwise
|
Kisumu Mid–End Apartments Performance Summary and Analysis - May 2018 |
|||||||||||||||||
|
Unit |
Unit Plinth Area (SQM) |
Price 2018 (mn) |
Price Per SQM 2018 |
Monthly Rent 2018 |
Rent Per SQM 2018 |
Annual Uptake |
Price App. 2018 |
Rental Yield 2018 |
Total Return 2018 |
Price Per SQM 2016 |
Rent Per SQM (2016) |
Annual Price App. 2016 |
Rental Yield 2016 |
Total Return 2016. |
∆ in Price App. p.a |
∆ in Rental Yield p.a |
∆ in Total Return p.a |
|
2 Bed |
75 |
6.3 |
84,000 |
26,667 |
356 |
23.6% |
4.2% |
5.2% |
9.4% |
74,667 |
396 |
5.3% |
4.6% |
9.9% |
(0.6%) |
0.3% |
(0.3%) |
|
3 Bed |
108 |
7.6 |
70,501 |
34,600 |
321 |
23.2% |
2.9% |
5.6% |
8.5% |
64,935 |
371 |
5.0% |
5.3% |
10.3% |
(1.1%) |
0.2% |
(0.9%) |
|
Average |
77,250 |
338 |
23.4% |
3.6% |
5.4% |
9.0% |
69,801 |
383 |
5.2% |
5.0% |
10.1% |
(0.8%) |
0.2% |
(0.6%) |
|||
|
|||||||||||||||||
Source: Cytonn Research May 2018
- Detached Units
The detached unit’s performance softened between May 2016 - May 2018, with the rate of growth of price appreciation declining by 2.4% points p.a. from 4.2% to (0.7%) and rental yields declining by 0.1% points p.a. from 4.5% to 4.4%. The decline in performance is attributable a tough operating environment, characterized by low credit supply, as a result of the implementation of the Banking (Amendment) Act 2015, which resulted in declining private sector credit growth from 25.8% in June 2014 to 1.7% as at September 2017. This led to some of the developments stalling, and a wait and see attitude by investors over the 2017 electioneering period.
The performance of detached units is as summarized below;
All values in Kshs, unless stated otherwise
|
Kisumu Residential Detached Units Performance Summary and Analysis - May 2018 |
|||||||||||||||||
|
Unit |
Unit Plinth Area (SQM) |
Price 2018 (mn) |
Price Per SQM (2018) |
Rent (2018) |
Rent per SQM (2018) |
Annual Uptake |
Price App. |
Rental Yield 2018 |
Total Return 2018 |
Price per SQM (2016) |
Rent per SQM (2016) |
Annual Price App. 2016 |
Rental Yield 2016 |
Total Return 2016 |
∆ in Price App. p.a |
∆ in Rental Yield p.a |
∆ in Total Return p.a |
|
3 Bed |
159 |
13.6 |
85,684 |
50,000 |
317 |
13.4% |
(0.6%) |
4.4% |
3.8% |
104,480 |
397 |
3.9% |
4.8% |
8.7% |
(2.3%) |
(0.2%) |
(2.4%) |
|
4 Bed |
276 |
22.0 |
78,898 |
76,667 |
292 |
7.90% |
(0.7%) |
4.4% |
3.7% |
86,372 |
355 |
4.4% |
4.2% |
8.6% |
(2.6%) |
0.1% |
(2.4%) |
|
Average |
82,291 |
305 |
10.7% |
(0.7%) |
4.4% |
3.8% |
95,426 |
376 |
4.2% |
4.5% |
8.7% |
(2.4%) |
(0.1%) |
(2.4%) |
|||
|
|||||||||||||||||
Source: Cytonn Research May 2018
- Residential Sector Summary
In terms of overall market performance, the residential sector recorded total returns of 6.9%, a 3.2% point (1.6% points annualized) decline from the 10.1% total returns recorded in May 2016. The performance is attributable to a decline in price appreciation, which dropped by 1.7% points y/y.
The residential sector performance is as summarized below;
All values in Kshs, unless stated otherwise
|
Kisumu Residential Sector Performance Summary- May 2018 |
|||||||||||||||
|
Segment |
Unit Type |
Average Price Per SQM 2018 |
Average Rent Per SQM 2018 |
Annual Uptake |
Price App. 2018 |
Rental Yield 2018 |
Average Total Returns 2018 |
Average price Per SQM 2016 |
Average Rent Per SQM 2016 |
Price App. 2016 |
Rental Yield 2016 |
Average Total Returns 2016 |
∆ in Price App. p.a |
∆ in Rental Yield p.a |
∆ in Total Return p.a |
|
Middle income-End |
Apartments |
70,501 |
338 |
23.4% |
3.6% |
5.4% |
9.0% |
69,801 |
383 |
5.2% |
5.0% |
10.1% |
(0.8%) |
0.2% |
(0.6%) |
|
High-End |
Apartments |
99,994 |
462 |
16.1% |
2.4% |
5.6% |
7.9% |
89,650 |
422 |
5.9% |
5.7% |
11.6% |
(1.8%) |
(0.1%) |
(1.8%) |
|
Apartments Average |
85,247 |
400 |
19.7% |
3.0% |
5.5% |
8.5% |
79,725 |
402 |
5.5% |
5.3% |
10.9% |
(1.3%) |
0.1% |
(1.2%) |
|
|
Detached Units |
82,291 |
305 |
10.7% |
(0.7%) |
4.4% |
3.8% |
95,426 |
376 |
4.2% |
4.5% |
8.7% |
(2.4%) |
0.0% |
(2.4%) |
|
|
Average |
84,262 |
368 |
16.7% |
1.8% |
5.1% |
6.9% |
84,959 |
394 |
5.1% |
5.1% |
10.1% |
(1.7%) |
0.0% |
(1.6%) |
|
|
|||||||||||||||
Source: Cytonn Research May 2018
- Commercial Properties
- Office Space
Over the last 2-years, the performance of commercial offices in Kisumu has picked up, with average rental yields for Grade C offices in the sector increasing by 0.3% points p.a., from 7.0% in May 2016 to 7.6% in May 2018. The occupancy rates were also in an upward trend, increasing by 1.5% points from 90.6% in May 2016 to 93.3% in May 2018. The better performance is as a result of an increase in demand for office space in the city, driven by devolution and growth in SME’s. Generally, Kisumu City lacks good commercial buildings with most of the buildings being Grade C, however over the last year, the market welcomed Grade B buildings such as Mega Plaza and University of Nairobi building located along Oginga Odinga Rd.
The summary of the sector’s performance is as below:
All values in Kshs, unless stated otherwise
|
Kisumu Commercial Office Space Analysis – May 2018 |
|||||||||
|
Office Grade |
Rent per SQFT Per Month (2018) |
Occupancy Rate 2018 |
Rental Yield 2018 |
Rent Per SQFT Per Month 2016 |
Occupancy Rate 2016 |
Rental Yields 2016 |
∆ in Rental Charges p.a |
∆ in Occupancy Rate p.a |
∆ in Rental Yield p.a |
|
Grade B |
80 |
80.0% |
6.4% |
||||||
|
Grade C |
78 |
93.3% |
7.6% |
76 |
90.6% |
7.0% |
1.6% |
1.5% |
0.3% |
|
Average |
79 |
86.7% |
7.0% |
76 |
90.6% |
7.0% |
1.6% |
1.5% |
0.3% |
|
|||||||||
Source: Cytonn Research May 2018
- Retail Space
The retail sector in Kisumu recorded 0.2% points annualized increase in rental yields from 9.0% in May 2016 to 9.4% in May 2018, attributable to 1.7% points increase in occupancy rates from 75.8% in May 2016 to 78.3% in May 2018. This was driven by the area’s high urbanisation rate averaging at 5.5% p.a. compared to Kenya’s average urbanisation rate of 4.4% attributable to devolution, which is the pull factor for growth in population in the area, and a key driver for the retail sector.
The summary of the sector’s performance is as below:
All values in Kshs, unless stated otherwise
|
Kisumu Commercial Retail Space Performance Summary and Analysis - May 2018 |
|||||||||
|
Office Grade |
Rent Per SQFT Per Month 2018 |
Occupancy Rate 2018 |
Rental Yield 2018 |
Rent Per SQFT Per Month 2016 |
Occupancy Rate 2016 |
Rental Yields 2016 |
∆ in Rental Charges p.a |
∆ in Occupancy Rate p.a |
∆ in Rental Yield p.a |
|
Neighbourhood mall |
168 |
73.3% |
10.4% |
179 |
78.3% |
10.9% |
(3.3%) |
(3.2%) |
(0.3%) |
|
Community Mall |
135 |
83.3% |
8.4% |
126 |
73.3% |
7.0% |
3.8% |
6.6% |
0.7% |
|
Average |
151 |
78.3% |
9.4% |
152 |
75.8% |
9.0% |
0.3% |
1.7% |
0.2% |
|
|||||||||
Source: Cytonn Research May 2018
- Land Analysis Summary
The land sector recorded an annualized capital appreciation of 8.9%, attributed to speculations and increased demand for land in residential zones such as Riat Hills as the residents shift to the outskirts of Kisumu City due to congestion in estates around Kisumu CBD
The summary of the sector’s performance is as below:
All values in Kshs, unless stated otherwise
|
Land Performance in Kisumu - May 2018 |
|||||
|
Developer |
Price Per Acre 2016 |
Price Per SQM 2016 |
Price Per Acre - 2018 |
Price Per SQM 2018 |
Annualized Capital Appreciation |
|
Riat Hills |
10,000,000 |
2,500 |
12,680,000 |
3,170 |
12.6% |
|
Milimani |
120,000,000 |
30,000 |
138,333,000 |
34,583 |
7.4% |
|
Mamboleo |
15,000,000 |
3,750 |
17,083,000 |
4,271 |
6.7% |
|
Average |
8.9% |
||||
|
|||||
Source: Cytonn Research May 2018
- Kisumu Market Summary Analysis
The Kisumu real estate sector recorded a total return of 16.1%, with a rental yield of 7.2% and a capital appreciation at 8.9% p.a.
The summary of the real estate sector performance is as below;
|
Kisumu Real Estate Market Performance Summary and Analysis - May 2018 |
|||||||
|
Theme |
Annual Uptake 2018 |
Occupancy Rates 2018 |
Rental Yields 2018 |
Annualized Price Appreciation |
Annualized Capital Appreciation |
||
|
Retail Space |
78.3% |
9.4% |
|||||
|
Commercial offices |
86.7% |
7.0% |
|||||
|
Residential |
16.7% |
75.1% |
5.1% |
1.8% |
|||
|
Land |
8.9% |
||||||
|
Average |
80.0% |
7.2% |
1.8% |
8.9% |
|||
|
|||||||
Source: Cytonn Research May 2018
- Comparative Analysis
Comparison with other Counties in Kenya:
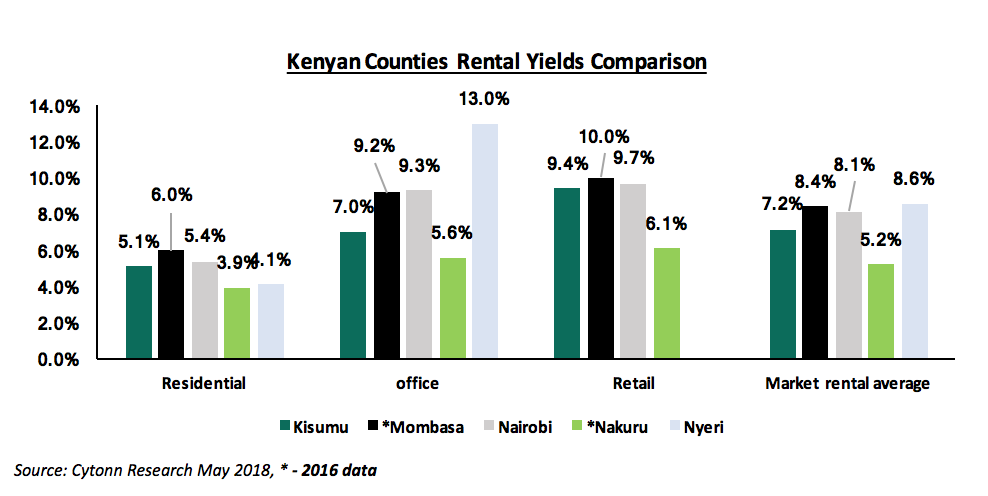
- Across all real estate sectors, Kisumu real estate recorded average rental yields of 7.2%, which is lower than Nyeri, Mombasa and Nairobi Counties by 1.4% points, 1.2% points, and 0.9% points, respectively, and 2.0% points higher than Nakuru County.
- For the residential sector, Kisumu recorded average rental yields of 5.1%, higher than Nakuru and Nyeri which recorded average rental yields of 3.9% and 6.1%, respectively, and lower than Mombasa and Nairobi with average rental yields of 6.0% and 5.4%, respectively.
- For the commercial office sector, Kisumu has average rental yields of 7.0%, higher than Nakuru Town, which has average rental yields of 5.6%, and lower than Mombasa, Nairobi and Nyeri, which have average rental yields of 9.2%, 9.3% and 13.0%, respectively.
- In the retail sector, Kisumu recorded average rental yields of 9.4%, outperforming Nakuru with 6.1%, but lower than Mombasa and Nairobi which have average rental yield of 10.0% and 9.7%, respectively.
Below is a summary of the analysis;
- Market Performance and Outlook
We have analyzed and identified the investment opportunity in Kisumu City, based on May 2016 and May 2018 performance as shown below;
|
Kisumu Real Estate Market Performance and Outlook |
||||
|
Theme |
Performance (May 2016) |
Performance (May 2018) |
Investment Opportunity |
Outlook |
|
Residential |
The residential sector had total returns of 10.2% on average; with average rental yields of 5.1% and a price appreciation of 5.1%. |
The residential sector has total returns of 6.9% on average, with rental yield of 5.1% and price appreciation of 1.8%. Residential sector has recorded a 3.3% decline in total return attributed to a 1.7% annualized decline in price appreciation due to political uncertainties that adversely affected the real estate sector |
Apartments for rent in suburbs such as Milimani, Lolwe, Migosi and Mamboleo suburbs, which record an average rental yield of 5.5% |
 |
|
Commercial Offices |
Most offices in the market were Grade C, with average rental yields of 7.0% and an occupancy rate of 90.6% |
Grade C offices in the market have an average rental yield of 7.6%, which is an increase of 0.3% points p.a. and an average occupancy rate of 93.3%. The office sector has witnessed entry of Grade B office space that have an average rental yield of 6.4% at an average occupancy of 80.0% |
The sector is still nascent and presents an opportunity for Grade A & B offices, recording higher rental charges at Kshs 80 compared to Grade C at Kshs 78 and have an average occupancy rate of 80.0% in the first year of operation |
 |
|
Retail Space Sector |
The commercial retail sector recorded rental yields of 9.0% at an average occupancy rate of 75.8% |
The commercial retail sector has rental yields of 9.4% at an average occupancy of 78.3%. This is an annualized increase of 0.2% points in rental yield, the increase is driven by a 1.7% points annual increase in occupancy rates on the back of growing SME’s. |
We remain neutral over the sector given the increased supply of malls translating to 149 SQM per 1,000 urban persons compared to other counties such Nairobi with 145 SQM per 1,000 urban persons and Kiambu at 45 SQM per 1,000 persons |
 |
|
Land |
Land in Kisumu City recorded an annual capital appreciation of 8.9% over the last 2-years |
The opportunity in the sector is in emerging residential zones such as Riat Hills driven by speculation and the market exodus from congested Kisumu city CBD |
 |
|
Out of the four real estate themes under evaluation in Kisumu, 2 themes, that is commercial offices and land have a positive outlook, retail sector has a neutral outlook, while residential has a negative outlook, thus we retain a neutral outlook for the Kisumu real estate market. The market, however, has pockets of value in sectors such as Grade A and B commercial offices driven by devolution and growth in SMEs while the land sector is driven by demand from developers as they expand from the CBD to relatively new suburbs such as Riat Hills.
Disclaimer:The views expressed in this publication are those of the writers where particulars are not warranted. This publication, which is in compliance with Section 2 of the Capital Markets Authority Act Cap 485A, is meant for general information only and is not a warranty, representation, advice or solicitation of any nature. Readers are advised in all circumstances to seek the advice of a registered investment advisor.


