In July 2021, we released the Nairobi Metropolitan Area Land Report 2021, which highlighted that the NMA land sector recorded an average annual price appreciation of 1.5% in 2020/21, with asking prices averaging at Kshs 125.5 mn, thereby realizing a 10-year capital appreciation CAGR of 10.2% from Kshs 47.5 mn recorded in 2011. The performance was mainly driven by the increased demand for land in low rise areas which recorded the highest annualized capital appreciation of 4.5% compared to a market average of 1.5%. Land prices in the commercial areas of the NMA registered the highest price correction declining by 3.6%. This was attributed to; i) their unaffordability, with average prices coming in at Kshs 404.4 mn compared to a market average of Kshs 125.5 mn, and, ii) limited development activities in the Real Estate commercial office sector resulting from oversupply of spaces thus some developers halting operations as they awaited the absorption of the existing spaces.
This week, we update our report by discussing the overall performance of the Nairobi Metropolitan Area (NMA) overtime, as well as the factors affecting the performance of the sector and then give our conclusion and outlook for the sector. We shall focus on;
- Introduction to the Nairobi Metropolitan Area (NMA) Land Sector,
- NMA Land Sector Performance 2022 Based on Various Locations,
- Summary and investment opportunity in the sector, and,
- Conclusion and Outlook for the Sector.
Section I: Introduction to the Nairobi Metropolitan Area (NMA) Land Sector
The Nairobi Metropolitan Area (NMA) land sector has continued to be resilient in its overall performance, evidenced by an improvement in performance in the past despite setbacks such as the COVID-19 pandemic, and an oversupply in select Real Estate sectors such as the commercial office and retail sectors that weigh down demand for land in the commercial zones of the NMA. Some of the factors that supported the performance of the sector in 2021/22 include;
- Rapid Infrastructure Developments: The government of Kenya continued to rapidly initiate and implement various infrastructure projects aimed at improving the economy’s performance. This in turn also boosted the performance of the Real Estate land sector through increased demand and uptake, given that infrastructure is a key element in the performance of land, and property market as a whole. Some of the projects that were completed include; the 27.1 Km Nairobi Expressway, and, 3.5 Km Mugi Road among many others, whereas the projects in the pipeline include; Athi River Machakos Turn Off, ii) Western By Pass, and, iii) Nairobi Bulk Water Supply Project, among many others,
- Positive Demographics: This is evidenced by Kenya’s relatively high urbanization and population growth rates of 4.0% p.a and 2.2% p.a, respectively, against the global average of 1.8% p.a and 1.0% p.a, respectively, as at 2021, which in turn drove the demand for development land,
- Continued Focus on the Affordable Housing Initiative: The Affordable Housing initiative continues to take shape in the country particularly in Nairobi and its environs. Consequently, the demand for development land has increased, with some of the ongoing projects being; Athi River Waterfront project, Pangani Affordable Housing Project, and, River Estate project in Ngara, among many others,
- Increased Demand for Land in the NMA satellite towns: Inadequate land within Nairobi has driven developers to source for development land in the satellite towns of Nairobi thus boosting their performance. Demand for land in the satellite towns has also been fueled by the affordability of land in the areas, compared to Nairobi suburbs, and,
- Recovery of the Economy: This has boosted the purchasing power of people following the onset of the pandemic that strained the economy, as various people lost their jobs or their business’ performance dwindled.
Contrary to the aforementioned supporting factors, the sector’s optimum performance was still weighed down by;
- Inadequate Infrastructure in some areas: Despite government’s efforts to implement and conclude infrastructure projects, there are areas with inadequate infrastructure such as water, roads, and sewer thus the optimum demand for land in these areas is affected,
- High Construction Costs: Increase in the cost of construction has led to some developers withholding or stalling their development projects due to the high cost of construction materials. This in turn has trickled down to the demand for land which is weighed down due to withheld development plans by developers, and,
- Oversupply in Select Real Estate Sectors: These sectors include the commercial office and retail sectors with oversupply of space at 6.7 mn SQFT and 3.0 mn SQFT in the NMA, respectively. With this, some developers have had to halt their development plans as they await absorption of their existing spaces.
Despite the challenges affecting the sector, some of the factors that are likely to shape it going forward include;
- Digitization of Land Records: President Uhuru Kenyatta launched the National Land Information Management System (NLIMS) in April 2021, marking the culmination of years of digitization of land records in Kenya. This was in order to curb fraud cases and ease land transaction processes, and,
- Land Reform Policies: These include regulations such as the Draft National Land Surveying and Mapping Policy, 2021 which was introduced in order to guide the practice of land surveying and mapping in various sectors of the economy, thus easing land transactions in the country. However, the 15.0% increase in the Capital Gains Tax (CGT) on transfer or sale of property by an individual or company, which was initiated in June 2022 is expected to discourage some potential property buyers from purchasing property such as land due to the high transaction costs involved.
Section II: NMA Land Sector Performance 2022 Based on Various Locations
For the analysis, we conducted research on various major towns within the NMA and classified them as follows;
- High Rise Residential Areas: They comprise of areas such as Dagoretti, Githurai, Embakasi, and Kasarani, and are majorly characterized by the numerous high-rise buildings such as the apartments found within,
- Low Rise Residential Areas: These are areas which generally consist of low-rise buildings such as the bungalows, maisonettes and villas. They include; Kitisuru, Runda, Ridgeways, Kileleshwa, Karen and Spring Valley,
- Commercial Zones: They comprise of areas such as Kilimani, Westlands, Riverside and Upperhill, and are popular because of the numerous commercial office buildings that they have, and,
- Satellite Towns: Land in the area was categorized into serviced (site and service schemes) and unserviced land. It comprises of areas such as Syokimau, Ruiru, Juja, Thika, Rongai, Athi River, and, Limuru.
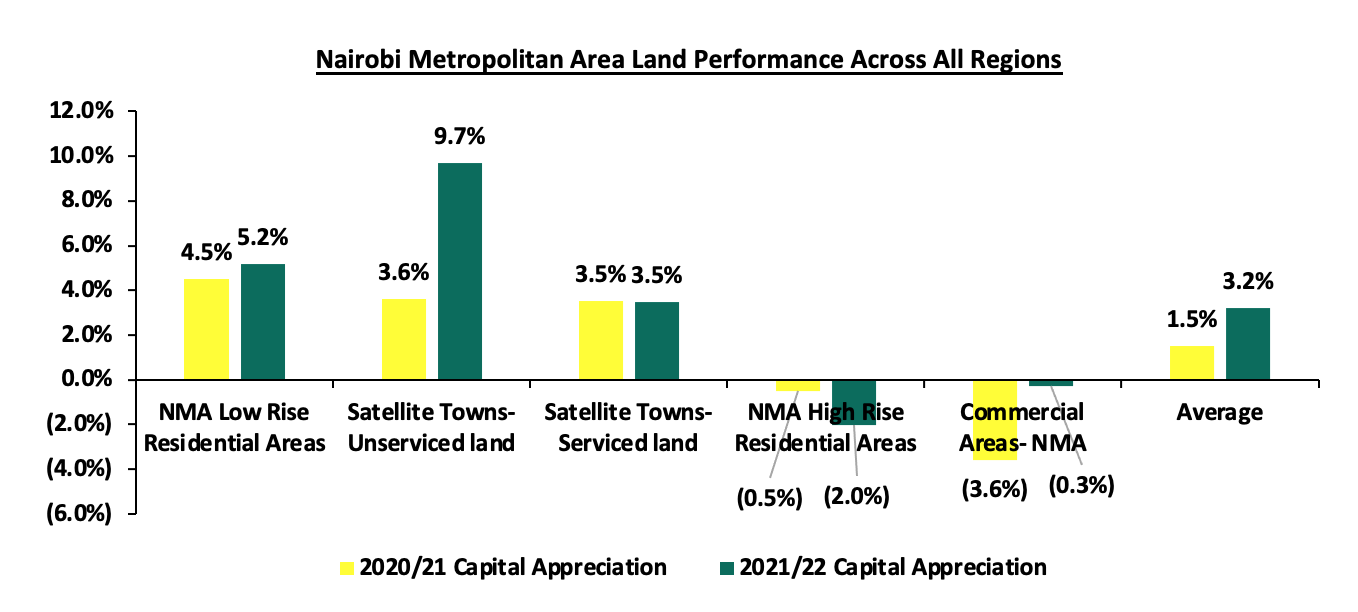
The NMA land sector recorded an improvement in performance with the average annual price appreciation coming in at 3.2% in FY 2021/22, 1.7% points higher than 1.5% appreciation recorded in FY’2020/21. The performance represented a 10-year price appreciation CAGR of 11.4%, with the average selling price for land coming in at Kshs 126.8 mn in FY’2021/22, from Kshs 47.5 mn in 2011. This signifies the continued rise in the demand for development land mainly driven by; i) rapid population and urbanization growth rates, ii) rapid infrastructure developments opening up areas for property investments, and, iii) growing popularity of the affordable housing initiative fueling demand for land particularly in the satellite towns of Nairobi. The summary of the performance is as shown below;
The table below shows the performance summary of the NMA land sector based on the average asking prices, CAGR and capital appreciation;
All values in Kshs mn unless stated otherwise
|
Summary of the Land Performance Across All regions in Nairobi Metropolitan Area |
||||||||||||
|
Location |
*Price in 2011 |
*Price in 2015 |
*Price in 2016 |
*Price in 2017 |
*Price 2018/19 |
*Price 2019/20 |
*Price 2020/21 |
*Price 2021/22 |
10-Year CAGR |
2020/21 Capital Appreciation |
2021/22 Capital Appreciation |
∆ in capital appreciation |
|
Satellite Towns-Unserviced land |
4.2 |
9.5 |
12.8 |
13.8 |
14.2 |
14.7 |
15.2 |
17.0 |
14.9% |
3.6% |
9.7% |
6.1% |
|
NMA Low Rise Residential Areas |
54.5 |
94.3 |
113.0 |
119.7 |
119.3 |
120.7 |
123.8 |
130.5 |
10.0% |
4.5% |
5.2% |
3.8% |
|
Satellite Towns-Serviced land |
5.5 |
12.7 |
14.0 |
15.0 |
15.0 |
15.0 |
15.7 |
16.1 |
12.3% |
3.5% |
3.5% |
0.0% |
|
Commercial Areas- NMA |
145.0 |
359.3 |
421.8 |
433.0 |
421.0 |
419.0 |
404.6 |
403.4 |
11.0% |
(3.6%) |
(0.3%) |
3.6% |
|
NMA High Rise Residential Areas |
28.5 |
57.5 |
65.0 |
69.8 |
68.0 |
68.8 |
68.4 |
67.0 |
8.6% |
(0.5%) |
(2.0%) |
(4.6%) |
|
Average |
47.5 |
106.7 |
125.3 |
130.3 |
127.5 |
127.6 |
125.8 |
126.8 |
11.4% |
1.5% |
3.2% |
1.7% |
Source: Cytonn Research
Performance per node:
- Satellite Towns-Unserviced Land
Unserviced land in the satellite towns of Nairobi recorded an average annualized capital appreciation of 9.7%, with Ruiru being the best performing node with a YoY capital appreciation of 19.1% attributed to; i) adequate infrastructural developments such Thika Superhighway, ii) proximity to amenities such as Spur Mall, Ruiru Sports Club, and, Kenyatta University, among others, and, iii) positive demographics fueling demand. On the other hand, Rongai and Athi River recorded price corrections of 0.7% and 2.7% to Kshs 18.9 mn and Kshs 4.4 mn, respectively, from Kshs 19.0 mn and Kshs 4.5 mn, respectively, as a result of a slight decline in the demand for land in the areas.
All values in Kshs mn unless stated otherwise
|
Land Performance-Satellite Towns in Nairobi Metropolitan Area- Unserviced Land |
||||||||||||
|
Location |
*Price in 2011 |
*Price in 2015 |
*Price in 2016 |
*Price in 2017 |
*Price 2018/19 |
*Price 2019/20 |
*Price 2020/21 |
*Price 2021/22 |
10-Year CAGR |
2020/21 Capital Appreciation |
2021/22 Capital Appreciation |
∆ in capital appreciation |
|
Ruiru |
7.0 |
15.0 |
19.0 |
20.0 |
21.0 |
22.0 |
23.6 |
28.1 |
14.9% |
6.9% |
19.1% |
12.2% |
|
Juja |
3.0 |
7.0 |
9.0 |
10.0 |
10.0 |
10.0 |
10.6 |
12.2 |
15.0% |
5.5% |
14.8% |
9.3% |
|
Utawala |
6.0 |
9.0 |
10.0 |
11.0 |
12.0 |
12.0 |
12.4 |
14.1 |
8.9% |
3.2% |
13.8% |
10.6% |
|
Limuru |
5.0 |
13.0 |
17.0 |
20.0 |
20.0 |
21.0 |
21.2 |
24.1 |
17.0% |
1.0% |
13.8% |
12.8% |
|
Ongata Rongai |
2.0 |
10.0 |
18.0 |
18.0 |
18.0 |
19.0 |
19.0 |
18.9 |
25.2% |
0.0% |
(0.7%) |
(0.7%) |
|
Athi River |
2.0 |
3.0 |
4.0 |
4.0 |
4.0 |
4.0 |
4.5 |
4.4 |
8.1% |
5.1% |
(2.7%) |
(7.8%) |
|
Average |
4.2 |
9.5 |
12.8 |
13.8 |
14.2 |
14.7 |
15.2 |
17.0 |
14.9% |
3.6% |
9.7% |
6.1% |
Source: Cytonn Research
- Nairobi Suburbs - Low Rise Residential Areas
Low-rise residential areas of Nairobi suburbs registered a 10-year CAGR of 10.0%, with asking prices coming in at Kshs 130.5 mn in FY2021/22 from the Kshs 54.5 mn recorded in 2011, whereas average YoY capital appreciation came in at 5.2% in FY’2021/22. These areas continue to remain attractive to investors due to; i) their serene environments attracting demand particularly from the high-end income earners, ii) privacy enhanced by the sparse population, iii) relatively affordable prices at Kshs 95.4 mn per acre compared to the high-rise areas averaging at Kshs 133.7 mn per acre.
In terms of performance per node, Ridgeways was the best performing with an average price appreciation of 15.5%, 10.3% points higher than the market average of 5.2% due to; i) its exclusivity driving demand for residential development land, ii) availability of development land, iii) ample infrastructure servicing the area such as Kiambu and Ridgeways Roads among others, iv) proximity to adequate amenities such as Ridgeways Mall, and Kigwa Ridge School among others, and, v) strategic location as it’s connected to high end areas like Muthaiga, and Garden Estate hence attracting investments.
All values is Kshs unless stated otherwise
|
Land Performance-Low Rise Residential Areas in Nairobi Metropolitan Area |
||||||||||||
|
Location |
*Price in 2011 |
*Price in 2015 |
*Price in 2016 |
*Price in 2017 |
*Price 2018/19 |
*Price 2019/20 |
*Price 2020/21 |
*Price 2021/22 |
10-Year CAGR |
2020/21 Capital Appreciation |
2021/22 Capital Appreciation |
∆ in capital appreciation |
|
Ridgeways |
24.0 |
51.0 |
62.0 |
68.0 |
65.0 |
66.0 |
68.8 |
81.4 |
13.0% |
4.0% |
15.5% |
11.5% |
|
Kitisuru |
32.0 |
59.0 |
70.0 |
70.0 |
71.0 |
73.0 |
77.9 |
90.3 |
10.9% |
6.3% |
13.7% |
7.4% |
|
Runda |
33.0 |
58.0 |
67.0 |
68.0 |
68.0 |
70.0 |
74.3 |
81.7 |
9.5% |
3.8% |
9.0% |
5.2% |
|
Karen |
25.0 |
40.0 |
46.0 |
52.0 |
53.0 |
56.0 |
59.6 |
62.0 |
9.5% |
5.1% |
3.8% |
(1.3%) |
|
Kileleshwa |
149.0 |
227.0 |
286.0 |
306.0 |
311.0 |
303.0 |
300.9 |
305.8 |
7.5% |
(0.7%) |
1.6% |
2.3% |
|
Spring Valley |
64.0 |
131.0 |
147.0 |
154.0 |
148.0 |
156.0 |
161.0 |
161.7 |
9.7% |
3.1% |
0.4% |
(2.7%) |
|
Average |
54.5 |
94.3 |
113.0 |
119.7 |
119.3 |
120.7 |
123.8 |
130.5 |
10.0% |
4.5% |
5.2% |
3.8% |
Source: Cytonn Research
- Satellite Towns - Serviced Land
Serviced land in the satellite towns of Nairobi recorded an average annualized capital appreciation of 3.5% with Syokimau being the best performing area recording an average annualized capital appreciation of 17.5%. This was mainly driven by; i) its strategic location along the recently completed Nairobi Expressway project promoting investments, ii) presence of the commuter train station making it easier for people to navigate various areas whilst avoiding traffic along the busy Mombasa Road, iii) relatively affordable land prices which came in at Kshs 13.9 mn per acre against the market average of Kshs 16.1 mn per acre, and iv) presence of a growing middle income class driving demand for land investments. On the other hand, Ruai recorded a price correction of 13.9% attributed to reduced demand of land as investors focused on areas witnessing more Real Estate related activities.
|
Land Performance-Satellite Towns in Nairobi Metropolitan Area- Serviced Land |
||||||||||||
|
Location |
*Price in 2011 |
*Price in 2015 |
*Price in 2016 |
*Price in 2017 |
*Price 2018/19 |
*Price 2019/20 |
*Price 2020/21 |
*Price 2021/22 |
10-Year CAGR |
2020/21 Capital Appreciation |
2021/22 Capital Appreciation |
∆ in capital appreciation |
|
Syokimau-Mlolongo |
3.0 |
12.0 |
12.0 |
12.0 |
12.0 |
12.0 |
11.8 |
13.9 |
16.5% |
(1.4%) |
17.5% |
18.9% |
|
Thika |
5.0 |
7.0 |
8.0 |
10.0 |
10.0 |
10.0 |
10.4 |
11.6 |
8.8% |
3.5% |
11.5% |
8.0% |
|
Ruiru-Juja |
8.0 |
18.0 |
19.0 |
21.0 |
23.0 |
24.0 |
25.3 |
25.9 |
12.4% |
5.2% |
2.2% |
(3.0%) |
|
Ongata Rongai |
7.0 |
16.0 |
19.0 |
19.0 |
19.0 |
18.0 |
20.0 |
20.4 |
11.3% |
8.9% |
1.8% |
(7.1%) |
|
Athi River |
2.0 |
11.0 |
13.0 |
13.0 |
12.0 |
12.0 |
13.1 |
13.3 |
20.9% |
8.7% |
1.6% |
(7.1%) |
|
Ruai |
8.0 |
12.0 |
13.0 |
15.0 |
14.0 |
14.0 |
13.5 |
11.6 |
3.8% |
(3.6%) |
(13.9%) |
(10.3%) |
|
Average |
5.5 |
12.7 |
14.0 |
15.0 |
15.0 |
15.0 |
15.7 |
16.1 |
12.3% |
3.5% |
3.5% |
0.0% |
Source: Cytonn Research
- Nairobi Suburbs - Commercial Zones
Land in the commercial zones realized a price correction of 0.3% in their asking prices which came in at Kshs 403.4 mn in H1’2022, from the Kshs 404.6 mn that was recorded in H1’2021. Riverside and Westlands were the best performing nodes with capital appreciations of 2.2% and 1.1%, respectively, due to increased demand for development land in the areas driven by; their close proximity to the Nairobi CBD, presence of various international organizations, and, infrastructure developments such as the Riverside Drive and Nairobi Expressway promoting accessibility. Some of the ongoing projects in these areas include: The Cube and Sandalwood commercial office projects both located in Riverside, and, One Principal Place and the Piano commercial office projects both located in Westlands. On the other hand, Upper hill and Kilimani realized price corrections of 3.2% and 0.3%, respectively, due to declined demand for development resulting from expensive land in the area.
All values in Kshs mn unless stated otherwise
|
Land Performance-Commercial Zones in Nairobi Metropolitan Areas |
||||||||||||
|
Location |
*Price in 2011 |
*Price in 2015 |
*Price in 2016 |
*Price in 2017 |
*Price 2018/19 |
*Price 2019/20 |
*Price 2020/21 |
*Price 2021/22 |
10-Year CAGR |
2020/21 Capital Appreciation |
2021/22 Capital Appreciation |
∆ in capital appreciation |
|
Riverside |
116.0 |
343.0 |
362.0 |
361.0 |
363.0 |
351.0 |
335.7 |
343.1 |
11.5% |
(4.6%) |
2.2% |
6.8% |
|
Westlands |
150.0 |
350.0 |
453.0 |
474.0 |
430.0 |
421.0 |
413.6 |
418.3 |
10.8% |
(1.8%) |
1.1% |
2.9% |
|
Kilimani |
114.0 |
294.0 |
360.0 |
387.0 |
403.0 |
398.0 |
381.7 |
380.4 |
12.8% |
(4.3%) |
(0.3%) |
4.0% |
|
Upper Hill |
200.0 |
450.0 |
512.0 |
510.0 |
488.0 |
506.0 |
487.3 |
471.9 |
9.0% |
(3.8%) |
(3.2%) |
0.6% |
|
Average |
145.0 |
359.3 |
421.8 |
433.0 |
421.0 |
419.0 |
404.6 |
403.4 |
11.0% |
(3.6%) |
(0.3%) |
3.6% |
Source: Cytonn Research
- Nairobi Suburbs – High Rise Residential Areas
The asking prices for land in the high-rise residential areas of the NMA recorded an overall 2.0% price correction, with prices coming in at Kshs 67.0 mn in FY’2021/22 from Kshs 68.4 mn that was realized in FY’2020/21. The decline in performance was mainly driven by the reduced demand for land in these areas, as a result of the inadequate land for development.
All values in Kshs mn unless stated otherwise
|
Land Performance-High Rise Residential Areas in Nairobi Metropolitan Area |
||||||||||||
|
Location |
*Price in 2011 |
*Price in 2015 |
*Price in 2016 |
*Price in 2017 |
*Price 2018/19 |
*Price 2019/20 |
*Price 2020/21 |
*Price 2021/22 |
10-Year CAGR |
2020/21 Capital Appreciation |
2021/22 Capital Appreciation |
∆ in capital appreciation |
|
Dagoretti |
28.0 |
81.0 |
95.0 |
99.0 |
100.0 |
103.0 |
95.2 |
95.2 |
13.0% |
(3.3%) |
0.0% |
3.3% |
|
Embakasi |
33.0 |
61.0 |
60.0 |
70.0 |
61.0 |
63.0 |
67.2 |
66.9 |
7.3% |
6.3% |
(0.5%) |
(6.8%) |
|
Kasarani |
32.0 |
51.0 |
60.0 |
64.0 |
66.0 |
65.0 |
67.7 |
66.9 |
7.7% |
3.9% |
(1.2%) |
(5.1%) |
|
Githurai |
21.0 |
37.0 |
45.0 |
46.0 |
45.0 |
44.0 |
43.5 |
39.1 |
6.4% |
(1.2%) |
(11.2%) |
(10.0%) |
|
Average |
28.5 |
57.5 |
65.0 |
69.8 |
68.0 |
68.8 |
68.4 |
67.0 |
8.6% |
(0.5%) |
(2.0%) |
(4.6%) |
Source: Cytonn Research
Section III: Summary and Investment Opportunity in the Sector
The table below summarizes the performance of the various areas:
|
Summary and Conclusions- y/y Capital Appreciation Nairobi Metropolitan Area |
|
|
Unserviced Land Capital Appreciation |
|
|
FY’2021/22 |
Areas |
|
>5.0% |
Ruiru, Juja, Kitisuru, Runda, Ridgeways, Limuru, Utawala |
|
1.0%- 4.9% |
Kileleshwa, Riverside, Westlands, Karen |
|
0.0% |
Dagoretti |
|
<1.0% |
Embakasi, Kasarani, Githurai, Kilimani, Upper Hill, Spring Valley, Rongai, Athi River |
|
Site and Service Capital Appreciation |
|
|
FY’2021/22 |
Areas |
|
>5.0% |
Syokimau-Mlolongo, Thika |
|
1.0%- 4.9% |
Ruiru-Juja, Rongai, Athi River |
|
<1.0% |
Ruai, |
Source: Cytonn Research
Investment Opportunity
- Satellite Towns (Unserviced land)- The investment opportunity in this segment lies in Ruiru, and Juja, submarkets which registered the highest YoY capital returns at 19.1% and 14.8%, respectively, against a market average of 9.7%. The remarkable performance was mainly driven by i) the availability of adequate infrastructure promoting investment opportunities such as Thika superhighway, ii) relatively affordable land prices, and, iii) the increased demand for land to develop student housing facilities as these areas host various institutions such as the Zetech College, Kenyatta University, and, the Jomo Kenyatta University among many others,
- Low Rise Residential Areas- The investment opportunity in this segment lies in Ridgeways and Kitisuru which recorded the highest annual capital appreciations of 15.5% and 13.7%, respectively, against the market average of 5.2%. The performance was driven by the relatively high demand resulting from their exclusivity, prime locations attracting high net worth investments, availability of development land, and, adequate infrastructure and amenities such as the Kigwa, Ridgeways, and, Kitisuru roads,
- Satellite Towns (Serviced Land)- Syokimau/Mlolongo and Thika present the best investment opportunity having recorded capital appreciations of 17.5% and 11.5%, respectively, against the 3.5% market average. The performance was supported by; i) rapid demand driven by the existing growing middle income class earners, ii) availability of major infrastructure developments such as the commuter train station in Syokimau, Thika Superhighway, and Nairobi Expressway among others, iii) availability of ample amenities such as water and electricity, and, iv) relatively affordable land prices,
- Commercial Zones- Riverside and Westlands present the best investment opportunity in this segment having registered a 2.2% and 1.1% increase in prices in FY’2021/22, respectively, driven by; adequate infrastructure opening areas for investments such as the Nairobi Expressway, adequate amenities such as the GTC Mall among others, and, their close proximity to Nairobi’s Central Business District (CBD), and,
- High Rise Residential Areas- Dagoretti presents the better investment opportunity in this segment with a stable performance having maintained its FY’2020/21 performance, compared to other areas such as Embakasi, Kasarani, and Githurai which recorded price corrections of 0.5%, 1.2%, and, 11.2%, respectively.
Section IV: Conclusion and Outlook for the Sector
|
Indicator |
2021 Projections |
2022 Projections |
2021 Outlook |
2022 Outlook |
|
Infrastructure Development |
|
|
Positive |
Positive |
|
Legal Reforms |
|
|
Positive |
Positive |
|
Credit Supply |
|
|
Negative |
Negative |
|
Real Estate Activities |
|
|
Neutral |
Neutral |
|
Land Sector Performance |
|
|
Positive |
Positive |
We have three positive outlooks; for infrastructure development, legal reforms and land sector performance, one neutral outlook for Real Estate activities and one negative outlook for credit supply thereby bringing our overall outlook for the sector to POSITIVE. We expect the performance to be further boosted by factors driving demand for development land such as; i) Increased infrastructure developments, ii) Roll out of numerous affordable housing projects, iii) Affordability of land in the satellite towns, and, iii) Rapid urbanization and population growth rates at 4.0% p.a and 2.2% p.a, respectively, against the global average of 1.8% p.a and 1.0% p.a, respectively.
Disclaimer: The views expressed in this publication are those of the writers where particulars are not warranted. This publication, which is in compliance with Section 2 of the Capital Markets Authority Act Cap 485A, is meant for general information only and is not a warranty, representation, advice or solicitation of any nature. Readers are advised in all circumstances to seek the advice of a registered investment advisor.


