In July 2022, we released the Nairobi Metropolitan Area Land Report 2022, which highlighted that the Nairobi Metropolitan Area (NMA) land sector recorded an improvement in performance with the average annual price appreciation coming in at 3.2% in FY’2021/22, 1.7% points higher than the 1.5% appreciation recorded in FY’2020/21. The performance represented a 10-year average price appreciation CAGR of 11.4%, with the average selling price for land coming in at Kshs 126.8 mn in FY’2021/22, from Kshs 47.5 mn in 2011.
The performance was mainly driven by the increased demand for unserviced land in satellite towns of the NMA which recorded the highest annualized capital appreciation of 9.7%, compared to a market average of 3.2%. This was attributed to; i) adequate infrastructural developments, ii) proximity to amenities such as malls, education institutions among others, and, iii) positive demographics fueling demand. Conversely, land prices in the high rise residential areas of the NMA registered the highest price correction declining by 2.0%. The decline in performance was mainly driven by the reduced demand for land in these areas, as a result of inadequate land for development.
This week, we updated our report by discussing the overall performance of the NMA land sector over time, and examining various factors that influence its performance based on selling prices and annual capital appreciation. Additionally, we identify investment opportunities for the sector, using 2023 market research data. As such, in this topic we shall focus on;
- Introduction to the Nairobi Metropolitan Area (NMA) Land Sector,
- NMA Land Sector Performance in 2023 Based on Various Locations,
- Summary and investment opportunities in the sector, and,
- Conclusion and Outlook for the Sector.
Section I: Introduction to the Nairobi Metropolitan Area (NMA) Land Sector
The land sector in the Nairobi Metropolitan Area (NMA) has continued to exhibit resilience, as evidenced by its consistent improvement in performance despite facing challenges such as the COVID-19 pandemic, and an oversupply in select Real Estate sectors such as commercial office and retail sectors. These oversupplies have exerted downward pressure on land demand, especially within the commercial zones of the NMA. Nevertheless, the sector managed to thrive in FY’2022/23, benefiting from various factors that played a crucial role in supporting its performance. Some of these factors include:
- Government’s Continued Focus on Infrastructural Developments: The government of Kenya has continued to initiate and implement various infrastructure projects across the country, aimed at improving the economy’s performance. This in turn has benefitted the Real Estate sector by improving connectivity, thereby bolstering demand and uptake, particularly in satellite towns, and opening up areas for investment, ultimately increasing property prices. Some key projects that were completed include; the dualling of the 27.8 Km Nairobi Eastern By-pass road, the 27.1 Km Expressway road project launched in July 2022 in the NMA, the completion of the Makupa Bridge in Mombasa, Eldoret Southern Bypass, Kenol-Marua road, Kibarani-Changamwe road, among others, whereas the projects in the pipeline include; Dongo Kundu Bypass Phase 2 in Kwale county, ii) dualling of the Mombasa-Malindi road, ii) Limuru-UN Avenue road expansion and dualling scheduled for completion in 2024, and, iii) Athi River-Machakos road turnoff, among many others,
- Positive Demographics: This is evidenced by Kenya’s relatively high population and urbanization growth rates of 1.9% p.a and 3.7% p.a, respectively, against the global average of 0.9% p.a and 1.6% p.a, respectively, as at 2022, which in turn continue to drive the demand for development land upwards,
- Increased Roll-Out of Affordable Housing Projects: The Affordable Housing initiative has continued to take shape in the country. This has seen the current administration launch and commission more projects under the initiative, in line with the government’s affordable housing agenda. Subsequently, there has been an upward demand for development land. Some notable ongoing projects include; Pangani Affordable Housing Project, Kings Boma Estate in Ruiru, and, River Estate project in Ngara, among many others, and,
- Limited Supply of Land Particularly in Urban Centers: Inadequate land within Nairobi Commercial Zones has driven developers to source for development land in the satellite towns of Nairobi, thus driving demand for land in these areas upward. Demand for land in the satellite towns has also been fueled by their affordability, compared to Nairobi suburbs. According to our H1’2023 Markets Review Report, the average asking land price per acre for un-serviced land in satellite towns came in at Kshs 15.4 mn, significantly lower than Kshs 397.3 mn per acre in Nairobi suburbs.
However, despite the aforementioned supporting elements, the sector's optimal performance in FY’2022/23 was hampered by;
- Increased Construction Costs: Construction costs have increased steadily, averaging Kshs 41,600 per SQM in 2023, a 20.1% increase from Kshs 34,650 per SQM recorded in 2022. This was attributed to a hike in prices of key construction materials such as cement, steel, paint, aluminum, and PVC on the back of rising inflation and supply chain disruptions. In turn, this led to some developers withholding or stalling their development projects due to the high associated costs of construction materials. Ultimately, this has had a trickle-down impact on the demand for land, weighing it down as a result of withheld development plans by developers,
- Oversupply in Select Real Estate Sectors: The oversupply in select Real Estate sectors, particularly the commercial office and retail sectors, estimated at 5.8 mn SQFT and 3.0 mn SQFT in the NMA respectively, weighed down the overall demand for development land. As such, some developers were prompted to halt or put on hold their development plans in light of the above, as they waited for absorption rates of the existing spaces to improve,
- Inadequate infrastructure: Despite the government’s efforts to improve infrastructure through the launch and conclusion of various infrastructure projects across the country, some areas are still lacking basic and adequate infrastructure such as water, roads, and sewer. As a result, this affects the optimum demand for land in such areas, and,
- Reduced Investor Confidence: In light of the 2022 August general elections, investors adopted a ‘wait-and-see’ approach to investment on the back of political uncertainty associated with the elections. As a result, most developers put their development plans on hold for the most part of the year owing to reduced investor confidence, which further diluted the overall demand for development land. However, following the peaceful conclusion of the polls, demand and uptake for development land has been stabilizing on the back of enhanced investor confidence.
Notably, going forward, some of the factors expected to shape performance of the sector include;
- Increase in Capital Gains Tax (CGT): As of 1st January 2023, the Finance Act 2022, became effective thereby increasing the CGT chargeable on net gains upon transfer of property to 15.0% from the 5.0% previously chargeable. We expect the tax will elicit mixed performance in the sector, possibly prompting investors to increase land prices. Conversely, we retain concerns regarding how the increase will dampen property transaction volumes exist, as many investors are likely to rethink their disposal transactions, ultimately leading to a decline in property transaction volumes and consequent liquidity gaps in the market, and,
- Continued Efforts in Digitization of Land Records: The ongoing digitization of land records under the National Land Information Management System (NLIMS), dubbed ‘Ardhi Sasa’ that was launched in April 2021, will ensure enhanced and streamlined land transaction processes. Digitization will assist curb fraud cases and ease land transaction processes by reducing protracted timelines.
Section II: NMA Land Sector Performance in 2023 Based on Various Locations
For the analysis, we conducted research on various major towns within the NMA and classified them as follows;
- High Rise Residential Areas: They comprise of areas such as Dagoretti, Embakasi, and Kasarani, and are majorly characterized by the numerous high-rise buildings such as the apartments found within,
- High End Residential Suburbs: These are areas which generally consist of low rise buildings such as the bungalows, maisonettes and villas and also high end apartments. They include; Kitisuru, Runda, Ridgeways, Kileleshwa, Karen, and Spring Valley,
- Commercial Zones: They comprise of areas such as Kilimani, Westlands, Riverside, and Upper Hill, and are popular because of the numerous commercial office buildings that they have, and,
- Satellite Towns: Land in the area was categorized into serviced (site and service schemes) and unserviced land. It comprises of areas such as Syokimau, Ruiru, Rongai, Athi River, and, Limuru.
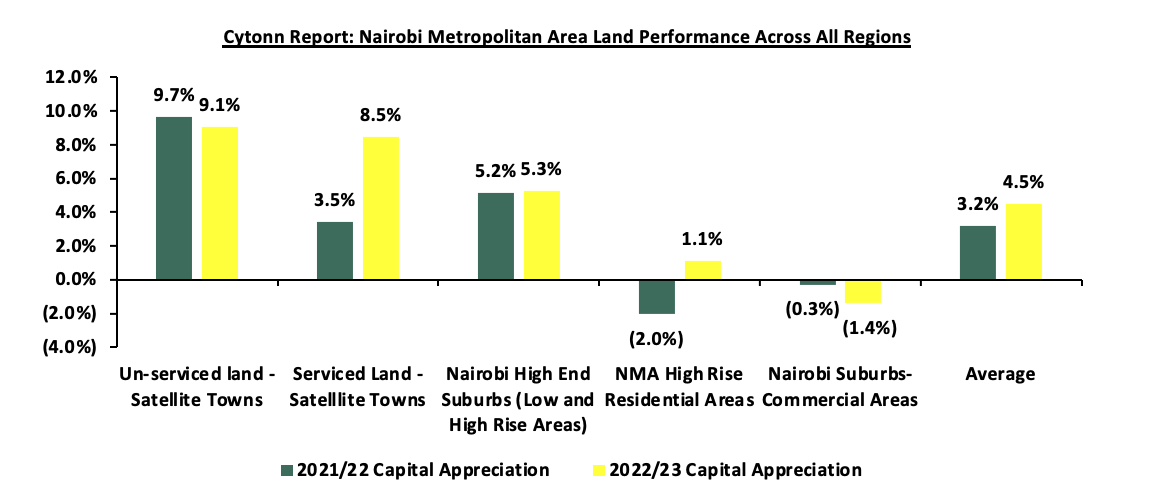
The NMA land sector recorded an improvement in performance with the average Year-on-Year (YoY) price appreciation coming in at 4.5% in FY’2022/23, 1.3% points higher than the 3.2% appreciation recorded in FY’2021/22. This is as the average asking prices came in at Kshs 128.5 mn in FY’2022/23, from Kshs 128.4 mn in FY’2021/22. The performance also represented an 11-year average price appreciation CAGR of 9.1%, with the average selling price for land coming in at Kshs 128.5 mn in FY’2022/23, from Kshs 47.9 mn in 2011. This signifies the continued rise in the demand for development land mainly driven by; i) increased need for land for development facilitated by positive population demographics, ii) ongoing efforts by the government to streamline land transactions creating a more efficient and accessible market, iii) notable increase in the initiation and completion of affordable housing projects owing to both government and private sector involvement, and, iv) rapid expansion of satellite towns, accompanied by substantial infrastructural developments resulting in elevated property prices. The graph below shows the capital appreciation of land in the NMA from FY’2021/22 to FY’2022/23;
The table below shows the performance summary of the NMA land sector based on the average asking prices, CAGR and capital appreciation;
All Values in Kshs mn per Acre Unless Stated Otherwise
|
Cytonn Report: Summary of the Land Performance Across All Regions in the Nairobi Metropolitan Area |
|||||||||||||
|
Location |
*Price in 2011 |
*Price in 2015 |
*Price in 2016 |
*Price in 2017 |
*Price 2018/19 |
*Price 2019/20 |
*Price 2020/21 |
*Price 2021/22 |
*Price 2022/23 |
11-Year CAGR |
2021/22 Capital Appreciation |
2022/23 Capital Appreciation |
∆ in Capital appreciation |
|
Unserviced land - Satellite Towns |
3.6 |
8.4 |
11.6 |
12.6 |
12.8 |
13.2 |
13.5 |
14.7 |
15.4 |
14.2% |
9.7% |
9.1% |
(0.6%) |
|
Serviced Land - Satellite Towns |
5.6 |
13.8 |
15.2 |
16.0 |
16.0 |
16.0 |
16.7 |
17.0 |
18.3 |
12.5% |
3.5% |
8.5% |
5.0% |
|
Nairobi High End Suburbs (Low and High Rise Areas) |
54.5 |
94.3 |
113.0 |
119.7 |
119.3 |
120.7 |
123.8 |
130.5 |
135.5 |
9.1% |
5.2% |
5.3% |
0.1% |
|
NMA High Rise Residential Areas |
31.0 |
64.3 |
71.7 |
77.7 |
75.7 |
77.0 |
76.7 |
76.3 |
76.1 |
8.5% |
(2.0%) |
1.1% |
3.2% |
|
Nairobi Suburbs- Commercial Areas |
145.0 |
359.3 |
421.8 |
433.0 |
421.0 |
419.0 |
404.6 |
403.4 |
397.3 |
9.8% |
(0.3%) |
(1.4%) |
(1.1%) |
|
Average |
47.9 |
108.0 |
126.6 |
131.8 |
129.0 |
129.2 |
127.1 |
128.4 |
128.5 |
9.1% |
3.2% |
4.5% |
1.3% |
Source: Cytonn Research
Performance per node:
- Satellite Towns - Unserviced Land
Unserviced land in the satellite towns of Nairobi recorded an average YoY capital appreciation of 9.1%, with average asking prices coming in at Kshs 15.4 mn in FY’2022/23, from the Kshs 14.7 mn recorded in FY’2021/22. Additionally, the performance grew by an 11-year average CAGR of 14.2%, to average asking prices of Kshs 15.4 mn in FY’2022/23 from the Kshs 3.6 mn recorded in 2011. The performance was supported by; i) improved infrastructural developments such as the Thika Superhighway, opening up new areas for investments, and, ii) increased demand for residence in towns such as Juja owing to presence of notable higher learning institutions.
In terms of performance per node, Athi River was the best performing with a Year-on-Year (YoY) capital appreciation of 19.2% attributed to; i) adequate transport links such as Mombasa Road, which enable access from the city that is necessary for investments, consequently driving up land prices, ii) proximity to amenities such as Greatwall Gardens Mall, Coloho Mall, and, Mavoko Hospital, among others, and, iii) positive demographics fueling demand. On the other hand, Limuru and Rongai recorded price corrections of 2.6% and 8.5% to Kshs 23.5 mn and Kshs 17.3 mn, respectively, from Kshs 24.1 mn and Kshs 18.9 mn, respectively, as a result of a slight decline in the demand for land in the areas. The table below shows the performance of unserviced land in satellite towns within the NMA;
All values is Kshs mn per Acre unless stated otherwise
|
Cytonn Report: NMA Satellite Towns - Unserviced Land Performance |
|||||||||||||
|
Location |
*Price in 2011 |
*Price in 2015 |
*Price in 2016 |
*Price in 2017 |
*Price 2018/19 |
*Price 2019/20 |
*Price 2020/21 |
*Price 2021/22 |
*Price 2022/23 |
11-Year CAGR |
2021/22 Capital Appreciation |
2022/23 Capital Appreciation |
∆ in Capital appreciation |
|
Juja |
3.0 |
7.0 |
9.0 |
10.0 |
10.0 |
10.0 |
10.6 |
12.2 |
14.5 |
15.4% |
14.8% |
18.9% |
4.1% |
|
Athi River |
2.0 |
3.0 |
4.0 |
4.0 |
4.0 |
4.0 |
4.5 |
4.4 |
5.2 |
9.1% |
(2.7%) |
19.2% |
22.0% |
|
Utawala |
6.0 |
9.0 |
10.0 |
11.0 |
12.0 |
12.0 |
12.4 |
14.1 |
16.7 |
9.8% |
13.8% |
18.4% |
4.5% |
|
Limuru |
5.0 |
13.0 |
17.0 |
20.0 |
20.0 |
21.0 |
21.2 |
24.1 |
23.5 |
15.1% |
13.8% |
(2.6%) |
(16.4%) |
|
Rongai |
2.0 |
10.0 |
18.0 |
18.0 |
18.0 |
19.0 |
19.0 |
18.9 |
17.3 |
21.6% |
(0.7%) |
(8.5%) |
(7.8%) |
|
Average |
3.6 |
8.4 |
11.6 |
12.6 |
12.8 |
13.2 |
13.5 |
14.7 |
15.4 |
14.2% |
7.8% |
9.1% |
1.3% |
Source: Cytonn Research
- Nairobi Suburbs – High End (Low and High Rise) Residential Areas
High end residential areas of Nairobi suburbs registered an average YoY capital appreciation of 5.3%, with the average asking prices coming at Kshs 135.5 mn in FY’2022/23, from Kshs 130.5 mn in FY’2021/22. Additionally, the performance represented an 11-year average CAGR of 9.1%, with average asking prices coming in at Kshs 135.5 mn in FY’2022/23 from the Kshs 54.5 mn recorded in 2011. These areas continue to remain attractive to investors due to; i) their serene environments attracting demand particularly from the high-end income earners, ii) privacy enhanced by the sparse population, iii) relatively affordable prices at Kshs 135.5 mn per acre compared to the commercial zones averaging at Kshs 397.3 mn per acre.
In terms of performance per node, Spring Valley was the best performing with an average YoY price appreciation of 9.2%, 3.9% points higher than the market average of 5.3% due to; i) its closeness to the city (5.0 km) thereby creating demand for residential developments, ii) availability of development land due to low population, iii) ample infrastructure servicing the area, such as the Nairobi Expressway, among others, iv) proximity to adequate amenities such as Spring Valley Mall, and St. Austin’s Academy, among others, and, v) strategic location as it’s connected to high end areas like Westlands, hence attracting investments. The table below shows the performance of land in high end (low and high rise) suburbs within the NMA
All values is Kshs mn per Acre unless stated otherwise
|
Cytonn Report: NMA High End Suburbs (Low and High Rise Areas) Land Performance |
|||||||||||||
|
Location |
*Price in 2011 |
*Price in 2015 |
*Price in 2016 |
*Price in 2017 |
*Price 2018/19 |
*Price 2019/20 |
*Price 2020/21 |
*Price 2021/22 |
*Price 2022/23 |
11-Year CAGR |
2021/22 Capital Appreciation |
2022/23 Capital Appreciation |
∆ in Capital appreciation |
|
Kitisuru |
32.0 |
59.0 |
70.0 |
70.0 |
71.0 |
73.0 |
77.9 |
90.3 |
95.0 |
9.9% |
13.7% |
5.2% |
(8.5%) |
|
Karen |
25.0 |
40.0 |
46.0 |
52.0 |
53.0 |
56.0 |
59.6 |
62.0 |
64.5 |
8.6% |
3.8% |
4.2% |
0.4% |
|
Kileleshwa |
149.0 |
227.0 |
286.0 |
306.0 |
311.0 |
303.0 |
300.9 |
305.8 |
301.9 |
6.8% |
1.6% |
(1.3%) |
(2.9%) |
|
Ridgeways |
24.0 |
51.0 |
62.0 |
68.0 |
65.0 |
66.0 |
68.8 |
81.4 |
87.0 |
11.7% |
15.5% |
6.8% |
(8.7%) |
|
Runda |
33.0 |
58.0 |
67.0 |
68.0 |
68.0 |
70.0 |
74.3 |
81.7 |
87.9 |
8.6% |
9.0% |
7.6% |
(1.5%) |
|
Spring Valley |
64.0 |
131.0 |
147.0 |
154.0 |
148.0 |
156.0 |
161.0 |
161.7 |
176.5 |
8.8% |
0.4% |
9.2% |
8.7% |
|
Average |
54.5 |
94.3 |
113.0 |
119.7 |
119.3 |
120.7 |
123.8 |
130.5 |
135.5 |
9.1% |
5.2% |
5.3% |
0.1% |
Source: Cytonn Research
- Satellite Towns - Serviced Land
Serviced land in the satellite towns of Nairobi recorded an average YoY capital appreciation of 8.5%, with the average asking prices coming in at Kshs 18.3 mn in FY’2022/23, from Kshs 17.0 mn in FY’2021/22. Additionally, the performance represented an 11-year average CAGR of 12.5%, with average asking prices coming in at Kshs 18.3 mn in FY’2022/23 from the Kshs 5.6 mn recorded in 2011. The performance was supported by; i) ample infrastructure such as the various bypasses and the Thika Superhighway, ii) rising demand for residential developments on the back of positive demographics, and, iii) convenient access to the city thereby allowing increased investments.
In terms of performance per node, Syokimau was the best performing with a relatively high average YoY price appreciation of 23.9%. This was mainly driven by; i) its strategic location along the recently completed Nairobi Expressway project promoting investments, ii) presence of a commuter rail network allowing accessibility to various areas in addition to Mombasa Road, iii) relatively affordable land prices at Kshs 17.2 mn per acre against the market average of Kshs 18.3 mn per acre, and, iv) presence of a growing middle income class driving demand for land investments. On the other hand, Rongai recorded a price correction of 6.1% attributed to reduced land transactions within the period under review. The table below shows the performance of serviced land in satellite towns within the NMA;
All values is Kshs mn per Acre unless stated otherwise
|
Cytonn Report: NMA Satellite Towns - Serviced Land Performance |
|||||||||||||
|
Location |
*Price in 2011 |
*Price in 2015 |
*Price in 2016 |
*Price in 2017 |
*Price 2018/19 |
*Price 2019/20 |
*Price 2020/21 |
*Price 2021/22 |
*Price 2022/23 |
11-Year CAGR |
2021/22 Capital Appreciation |
2022/23 Capital Appreciation |
∆ in Capital appreciation |
|
Rongai |
7.0 |
16.0 |
19.0 |
19.0 |
19.0 |
18.0 |
20.0 |
20.4 |
19.1 |
9.6% |
1.8% |
(6.1%) |
(7.9%) |
|
Athi River |
2.0 |
11.0 |
13.0 |
13.0 |
12.0 |
12.0 |
13.1 |
13.3 |
14.4 |
19.7% |
1.6% |
8.2% |
6.7% |
|
Ruiru |
8.0 |
18.0 |
19.0 |
21.0 |
23.0 |
24.0 |
25.3 |
25.9 |
28.1 |
12.1% |
2.2% |
8.6% |
6.4% |
|
Syokimau |
3.0 |
12.0 |
12.0 |
12.0 |
12.0 |
12.0 |
11.8 |
13.9 |
17.2 |
17.2% |
17.5% |
23.9% |
6.4% |
|
Ruai |
8.0 |
12.0 |
13.0 |
15.0 |
14.0 |
14.0 |
13.5 |
11.6 |
12.5 |
4.2% |
(13.9%) |
7.7% |
21.6% |
|
Average |
5.6 |
13.8 |
15.2 |
16.0 |
16.0 |
16.0 |
16.7 |
17.0 |
18.3 |
12.5% |
3.5% |
8.5% |
5.0% |
Source: Cytonn Research
- Nairobi Suburbs - Commercial Zones
Land in the Nairobi commercial zones realized a price correction of 1.4% in their average asking prices which came in at Kshs 397.3 mn in FY’2022/23, from the Kshs 403.4 mn that was recorded in FY’2021/22. This is mainly on the back of declined demand owing to high land prices. In addition, these areas are increasingly becoming congested due to relaxed zoning regulations in areas such as Kilimani, occasioning frequent traffic snarl-ups rendering them inconvenient compared to areas such as the high end suburbs of Nairobi. On the other hand, commercial zones realized an 11-year average CAGR of 9.8%, with average asking prices coming in at Kshs 397.3 mn in FY’2022/23 from the Kshs 145.0 mn recorded in 2011, owing to heightened property transactions in the period.
In terms of performance per node, all areas recorded price corrections, with Upper Hill recording the sharpest decline at 2.9% due to declined demand for development resulting from expensive land in the area, coming in at Kshs 458.1 mn per acre, compared to the average of Kshs 397.3 mn per acre. The table below shows the performance of land in commercial zones within the NMA;
All values is Kshs mn per Acre unless stated otherwise
|
Cytonn Report: NMA Suburbs - Commercial Zones Land Performance |
|||||||||||||
|
Location |
*Price in 2011 |
*Price in 2015 |
*Price in 2016 |
*Price in 2017 |
*Price 2018/19 |
*Price 2019/20 |
*Price 2020/21 |
*Price 2021/22 |
*Price 2022/23 |
11-Year CAGR |
2021/22 Capital Appreciation |
2022/23 Capital Appreciation |
∆ in Capital appreciation |
|
Westlands |
150.0 |
350.0 |
453.0 |
474.0 |
430.0 |
421.0 |
413.6 |
418.3 |
413.2 |
9.6% |
1.1% |
(1.2%) |
(0.1%) |
|
Upper Hill |
200.0 |
450.0 |
512.0 |
510.0 |
488.0 |
506.0 |
487.3 |
471.9 |
458.1 |
7.8% |
(3.2%) |
(2.9%) |
0.3% |
|
Kilimani |
114.0 |
294.0 |
360.0 |
387.0 |
403.0 |
398.0 |
381.7 |
380.4 |
375.9 |
11.5% |
(0.3%) |
(1.2%) |
(0.9%) |
|
Riverside |
116.0 |
343.0 |
362.0 |
361.0 |
363.0 |
351.0 |
335.7 |
343.1 |
342.1 |
10.3% |
2.2% |
(0.3%) |
(1.9%) |
|
Average |
145.0 |
359.3 |
421.8 |
433.0 |
421.0 |
419.0 |
404.6 |
403.4 |
397.3 |
9.8% |
(0.3%) |
(1.4%) |
(1.7%) |
Source: Cytonn Research
- Nairobi Suburbs – High Rise Residential Areas
High rise residential areas of Nairobi realized an average YoY capital appreciation of 1.1%, with the average asking prices coming in at Kshs 76.3 mn in FY’2022/23 from Kshs 76.1 mn recorded in FY’2021/22. Additionally, the performance represented an 11-year average CAGR of 8.5%, with average asking prices coming in at Kshs 76.1 mn in FY’2022/23 from the Kshs 31.0 mn recorded in 2011. The performance was supported by; i) affordability of land prices enticing buyers and investors compared to high end suburbs, ii) rising demand for residential developments on the back of positive demographics, and, iii) unrestricted zoning regulations allowing investments in the areas.
In terms of performance per node, Embakasi was the best performing, with an average YoY price appreciation of 6.9%, 5.8% points higher than the 1.1% market average. This was mainly driven by; i) investors increasingly putting up developments in the densely populated area to accommodate the middle-income population, ii) affordability of land in the area, coming in at Kshs 71.5 mn per acre, compared to the market average of Kshs 76.1 mn per acre, and, iii) availability of infrastructure with the area being served by the Airport Road and part of the Outer Ring Road. On the other hand, Dagoretti recorded a price correction of 10.1% attributed to decreased investment activities in the area within the period. The table below shows the performance of land in high rise residential areas within the NMA;
All values is Kshs mn per Acre unless stated otherwise
|
Cytonn Report: NMA Middle End Suburbs – High Rise Residential Areas Land Performance |
|||||||||||||
|
Location |
*Price in 2011 |
*Price in 2015 |
*Price in 2016 |
*Price in 2017 |
*Price 2018/19 |
*Price 2019/20 |
*Price 2020/21 |
*Price 2021/22 |
*Price 2022/23 |
11-Year CAGR |
2021/22 Capital Appreciation |
2022/23 Capital Appreciation |
∆ in Capital appreciation |
|
Embakasi |
33.0 |
61.0 |
60.0 |
70.0 |
61.0 |
63.0 |
67.2 |
66.9 |
71.5 |
7.3% |
(0.5%) |
6.9% |
7.4% |
|
Kasarani |
32.0 |
51.0 |
60.0 |
64.0 |
66.0 |
65.0 |
67.7 |
66.9 |
71.3 |
7.6% |
(1.2%) |
6.6% |
7.8% |
|
Dagoretti |
28.0 |
81.0 |
95.0 |
99.0 |
100.0 |
103.0 |
95.2 |
95.2 |
85.6 |
10.7% |
0.0% |
(10.1%) |
(10.1%) |
|
Average |
31.0 |
64.3 |
71.7 |
77.7 |
75.7 |
77.0 |
76.7 |
76.1 |
76.3 |
8.5% |
(0.6%) |
1.1% |
0.5% |
Source: Cytonn Research
Section III: Summary and Investment Opportunity in the Sector
The table below summarizes the performance in capital appreciation of the various areas:
|
Summary and Conclusions - y/y Capital Appreciation Nairobi Metropolitan Area |
|
|
Unserviced Land Capital Appreciation |
|
|
FY’2022/23 |
Areas |
|
>5.0% |
Juja, Athi River, Utawala, Kitisuru, Ridgeways, Runda, Spring Valley, Embakasi, Kasarani |
|
1.0%- 4.9% |
Karen |
|
<1.0% |
Limuru, Rongai, Kileleshwa, Westlands, Upper Hill, Kilimani, Riverside |
|
Site and Service Capital Appreciation |
|
|
FY’2022/23 |
Areas |
|
>5.0% |
Athi River, Ruiru, Syokimau, Ruai |
|
<1.0% |
Rongai |
Source: Cytonn Research
Investment Opportunity
- Satellite Towns (Unserviced land) - The investment opportunity in this segment lies in Juja, Athi River, and Utawala submarkets which registered the highest YoY capital returns at 18.9%, 19.2%, and 18.4%, respectively, against a market average of 9.1% owing to relative affordability of land and presence of adequate infrastructure allowing access to the city thereby drawing investments,
- High End Residential Suburbs - The investment opportunity in this segment lies in Spring Valley and Runda which recorded the highest YoY capital appreciations of 9.2% and 7.6%, respectively, against the market average of 5.3%. The impressive performance was driven by the relatively high demand resulting from their exclusivity, prime locations attracting high net worth investments, availability of ample development land, adequate infrastructure and various amenities,
- Satellite Towns (Serviced Land) - The investment opportunity in the segment lies in Syokimau and Ruiru which recorded the highest YoY capital appreciations of 23.9% and 8.6%, respectively, against the market average of 8.5%. The performance was supported by; rapid demand driven by the existing growing middle income class earners, availability of infrastructure networks such as the commuter train station in Syokimau and Thika Superhighway along Ruiru, and relatively affordable land prices,
- Commercial Zones - Riverside presents the most favorable investment opportunity in the segment, having registered the least price correction of 0.3% compared to the market average of 1.4%, driven by its close proximity to Nairobi’s Central Business District (CBD) and its relatively affordable land compared to the commercial zone market average, and,
- High Rise Residential Areas - The investment opportunity in the segment lies in Embakasi and Kasarani which recorded the highest YoY capital appreciations of 6.9% and 6.6%, respectively, against the market average of 1.1%, driven by increased demand for development land to cater for the rapidly dense population in the areas.
Section IV: Conclusion and Outlook for the Sector
|
Indicator |
2022 Projections |
2023 Projections |
2022 Outlook |
2023 Outlook |
|
Infrastructure Development |
|
|
Positive |
Positive |
|
Legal Reforms |
|
|
Positive |
Positive |
|
Credit Supply |
|
|
Negative |
Negative |
|
Real Estate Activities |
|
|
Neutral |
Neutral |
|
Land Sector Performance |
|
|
Positive |
Positive |
We have three positive outlooks; for infrastructure development, legal reforms and land sector performance, one neutral outlook for Real Estate activities and one negative outlook for credit supply thereby bringing our overall outlook for the sector to POSITIVE. We expect the performance to be further boosted by factors driving demand for development land such as; i) Increased infrastructure developments which has improved and opened up areas for investment, ii) Roll out of numerous affordable housing projects by both the public and private sectors, iii) Affordability of land in the satellite towns, iv) Limited supply of land especially in urban areas which has contributed to exorbitant prices, and, v) Positive demographics driving demand for land upwards, facilitated by high population and urbanization growth rates of 1.9% and 3.7%, 1.0% points and 2.1% points higher than the global averages of 0.9% and 1.6% respectively.
Disclaimer: The views expressed in this publication are those of the writers where particulars are not warranted. This publication, which is in compliance with Section 2 of the Capital Markets Authority Act Cap 485A, is meant for general information only and is not a warranty, representation, advice or solicitation of any nature. Readers are advised in all circumstances to seek the advice of a registered investment advisor.


