In 2024, we published the Nairobi Metropolitan Area Commercial Office Report 2024 themed ‘Persisting Tenant’s Market’. The report provided an in-depth analysis of the sector's performance in 2023, along with insights into future prospects and investment opportunities. According to the report, the sector experienced notable improvements, with average rental yield improved by 0.1% points to 7.7% in FY’2023 from 7.6% recorded in FY’2022, due to improved occupancy and rental rates. Average asking rents per SQFT in the NMA increased by 7.0% to Kshs 103 per SQFT from Kshs 96, owing to increased availability of high-quality Grade A office spaces, exemplified by Regus, Ikigai, and Spaces, which command premium rents. The overall occupancy rates increased by 0.1% points to 79.5% from 79.4% as a result of a slow but rising demand for physical space. Also, the report noted that, Westlands emerged as the top-performing node, boasting an average rental yield of 8.5%, surpassing the market average of 7.7% by 0.8% points. Gigiri followed closely as the second-best performing node, achieving an average rental yield of 8.2%. Karen secured the third position with an average rental yield of 8.0%. The Nairobi Metropolitan Area (NMA) commercial office sector experienced a consistent oversupply of office space, amounting to 5.8 million square feet (SQFT), a figure comparable to that of 2022. The Nairobi Metropolitan Area (NMA) commercial office sector experienced a consistent oversupply of office space, amounting to 5.8 million square feet (SQFT), a figure comparable to that of 2022. This surplus was primarily due to the increase of the new development adding more space into the market and a slow absorption of the existing spaces, thus limiting the influx of additional office space into the market. Additionally, the surge in gross non-performing loans (NPLs) within the Real Estate sector constrained developers' capacity to fund new ventures, prompting them to defer or postpone developments until market conditions stabilized and financing accessibility improved. However, despite the persistent oversupply, there was a notable decline in the average office vacancy rate, decreasing from 20.6% in 2022 to 19.7% in 2023. Consequently, the heightened demand led to faster absorption rates of both new and existing developments throughout 2023, even with the introduction of 0.3 million SQFT of office space into the market—a 50.0% reduction from the 0.6 million SQFT supplied in 2022.
This week, we update our previous research with the Commercial Office Report 2024 themed ‘Supply-Heavy Market’, in order to determine the market’s performance and analyse the ongoing trends, by looking at the following:
- Overview of the Commercial Office Sector,
- Commercial Office Supply in the Nairobi Metropolitan Area,
- Commercial Office Performance, by Location and by Grades, and,
- Office Market Outlook and the Investment Opportunity in the Sector.
Section I: Overview of the Commercial Office Sector
In 2024, the commercial office market across the Nairobi Metropolitan Area experienced a surge in activity compared to 2023. This growth was primarily driven by a rising demand for office spaces and a significant uptick in development projects led by property developers. Additionally, an increasing appetite for convenience has bolstered the appeal of co-working office arrangements, as evidenced by a growing number of developments offering fully serviced offices. A range of factors has collectively spurred this robust market performance, including:
- Business Resurgence: The ongoing post-COVID-19 recovery led to increased business activities, boosting demand for commercial office spaces. This surge contributed to higher occupancy rates and improved rental yields, encouraging the development of new office complexes and the refurbishment of existing ones to meet the growing demand.
- Rise of Flexible Workspaces: Serviced offices and co-working spaces continued to gain popularity in Kenya due to their convenience and flexibility. These spaces offered cost-effective and adaptable solutions for entrepreneurs and small businesses, appealing to both tenants and investors.
- Demand for Premium and Sustainable Spaces: The entry of multinational corporations (MNCs) into Kenya heightened the demand for premium Grade A office spaces with a focus on sustainability. MNCs preferred developments that provided high-quality work environments incorporating Environmental, Social, and Governance (ESG) features, including green technology. Developers recognized that green buildings offered a competitive market advantage and aligned with sustainable business practices, making them more attractive than traditional office spaces.
- Nairobi's Strategic Positioning: Nairobi maintained its status as a key investment destination for MNCs in the region. The establishment of regional offices by organizations such as the Commonwealth Enterprise and Investment Council (CWEIC) underscored Nairobi’s role as East Africa’s business hub, attracting international organizations. This positioning enhanced the commercial office sector's appeal for investment compared to other regional cities.
- Favorable Demographic Trends: Kenya’s urbanization rate stood at 3.8%, surpassing the global average of 1.6%, according to the World Bank as of 2023. Rapid urban growth fueled demand for office spaces as more individuals migrated to urban centers in search of employment opportunities and a better quality of life. This trend was expected to persist, supported by ongoing government initiatives to promote urbanization and infrastructure development.
- Return-to-Office Policies: Mandated in-person work reduced vacancy rates to 14.7% and increased occupancy rates, reinforcing demand for physical office space amid evolving hybrid work models.
- Economic Recovery & Business Confidence: Kenya’s 2024 GDP growth hit 4.0% in Q3’2024 (down from 6.0% in Q3’2023) with Q2 at 4.6%. Inflation eased to 3.6% from 6.8%, and a CBR cut to 12.75% boosted business confidence and spurred office leasing.
Conversely, the sector continues to face setbacks such as;
- Oversupply of Office Space: In 2024, the Nairobi Metropolitan Area continued to face an excess supply of office space, surpassing current demand levels and resulting in an oversupply of 5.7 mn SQFT. This surplus has contributed to prolonged vacancy rates, prompting developers to adopt a cautious "wait-and-see" approach regarding new construction projects until the surplus office space is absorbed. Nairobi has long grappled with an oversupply of office space, exacerbated by escalating capital costs, further contributing to developers' cautious stance towards new investments,
- Remote/ Hybrid Working Model: The implementation of remote or hybrid work setups by certain companies has adversely affected the overall occupancy rates of office spaces and landlords' returns. However, transitioning from full remote work to a hybrid model by select companies is anticipated to enhance the office occupancy rate within the sector, and,
- Financial Constraints: Developers encounter financial constraints as they face challenges in accessing credit loans, with banks tightening their lending terms and requiring more collateral due to escalating default rates. Gross Non-Performing Loans (NPLs) in the Real Estate sector surged by 1.1% to Kshs 99.0 bn in Q3’2024, from Kshs 97.9 bn in Q3’2023, equivalent to 19.5% of the total loans advanced compared to 19.3% recorded in the same period in 2023. This situation is exacerbated by i) Slow uptake of properties due to the economic and political demonstrations ongoing during the quarter which made it hard for developers and practitioners in real estate to fail meeting their financial obligations ii) higher existing taxes and new tax implementations, and, iii) Long incubation periods for real estate projects, and, iv) increased cost of borrowing.
Section II: Commercial Office Supply in the Nairobi Metropolitan Area
In 2024, there was introduction of five new office projects that contributed up to 0.6 mn SQFT of office supply to the commercial office market. These developments comprised the purple tower in Mombasa Road, The Atrium in Kilimani, Matrix One in Westlands, Mandrake in Westlands and Highway Heights in Kilimani. Meanwhile, there are plans for an additional 0.2 mn SQFT of space to be introduced into the market in 2025. This upcoming supply includes projects such as The Angelo in Lavington and 761 Lenana Rd. The table below shows some of the notable office completions during the review period as well as incoming spaces:
|
Cytonn Report: Nairobi Metropolitan Area Commercial Office Space Supply |
|||||||
|
|
Major Commercial Office Space Supply in 2024 |
Major incoming Commercial Office Completion in 2025 |
|||||
|
# |
Development |
Location |
Size (SQFT) |
# |
Development |
Location |
Size (SQFT) |
|
1 |
Purple Tower |
Mombasa Road |
197,800 |
1 |
The Angelo |
Lavington |
42,000 |
|
2 |
The Atrium |
Kilimani |
100,000 |
2 |
761 Lenana Rd |
Kilimani |
127,500 |
|
3 |
Mandrake |
Westlands |
120,000 |
|
|
|
|
|
4 |
Highway Heights |
Kilimani |
100,000 |
|
|
|
|
|
5 |
Matrix One |
Westlands |
108,000 |
|
|
|
|
|
Total |
625,800 |
Total |
169,500 |
||||
Source: Cytonn Research, Knight Frank
In 2024, the Nairobi Metropolitan Area (NMA) commercial office sector experienced a consistent oversupply of office space, amounting to 5.7 mn square feet (SQFT), a figure lower to that of 2023 at 5.8 Mn SQFT. This decrease in the supply can be primarily be contributable to decrease in vacancy rates by 0.4% points to 19.3% in 2024 from 19.7% in 2023. Increase in occupancy rates was supported by factors such as market recovery from the global pandemic which has seen companies and organizations abolish remote working. Consequently, there was heightened demand which led to faster absorption rates of both new and existing developments throughout 2024, even with the introduction of 0.6 Mn SQFT of office space into the market—a 113.5% increase from the 0.3 Mn SQFT supplied in 2023. The oversupply is caused by the factors such as construction of new office spaces such as the purple tower on Mombasa Road, The Atrium in Kilimani , Matrix One in Westlands Mandrake in Westlands and Highway Heights in Kilimani, which outpaced the occupancy and uptake of these spaces
Looking ahead, the release of 0.2 mn of office space in 2025 is expected to further increase the oversupply, however the improving economy will see rise to demand for new spaces as companies and organizations planning expansion balancing the Supply-demand dynamics. The table below summarizes the commercial office space supply over time;
|
Cytonn Report: Nairobi Metropolitan Area Office Space Analysis |
|||||||||||||
|
Year |
2013 |
2014 |
2015 |
2016 |
2017 |
2018 |
2019 |
2020 |
2021 |
2022 |
2023 |
2024 |
2025F |
|
Stock (Mn SQFT) |
9.7 |
15.4 |
22.9 |
28.9 |
31.8 |
35.5 |
36.3 |
36.4 |
36.8 |
37.4 |
37.1 |
37.8 |
37.2 |
|
Completions (Mn SQFT) |
2.1 |
5.9 |
7.8 |
6.5 |
3.5 |
4.3 |
1.5 |
0.8 |
0.5 |
0.6 |
0.3 |
0.6 |
0.2 |
|
Vacancy Rate (%) |
10.0% |
10.0% |
11.0% |
12.0% |
16.8% |
16.7% |
19.5% |
22.3% |
22.1% |
20.6% |
19.7% |
19.3% |
20.2% |
|
Vacant Stock (Mn SQFT) |
1 |
1.5 |
2.5 |
3.5 |
5.3 |
5.9 |
7.1 |
8.1 |
8.1 |
7.7 |
7.3 |
7.3 |
7.5 |
|
Occupied Stock (Mn SQFT) |
8.8 |
13.9 |
20.3 |
25.4 |
26.5 |
29.6 |
29.2 |
28.3 |
28.7 |
29.7 |
29.8 |
30.5 |
29.7 |
|
Net Absorption |
1.7 |
5.1 |
6.5 |
5.1 |
1 |
3.1 |
-0.4 |
-1 |
0.4 |
1 |
0.3 |
0.7 |
(0.8) |
|
Demand |
1.9 |
5.3 |
6.8 |
5.6 |
1.6 |
3.7 |
0.4 |
-0.2 |
1.2 |
1.8 |
1.9 |
1.4 |
(0.1) |
|
Available Supply, AS(T) |
2.6 |
6.5 |
8.8 |
8.4 |
6.3 |
9 |
6.7 |
7.1 |
7.9 |
7.6 |
7.7 |
7.2 |
6.9 |
|
Gap, GAP(T) |
(0.8) |
(1.2) |
(2.1) |
(2.9) |
(4.7) |
(5.2) |
(6.3) |
(7.3) |
(6.7) |
(5.7) |
(5.8) |
(5.7) |
(7.0) |
Source: Cytonn Research/ Building Plan Approvals Data from the Nairobi City County
Section III: Commercial Office Performance, by Location and by Grades
The Commercial Office sector realized a 0.1%-points increase in average rental yields in 2024 to 7.8%, from 7.7% recorded in 2023 attributable to increased occupancy and rental rates. Average asking rents per SQFT in the Nairobi Metropolitan Area (NMA) increased by 1.7% to Kshs 105 per SQFT from Kshs 103 per SQFT in 2023. Additionally, occupancy rates increased by 1.2%-points to 80.7% from 79.5% achieved in 2023. The sector's improved performance can be attributed to various factors, including; i) the gradual resurgence of demand for physical spaces as more firms resumed full operations, ii) economic recovery which boosted business confidence and operations, iii) a more stable and favourable business environment post-COVID-19 era also played a role in the sector's improved performance. The table below summarizes the performance of the commercial office theme over time:
|
|
(All Values in Kshs Unless Stated Otherwise) |
|||||||||||
|
|
Cytonn Report: Commercial Office Performance Over Time |
|||||||||||
|
Year |
2015 |
2016 |
2017 |
2018 |
2019 |
2020 |
2021 |
2022 |
2023 |
2024 |
y/y ∆ 2023 |
|
|
Occupancy (%) |
89.0% |
88.0% |
82.6% |
83.8% |
80.3% |
77.7% |
77.6% |
79.4% |
79.5% |
80.7% |
1.2% |
|
|
Asking Rents (Kshs/SQFT) |
97 |
97 |
101 |
101 |
96 |
93 |
94 |
96 |
103 |
105 |
1.7% |
|
|
Average Prices (Kshs/SQFT) |
12,776 |
12,031 |
12,649 |
12,407 |
12,638 |
12,280 |
12,106 |
12,223 |
12,673 |
12,677 |
(0.5%) |
|
|
Node Average Rental Yields (%) |
8.1% |
8.5% |
7.9% |
8.3% |
7.5% |
7.0% |
7.3% |
7.6% |
7.7% |
7.8% |
0.1% |
|
Source: Cytonn Research
- Commercial Office Performance by Nodes
For the purposes of submarket analysis, we categorized the primary office locations within the Nairobi Metropolitan Area into 9 major nodes; i) Nairobi CBD, ii) Westlands, covering environs including Riverside, iii) Parklands, iv) Mombasa Road, v) Thika Road, vi) Upperhill, vii) Karen, viii) Gigiri, and, ix) Kilimani, which includes offices in Kilimani, Kileleshwa and Lavington.
The table below shows the Nairobi Metropolitan Area (NMA) sub-market performance;
|
All values in Kshs unless stated otherwise |
|||||||||||
|
Cytonn Report: Nairobi Metropolitan Area Commercial Office Market Performance FY’2024 |
|||||||||||
|
Area |
Price/SQFT FY 2023 |
Rent/SQFT FY 2023 |
Occupancy FY 2023 |
Rental Yields FY 2023 |
Price Kshs/ SQFT FY 2024 |
Rent Kshs/ SQFT FY 2024 |
Occupancy FY 2024 |
Rental Yield FY 2024 |
∆ in Rent |
∆ in occupancy |
∆ in Rental Yields (% points) |
|
Gigiri |
15,000 |
128 |
79.8% |
8.2% |
14,850 |
131 |
82.6% |
8.8% |
2.3% |
2.8% |
0.6% |
|
Westlands |
12,504 |
120 |
75.1% |
8.5% |
12,448 |
119 |
80.4% |
8.5% |
(0.7%) |
5.3% |
0.1% |
|
Karen |
14,246 |
115 |
80.1% |
7.8% |
12,873 |
101 |
82.9% |
8.3% |
(12.5%) |
2.8% |
0.5% |
|
Kilimani |
13,051 |
102 |
83.6% |
7.9% |
14,077 |
115 |
80.9% |
8.2% |
12.9% |
(2.7%) |
0.3% |
|
Upperhill |
13,086 |
100 |
75.2% |
6.8% |
12,206 |
92 |
86.6% |
7.9% |
(8.2%) |
11.4% |
1.0% |
|
Parklands |
11,875 |
92 |
85.8% |
8.0% |
11,922 |
94 |
83.0% |
7.8% |
2.2% |
(2.8%) |
(0.2%) |
|
Nairobi CBD |
12,000 |
90 |
85.0% |
7.6% |
12,857 |
104 |
76.1% |
7.6% |
15.7% |
(8.9%) |
0.0% |
|
Thika Road |
12,571 |
79 |
79.4% |
6.0% |
12,643 |
90 |
79.3% |
6.7% |
14.1% |
0% |
0.7% |
|
Mombasa Road |
11,325 |
72 |
74.5% |
5.7% |
11,325 |
80 |
72.2% |
6.5% |
10.7% |
(2.3%) |
0.8% |
|
Average |
12,673 |
103 |
79.5% |
7.7% |
12,614 |
105 |
80.7% |
7.8% |
4.1% |
0.6% |
0.1% |
Source: Cytonn Research
Key take-outs from the table above include;
- In FY’2024, Gigiri emerged as the top-performing node, boasting an average rental yield of 8.8%, surpassing the market average of 7.8% by 1.0% point. Westlands followed closely as the second-best performing node, achieving an average rental yield of 8.5%. Karen secured the third position with an average rental yield of 8.3%. The strong demand for premium office spaces and the attractiveness of investment opportunities in these areas can be attributed to several key factors: i) These locations feature a high concentration of top-tier office buildings that command premium rental rates and yields, ii) Landlords in these areas often prefer to collect rent in dollars, enhancing the investment appeal, iii) Well-developed infrastructure and abundant amenities add significant value to investments in these locations, iv) The presence of multinational corporations, international organizations, and embassies increases the demand for high-quality office spaces, and,
- On the contrary, Mombasa Road emerged as the least performing node in FY’2024, recording an average rental yield of 6.5%, which was 1.2%-points lower than the market average of 7.7%. Several factors contributed to this underperformance: i) The high prevalence of lower-quality office buildings in this area leads to lower average rental rates, typically around Kshs 72 per SQFT as compared to an average of Kshs 103 per SQF , ii) Mombasa Road is predominantly recognized as an industrial zone, reducing its attractiveness to office-based businesses seeking commercial spaces, iii) Intense competition from other sub-markets further compounds the challenges Mombasa Road faces in attracting tenants and achieving higher rental yields.
- Commercial Office Performance by Class/Grade:
Commercial office buildings are categorized into three main classes based on the quality and sizes of office spaces as follows:
- Grade A: These are high quality office buildings characterized by their adequate amenities, facilities, and finishes. They therefore fetch higher rental rates and yields compared to other office types. Also, these office building sizes range from 100,001 - 300,000 SQFT,
- Grade B: These office buildings have their sizes ranging between 50,000 to 100,000 SQFT. They have good amenities and services, however not as good as Grade A offices, hence charge moderate rental rates, and,
- Grade C: These buildings are usually old, hence their lack of adequate services and facilities. Usually, they charge rents below the average market rate.
Based on our analysis of office grade distribution, Grade A offices dominated the office space market in the Nairobi Metropolitan Area during 2024, comprising 49.2% of the total market share. This reflects an increase of 19.2%-points from the 30.0% observed in 2023. This increase can be attributed to the increased completion of Grade A offices, exemplified by developments purple towers, matrix one in Westlands, Mandrake and the Atrium in Kilimani. Notably, the supply of Grade B office spaces contracted by 9.1% to reach 43.2% from the previous 52.4 % recorded in 2023, this decline is attributable increase in the number of the Grade A officers in the market competitively substituting Grade B offices
In our nodal analysis, Gigiri, Mombasa Road and Karen exhibited the highest proportion of Grade A offices, accounting for 79.0%, 73.5% and 62.5% respectively of their total office inventory. Conversely, Kilimani maintained the highest percentage of Grade B offices at 68.2%, a drop from 76.9% recorded in 2023. Regarding Grade C offices, Nairobi CBD retained the highest share of office spaces, comprising 20.0% of the current market share, however, this was a decrease from 29.4% recorded in 2023
In terms of concentration, Westlands boasted the highest mix of office types, with Grade A, Grade B, and Grade C office spaces making up 55.4%, 34.6%, and 10.0% respectively of its total office inventory. The distribution of various office classes/grades is as summarized in the table below: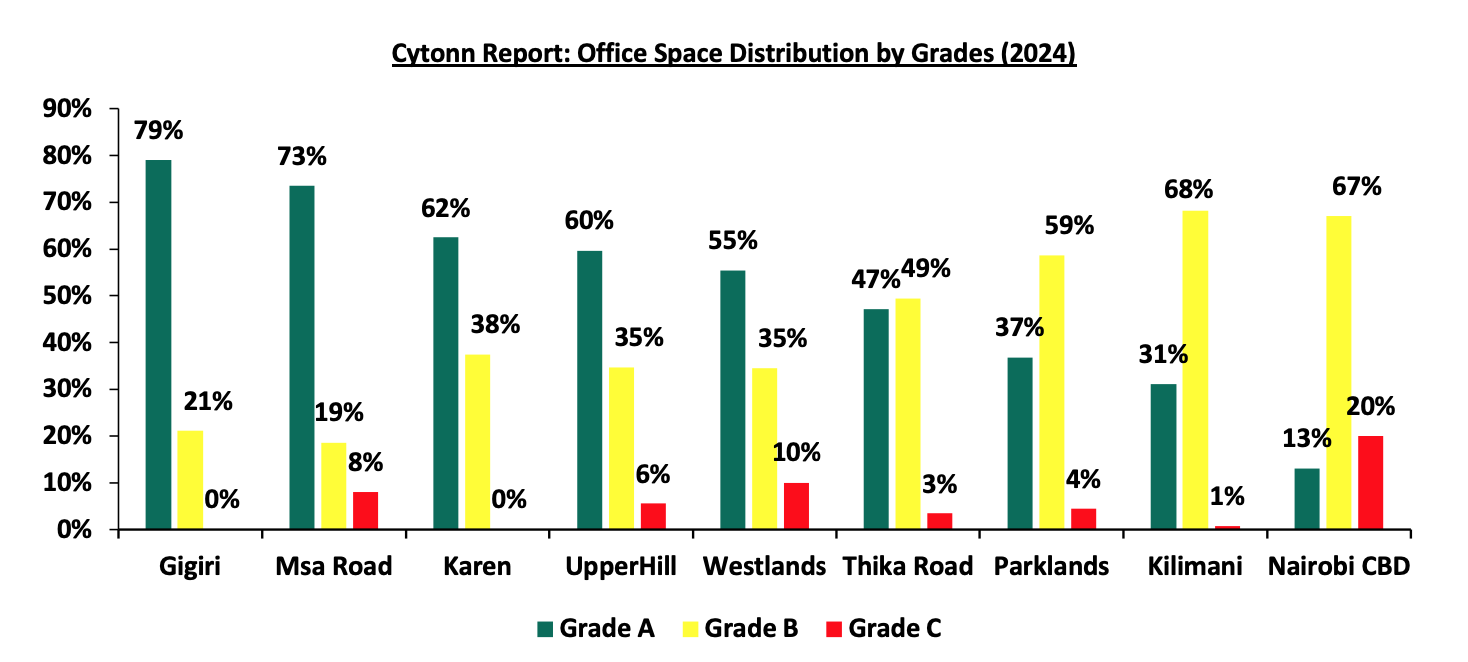
Source: Cytonn Research
In terms of performance;
- Grade A and Grade B office spaces achieved the highest rental yields, both reaching 7.6% and 7.9% respectfully. The strong performance of Grade A offices can be attributed to their growing popularity among tenants, as evidenced by a 2.5% increase in occupancy rates. This rise is mainly due to their competitively affordable rental rates and quality compared to Grade B offices, which experienced a 0.1% increase in occupancy rates. Additionally, Grade A and B offices offer superior technical services compared to Grade C spaces. However, Grade C office spaces demonstrated a significant improvement in occupancy rates, increasing by 2.2% in 2024,
- Grade B offices saw the most substantial Year-on-Year (y/y) rise in rental rates, increasing by 2.9% in 2024 to Kshs 102 per SQFT from Kshs 98.7 per SQFT in 2023. This surge is credited to the affordability of Grade B spaces, which command higher occupancies, as well as heightened demand from the local top tier corporations and organizations, and,
- Grade A offices saw a decrease in the average rental yields, which can be attributed to the decrease in rents by 0.3% to Kshs 119 from Kshs 119.4% in 2023. Grade A offices dominated the office space market in the Nairobi Metropolitan Area during 2024, comprising 49.2% of the total market share. Grade A offices increased to 49.2% in 2024 a19.2%-points increase from the 30.0% observed in 2023. This increase in Grade A offices spaces forced the landlords to lower the rents to remain competitive in the market as well as to attract more tenants as evidenced by 2.5% increase in occupancy rates to 78.9% in 2024 from 76.4% in 2023.
The performance according to grades/class is as summarized in the table below:
|
(All Values in Kshs Unless Stated Otherwise) |
|||||||||||
|
Office Grade |
Price 2023 Kshs/SQFT |
Rent 2023 Kshs/SQFT |
Occupancy 2023 |
Rental Yield 2023 |
Price 2024 Kshs/SQFT |
Rent 2024 Kshs/SQFT |
Occupancy 2024 |
Rental Yield 2024 |
∆ Rent Y/Y |
∆ Occupancy Y/Y |
∆ Rental Yield Y/Y |
|
Grade B |
12,572 |
98.7 |
82.2% |
7.8% |
12,519 |
101.6 |
82.3% |
7.9% |
2.9% |
0.1% |
0.2% |
|
Grade A |
13,695 |
119.4 |
76.4% |
7.8% |
13,546 |
119.0 |
78.9% |
7.6% |
(0.3%) |
2.5% |
(0.3%) |
|
Grade C |
11,124 |
86.4 |
77.0% |
7.2% |
11,208 |
88.5 |
79.2% |
7.2% |
2.4% |
2.2% |
0.1% |
|
Average |
12,673 |
103.0 |
79.5% |
7.7% |
12,614 |
105 |
80.8% |
7.7% |
1.7% |
1.6% |
0.0% |
Source: Cytonn Research
- Commercial Office Performance by Class and Node:
In 2024, Grade A offices in Thika Road and Gigiri achieved the highest average rental yields, reaching 9.5% and 9.0% respectfully. This was primarily due to; i) their strategic locations attract high-end clientele willing to pay premium rates, often in dollars, ii) the availability of adequate amenities and well-developed infrastructure enhancing accessibility in these areas, iii) the serene environment provides an ideal office setting, away from the hustle and bustle of the city center. Grade C offices performed well in some nodes such as Westlands and Nairobi CBD where they out performed Grade A rental yield. For instance; despite Grade A offices in Westlands charging higher rental rates at Kshs 119 per SQFT compared to Grade C offices' average rates of Kshs 88.5 per SQFT, Grade C offices had higher yields at 8.2% compared to the 7.6% recorded by Grade A offices since they have higher occupancy signifying their high demand. In contrast, Grade B offices in Kilimani, gigiri, and Westlands boasted the highest rental yields all to reach a 8.4% in yields. Similarly, Grade C offices in Westlands Nairobi CBD and Upperhill delivered the best returns with average rental yields reaching 8.1%, 7.9% and 7.9% respectively. The class performance by node is as summarized in the table below with the best performing areas of each grade highlighted in yellow;
|
Cytonn Report: Commercial Office Performance in 2024 by Nodes and Grades |
||||||
|
|
Grade A |
|
Grade B |
|
Grade C |
|
|
Location |
Average of Occupancy (%) |
Average of Rental Yield |
Average of Occupancy (%) |
Average of Rental Yield |
Average of Occupancy (%) |
Average of Rental Yield |
|
Gigiri |
83.7% |
9.0% |
81.0% |
8.4% |
|
|
|
Karen |
82.0% |
7.9% |
79.7% |
8.0% |
|
|
|
Kilimani |
78.0% |
7.0% |
84.4% |
8.4% |
78.5% |
4.9% |
|
Msa Road |
75.7% |
6.4% |
72.5% |
6.4% |
70.0% |
5.9% |
|
Nairobi CBD |
60.0% |
6.2% |
88.2% |
7.9% |
88.4% |
7.9% |
|
Parklands |
84.7% |
7.7% |
82.9% |
8.0% |
80.0% |
7.4% |
|
Thika Road |
75.0% |
9.5% |
81.0% |
6.3% |
75.0% |
5.8% |
|
UpperHill |
78.1% |
7.2% |
74.7% |
7.1% |
75.1% |
7.9% |
|
Westlands |
77.1% |
7.6% |
82.5% |
8.4% |
82.0% |
8.1% |
Source: Cytonn Research
- Serviced Offices
In 2024, serviced offices experienced a notable 1.6% year-on-year (y/y) growth in rental revenues, with average rental rates rising to Kshs 215.2 per SQFT, up from Kshs 211.6 per SQFT in 2023. In contrast, unserviced offices saw a more modest revenue increase of 4.1%, with average rental rates climbing to Kshs 105 per SQFT in 2024, compared to Kshs 103 per SQFT in 2023. Notably, serviced offices in Nairobi CBD and Westlands recorded the most substantial rent hikes of 5.0% and 3.5% respectively. The improved performance in these areas can be attributed to several factors: i) the presence of quality infrastructure, enhancing accessibility, ii) increased demand for serviced offices driven by a high-end clientele and international firms with evolving preferences, iii) diverse themes and sophisticated designs demanding top-tier standards, iv) high-quality facilities attracting premium rents, often in dollars, and v) tranquil office locations appealing to clients seeking to escape the hustle and bustle of the city. The table below gives a comparison of the performance of the NMA serviced office sector;
|
(All values in Kshs Unless Stated Otherwise) |
||||||
|
Cytonn Report: Nairobi Metropolitan Area Serviced Office Performance |
||||||
|
Location |
Revenue Per SQFT 2023 |
Revenue Per SQFT 2024 |
Serviced Offices Revenue growth (%) |
Unserviced Offices Revenue growth (%) |
||
|
Serviced Offices |
Un-serviced Offices |
Serviced Offices |
Un-serviced Offices |
|||
|
Westlands |
258 |
120 |
267 |
119 |
3.5% |
(0.7%) |
|
Karen |
217 |
115 |
221 |
101 |
2.0% |
(12.5%) |
|
Parklands |
193 |
92 |
194 |
94 |
0.3% |
2.2% |
|
Gigiri |
278 |
128 |
283 |
131 |
1.6% |
2.3% |
|
Upperhill |
242.5 |
100 |
243 |
92 |
0.2% |
(8.2%) |
|
Kilimani |
229 |
102 |
233 |
115 |
1.7% |
12.9% |
|
Nairobi CBD |
187 |
90 |
196 |
104 |
5.0% |
15.7% |
|
Msa Rd |
180 |
72 |
180 |
80 |
0.0% |
10.7% |
|
Thika Rd |
120 |
79 |
120 |
90 |
0.0% |
14.1% |
|
Average |
211.6 |
103 |
215.2 |
105 |
1.6% |
4.1% |
Source: Cytonn Research
In 2024, there was a noticeable surge in the development of specialized office spaces tailored to specific niches in Kenya, particularly in the realm of co-working spaces. Illustrating this trend, IWG, a global leader in hybrid working solutions known for its prestigious lineup of brands like Spaces and Regus, unveiled a workspace center on Pramukh Towers Westlands. Spanning an impressive 20000 square feet, this center offers a diverse array of co-working zones, private offices, cutting-edge meeting facilities, and inspiring creative spaces. We expect a rise in the establishment of additional co-working spaces in the future. According to Knight Frank’s H2 2024 Kenya Market Update, many organizations opted to return to working from office adopting physical offices over working remote. The table below highlights major co-working office spaces released into the market in 2024;
|
Cytonn Report: Notable Co-working Space Office Developments delivered in 2024 |
||||
|
# |
Space provider |
Office Name |
Location |
Size (SQFT) |
|
1 |
IWG |
Pramukh Towers |
Westlands |
20,000 |
|
2 |
Horizons |
Two Rivers |
Ruaka |
|
Source: Cytonn Research, Knight Frank
Section IV: Office Market Outlook and the Investment Opportunity in the Sector
Our overall outlook for the Nairobi Metropolitan Area commercial office sector is POSITIVE. We expect the sector to remain stable with a slight improvement attributable to i) the increasing presence of multinational companies in Kenya is likely to drive up occupancy levels, ii) co-working spaces are gaining in popularity in the region iii) the gradual return to “working from office” after the Covid-19 pandemic, iv) more start-ups are expected to drive demand for commercial spaces, and v) a considerable take-up of prevailing commercial office spaces after developers adopted a 'wait-and-see' approach to avoid vacancies in newly built spaces, However, the sector continues to face challenges due to a significant oversupply of office space, currently standing at 5.7 mn SQFT. Despite these challenges, there are attractive investment opportunities in areas such as Westlands, Gigiri, Karen and Kilimani, which offer returns that exceed the market average.
|
Cytonn Report: Nairobi Metropolitan Area (NMA) Commercial Office Outlook |
||||
|
Measure |
2023 Sentiment |
2024 Sentiment and 2025 Outlook |
2024 Review |
2025 Outlook |
|
Supply |
The oversupply of commercial office space remained unchanged at approximately 5.8 mn SQFT in 2023 attributable to escalating construction costs, which dissuaded developers from initiating new projects or expanding existing ones, thus limiting the influx of additional office space into the market. Despite the persistent oversupply, there was a notable decline in the average office vacancy rate, decreasing from 20.6% in 2022 to 19.7% in 2023. This decline was attributed to the gradual recovery in demand for office space following the impact of the COVID-19 pandemic in 2020. Consequently, the heightened demand led to faster absorption rates of both new and existing developments throughout 2023, even with the introduction of 0.3 Mn SQFT of office space into the market—a 50.0% reduction from the 0.6 Mn SQFT supplied in 2022 |
In 2024, the Nairobi Metropolitan Area (NMA) commercial office sector experienced a consistent oversupply of office space, amounting to 5.7 mn square feet (SQFT), a figure comparable to that of 2023 5.8 Mn. This decrease in the supply can be primarily be contributable to decrease in vacancy rates by 0.4% points to 19.3% in 2024 from 19.7% in 2023. Increase in occupancy rates was supported by factors such as market recovery from the global pandemic which has seen companies and organizations abolish remote working. Consequently, there was heightened demand which led to faster absorption rates of both new and existing developments throughout 2024, even with the introduction of 0.6 Mn SQFT of office space into the market—a 113.5% increase from the 0.3 Mn SQFT supplied in 2023. The oversupply is caused by the factors such as construction of new office spaces such as Purple Towers in Mombasa road and the Atrium in Nyali road and easing economic pressures evidenced by reducing inflation rate and CBK rates We expect the office space oversupply to increase by 29.6% to 7.0 mn SQFT from 5.7 mn SQFT in 2024 attributable to an expected increase in vacancy rates by 0.9% to 20.2% from 19.3% in 2024, and reduced demand from 1.7 mn SQFT in 2024 to 0.1 mn SQFT in 2025. Also, construction of new office spaces expected within 2025 year amounting to more than 0.2 Mn SQF |
Neutral |
Neutral |
|
Demand |
There was an increased demand for office spaces in the NMA, evidenced by the 0.1% increase in the average occupancy rates which came in at 79.5% in 2023 from 79.4% recorded in 2022. This was mainly attributed to i) the gradual resurgence of demand for physical spaces as more firms resumed full operations, increased availability of high-quality Grade A office spaces, exemplified by Regus, Ikigai, and Spaces, which command premium rents, iii) expansion strategies adopted by companies like Call Centre International (CCI) Group bolstering occupancy rates, and iv) a more stable and favorable business environment post-COVID-19 era also played a role in the sector's improved performance. Furthermore, office space uptake rose by 10.0% to reach 1.1 mn SQFTin 2023, up from the 1.0 mn SQFT registered in 2022. This increase is credited to a higher occupancy rate of both conventional unserviced and serviced office spaces, driven by the resumption of full business operations across various sectors |
The Commercial Office sector realized a 0.1%-points increase in average rental yields in 2024 to 7.8%, from 7.7% recorded in 2023 attributable to increased occupancy and rental rates. Average asking rents per SQFT in the Nairobi Metropolitan Area (NMA) increased by 1.7% to Kshs 105 per SQFT from Kshs 103 per SQFT in 2023. Additionally, occupancy rates increased by 1.2%-points to 80.7% from 79.5% achieved in 2023. The sector's improved performance can be attributed to various factors, including; i) the gradual resurgence of demand for physical spaces as more firms resumed full operations, ii) economic recovery which boosted business confidence and operations, iii) a more stable and favourable business environment post-COVID-19 era also played a role in the sector's improved performance. Furthermore, office space uptake rose by 93.6% to reach 0.7 Mn SQFT in 2023, up from the 0.3 Mn SQFT registered in 2023. This increase is credited to a higher occupancy rate of both conventional unserviced and serviced office spaces, driven by the resumption of full business operations across various sectors We expect the occupancy rates to stabilize mainly attributed to the recovery that has been happening since 2020, businesses are still exercising caution due to the uncertainties in the market, abolition of remote work policies by companies, however the occupancies might be affected by an oversupply of 7.0 mn SQFT of office spaces in 2025. These factors are likely to stabilize absorption rates |
Positive |
Neutral |
|
Office Market Performance |
The average rental yield improved by 0.1% points to 7.7% in FY’2023 from 7.6% recorded in FY’2022, due to improved occupancy and rental rates. Average asking rents per SQFT in the NMA increased by 7.0% to Kshs 103 per SQFT from Kshs 96, owing to increased availability of high-quality Grade A office spaces, exemplified by Regus, Ikigai, and Spaces, which command premium rents. The overall occupancy rates increased by 0.1% points to 79.5% from 79.4% as a result of a slow but rising demand for physical space on the back of various firms resuming full operations, coupled with the expansion strategy by various firms such Call Centre International (CCI) Group. |
The Commercial Office sector realized a 0.1%-points increase in average rental yields in 2024 to 7.8%, from 7.7% recorded in 2023 attributable to increased occupancy and rental rates. Average asking rents per SQFT in the Nairobi Metropolitan Area (NMA) increased by 1.7% to Kshs 105 per SQFT from Kshs 103 per SQFT in 2023. Additionally, occupancy rates increased by 1.2%-points to 80.7% from 79.5% achieved in 2023. The sector's improved performance can be attributed to various factors, including; i) the gradual resurgence of demand for physical spaces as more firms resumed full operations, ii) economic recovery which boosted business confidence and operations, iii) a more stable and favourable business environment post-COVID-19 era also played a role in the sector's improved performance. Serviced offices experienced a notable 1.6% year-on-year (y/y) growth in rental revenues, with average rental rates rising to Kshs 215.2 per SQFT, up from Kshs 211.6 per SQFT in 2023. In contrast, unserviced offices saw a more modest revenue increase of 4.1%, with average rental rates climbing to Kshs 105 per SQFT in 2024, compared to Kshs 103 per SQFT in 2023. We anticipate a modest increase in rental yields for the sector in 2025, driven by several factors; i) the growing popularity of serviced office spaces is expected to contribute positively to this trend, ii) while the sector's expansion may be gradual, it is steadily progressing, supported by the ongoing recovery of the economy towards pre-COVID-19 levels, iii) the pipeline of developments in the sector is expected to help address the oversupply challenge, thereby improving absorption rates for available and incoming spaces. As a result, we foresee an improvement in occupancy rates and asking rents, which will ultimately enhance average rental yields. However, the projected oversupply of office spaces, estimated at 6.8 Mn square feet in the Nairobi Metropolitan Area, is expected to exert downward pressure on the sector's overall performance by dampening demand for physical space. |
Positive |
Positive |
Our overall outlook for the Nairobi Metropolitan Area commercial office sector is POSITIVE. We expect the sector to remain stable with a slight improvement attributable to i) the increasing presence of multinational companies in Kenya is likely to drive up occupancy levels, ii) co-working spaces are gaining in popularity in the region iii) the gradual return to “working from office” after the Covid-19 pandemic, iv) more start-ups are expected to drive demand for commercial spaces, and v) a considerable take-up of prevailing commercial office spaces after developers adopted a 'wait-and-see' approach to avoid vacancies in newly built spaces, However, the sector continues to face challenges due to a significant oversupply of office space, currently standing at 5.7 mn SQFT. Despite these challenges, there are attractive investment opportunities in areas such as Westlands, Gigiri, and Kilimani, which offer returns that exceed the market average.
Disclaimer: The views expressed in this publication are those of the writers where particulars are not warranted. This publication, which follows Section 2 of the Capital Markets Authority Act Cap 485A, is meant for general information only and is not a warranty, representation, advice or solicitation of any nature. Readers are advised in all circumstances to seek the advice of a registered investment advisor


