In 2020, we published the Nairobi Metropolitan Area Serviced Apartments Report 2020, which highlighted that serviced apartment’s average rental yield declined by 3.6% points to 4.0%, from the 7.6% recorded in 2019. This was attributed to declines in monthly charges per SQM to Kshs 2,533, from Kshs 2,806 recorded in 2019, coupled with declines in occupancy levels to 48.0%, from 79.4% recorded in 2019. The decline in performance was attributable to reduced demand for hospitality facilities and services, due to the COVID-19 pandemic which saw the government ban all international flights and local flights into Mombasa and Nairobi, among other restrictive measures aimed at curbing the spread of the Coronavirus. This year, we update our report by focusing on;
- Overview of the Kenyan Hospitality Sector
- Introduction to Serviced Apartments,
- Supply and Distribution of Serviced Apartments within the NMA,
- Performance of Serviced Apartments in the NMA,
- Serviced Apartments Performance by Node
- Comparative Analysis- 2020/2021 Market Performance
- Performance per Typology
- Recommendation and Outlook.
Section I: Overview of the Kenyan Hospitality Sector
The hospitality sector has been on a recovery path in 2021, as evidenced by the increasing number of hotels in operation, hotel bookings and bed occupancies during the year. In 2020, the hospitality sector was among the worst hit sectors by the COVID-19 pandemic following the international travel ban, lockdowns and social distancing measures put in place to curb the spread of the virus. These measures led to the decline in hotel bookings and occupancies, and, the closure of many hospitality-affiliated businesses. However, according to the Central Bank of Kenya Monetary Policy Committee Hotels Survey-September 2021, the number of hotels in operation have improved over the last few months coming in at 96.0% in September 2021 from 81.0% in April 2021.
The graph below shows the overall percentage of the number of operating hotels in Kenya from June 2020 to September 2021;
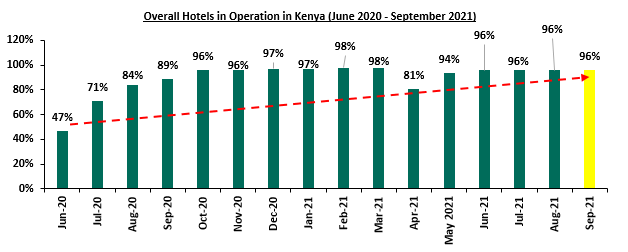
Source: Central Bank of Kenya
Consequently, the average bed occupancy in September 2021 was at 38.0%, 8.0% points increase from 30.0% recorded in July 2021, attributable to the lifting of the travel restrictions, coupled with the gradual recovery of the economy which has seen hotels and other institutions operating in the hospitality industry resume operations. The graph below highlights the hotel bed occupancy rates in Kenya between June 2020 and September 2021;
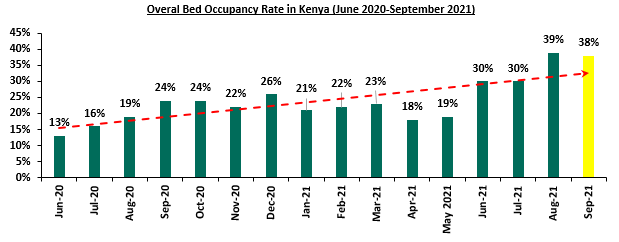
Source: Central Bank of Kenya
In terms of quarterly analysis, international arrivals through Jomo Kenyatta International Airport (JKIA) and Moi International Airport (MIA) registered an improvement to 113,307 visitors in Q2’2021 from 1,177 visitors in Q2’2020. This is as a result of the ease of the pandemic restrictions and lockdowns, coupled with the aggressive efforts by the Ministry of Tourism to market the Kenyan hospitality sector to international markets. However, the number of visitor arrivals through the two airports recorded a decline of 7.5% to 113,307 persons in Q2’2021 from 122,498 persons in Q1’2021. The decline in the number of international arrivals was largely attributed to the level four travel advisory alert initiated by the United States of America (USA) and United Kingdom (UK) listing Kenya on its “Red-List” as a high risk country in April 2021, due to the rise in number of COVID-19 cases. This consequently caused a drop in the number of international arrivals to Kenya as the two countries are regarded as key source markets of tourists in Kenya. The ‘UK Red-List’ was however dropped in October 2021.
For the month of July, according to the latest Kenya National Bureau of Statistics Leading Economic Indicators August 2021, the number of international visitors arriving through Jomo Kenyatta (JKIA) and Moi International Airports (MIA) increased by 42.2% to 69,025 persons in July 2021 from 48,532 persons in June 2021. The total number of international arrivals passing through JKIA and MIA from January to July was 304,371 persons, which was a 4.6% increase from the 291,024 persons over the same period in 2020.
The graph below shows the number of international arrivals in Kenya between Q1’2020 and Q2’2021;
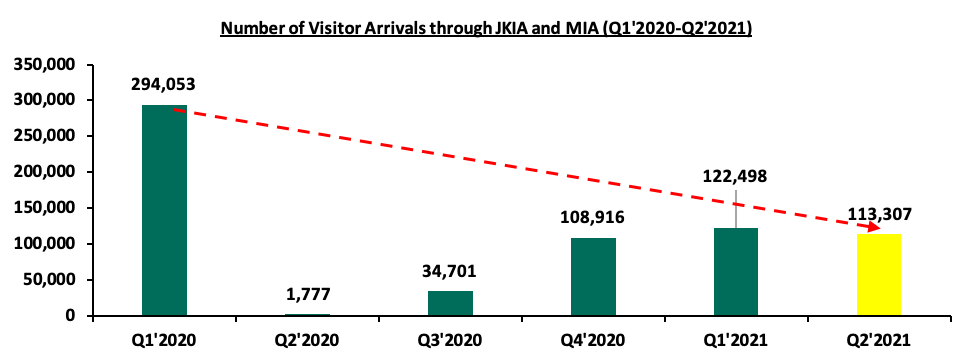
Source: Kenya National Bureau of Statistics
Some of the factors that continue to cushion the hospitality sector include;
- Relaxation of COVID-19 Measures: The relaxation of travel advisories from countries such as the UK, who have since removed Kenya from the Red-List to Green, and the easing of social distancing measures, are factors expected to lead to the reopening of Kenya’s key tourism markets,
- Hospitality Sector Support Events: The Ministry of Tourism has organized events such as the World Rally Championship (WRC) expected to be hosted in Kenya annually until 2026, and the World Under 21 Athletics Championships which were held at Moi International Sports centre in August 2021. These events continue to boost visitor arrivals, hotel bookings and the general performance of the hospitality industry,
- Mass COVID-19 Vaccination: Vaccination against COVID-19 has boosted travel confidence into the country for both holiday and business reasons. This is evidenced by the aforementioned increase in the number of operating hotels which have improved over the last few months, coming in at 96.0% in September 2021, from 81.0% recorded in April 2021,
- Positive Hospitality Sector Accolades: In October 2021, World Travel Awards (WTA), a global institution that acknowledges, rewards and celebrates excellence across all sectors of the tourism industry yearly, announced the 28th World Travel Awards On the African level, Nairobi was voted as Africa’s leading business travel destination supported by availability of conferencing facilities such as KICC, top rated accommodation facilities, infrastructure, and a stable political and Macro-Economic environment. This, among other key notable awards indicates continued confidence in Kenya’s hospitality industry despite the impact of the COVID-19 pandemic, and,
- Aggressive Local and International Marketing of Kenya’s Hospitality Industry: On the local level, the hospitality sector players have employed measures such as price discounts in order to attract more local clientele as future travel uncertainties continue to cloud the international clientele. This has had a huge effect on numbers since local guests continued to account for majority of clientele population at 5% for accommodation and 78.9% for restaurant services between August and September 2021, which was an increase from 62.0% and 68.7%, respectively, recorded in the pre-COVID period. This is according to the Monetary Policy Committee Hotels Survey-September 2021. The Ministry of Tourism has also embarked on an ambitious plan to market Kenya as a desirable tourist destination in the international markets through the Magical Kenya Platform, with activities currently underway in the Ukraine and other countries.
The graph below highlights the percentages of local and foreign clients served in hotels in Kenya between June 2021 and September 2021;
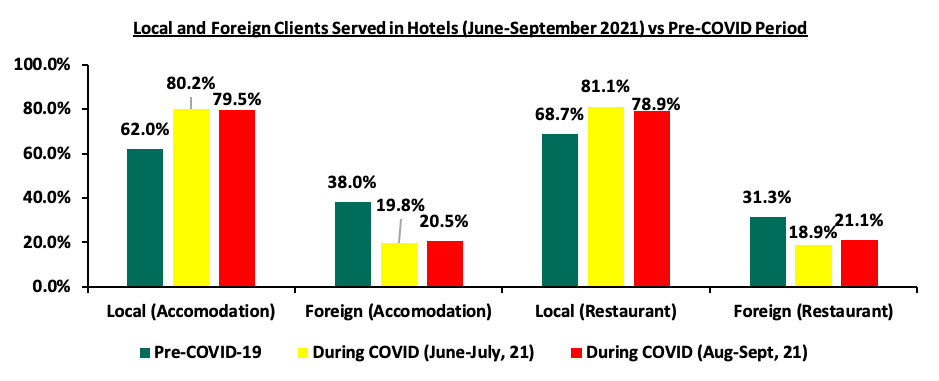
Source: Central Bank of Kenya
Nevertheless, the sector continues to face challenges among them;
- Overreliance on Meetings, Incentives, Conferences and Events (MICE): Since the onset of the pandemic, most people have had to shift from physical to online meetings. Even when the COVID-19 measures were partly lifted, these facilities could not hold to capacity. This has led to the rise of e-conferencing and online meeting platforms such as Google Meet and Zoom, thereby reducing the need for physical space,
- COVID-19 Pandemic: Despite the improved performance of the hospitality sector, we expect the sector to return to pre-COVID normalcy levels by 2024. With the emergence of new COVID-19 strains and most economies currently in the third wave of the pandemic, we expect delays in the hospitality sector recovery, as countries impose more restrictions with new developments in regard to COVID-19,
- Reduced Private Sector Lending: Given the elevated credit risk associated with lending to the private sector, we have seen most lenders continue to lend cautiously given the high loan default rates. According to Central Bank of Kenya (CBK), the tourism, restaurant and hotel industry recorded gross non-performing loans worth Kshs 16.3 bn in Q1’2021, which was a 7.2% increase from Kshs 15.2 bn as recorded in Q4'2020. The market has thus slowed down as a result of the conservative underwriting approach, and,
- Budget Cuts: The budgetary allocation for the tourism sector decreased by 11.3% from Kshs 20.4 bn in FY’2020/21 to Kshs 18.1 bn in FY’2021/22, as the government looks to shift allocations towards Covid-19 recovery measures such as medical supplies. This is expected to slow down the hospitality sector development and operational activities due to limited funds.
Section II: Introduction to Serviced Apartments
To update our 2020 topical, we embarked on an analysis of serviced apartments in the Nairobi Metropolitan Region. A serviced apartment is a type of furnished apartment available for short term or long-term stays, which provides amenities for daily use and housekeeping services all included in the rental charges. The serviced apartments provide facilities much like the traditional hotels, however, they have added space, convenience and privacy just like a home so that the occupants get the feel of a “home away from home”.
The advantages of a serviced apartment include;
- Extra room services such as laundry services and general housekeeping are offered as opposed to traditional hotels,
- Some serviced apartments are designed to resemble the culture of some specific areas. They are usually blended to reflect different tastes and preferences as opposed to an ordinary hotel room,
- Serviced apartments offer a “home far from home” feel compared to hotels since they have more utilities,
- Ease of integration, as the concept provides guests with a chance to integrate with the larger community as they are located within or in close proximity to other residential developments, and,
- For investors, serviced apartments can easily be converted into furnished or normal apartments in the case where the former is not performing well.
Section III: Supply and Distribution of Serviced Apartments in the Nairobi Metropolitan Area
The number of serviced apartments within the Nairobi Metropolitan Area (NMA) increased by a 7-Year CAGR of 8.5% to 6,044 apartments in 2021, from 3,414 apartments in 2015, with one of the key facilities coming into the market this year being 250-room Skynest Serviced Apartments, located in Westlands and the 160-room Habitat Residences located in Kilimani. Spring Valley also debuted the 40-room Elsie Ridge which has been completed this year. In terms of distribution, Westlands and Kilimani have the largest market share of serviced apartments within the Nairobi Metropolitan Area, at 37.9% and 24.3%, respectively. This is attributed to the attractiveness of the areas due to; i) their proximity to the Nairobi CBD and other major business nodes such as Upperhill, ii) relatively good infrastructure promoting connectivity to other key areas, iii) concentration of international organizations such as the United Nations and various Embassies, and, iv) availability of social amenities such as shopping malls within the areas.
The table below indicates the serviced apartments market share in the Nairobi Metropolitan Area;
|
Nairobi Metropolitan Area (NMA) Serviced Apartments Market Share 2021 |
|
|
Area |
Percentage Market Share |
|
Westlands & Parklands |
37.9% |
|
Kilimani |
24.3% |
|
Kileleshwa & Lavington |
15.5% |
|
Upperhill |
9.7% |
|
Limuru Road |
6.8% |
|
CBD |
2.9% |
|
Thika Road |
1.9% |
|
Spring Valley |
1.0% |
|
Total |
100.0% |
Source: Online Research
For the projects in the pipeline, the Nairobi Metropolitan Area currently has 5 serviced apartments or hotels with serviced apartments’ concepts in the pipeline. Some of these key development include;
|
Name |
Location |
Number of Rooms |
Estimated Completion Date |
|
9 Oak |
Kilimani |
120 |
2022 |
|
JW Marriot |
Westlands |
350 |
2022 |
|
Avic |
Westlands |
51 |
2022 |
|
Grand Hyatt |
Westlands |
225 |
2022 |
|
Britam |
Kilimani |
163 |
2022 |
|
Total |
|
909 |
|
Source: Online Research
Section IV: Performance of Serviced Apartments in the Nairobi Metropolitan Area
For the purpose of this report, we tracked the performance of serviced apartments in 7 nodes within the Nairobi Metropolitan Area and compared this to the performance to 2020. The key metrics we looked at include:
- Charged Rates: This is the amount guests pay for an apartment in a specific market, on a daily basis, weekly and/or monthly. This forms the basis for evaluating the rental income investors are likely to gain from investing in serviced apartment,
- Occupancy Rates: This measures the number of apartments that are inhabited of the total available, in order to inform on the expected rental yield of the developments, and,
- Rental Yields: This refers to the measure of return on the real estate investment, from the rental income collected annually. The rental yield informs potential investors on the return they are likely to get from a property and hence the time it will take an investor to recoup the money invested. To calculate this, we have estimated annual income from monthly revenues having deducted operational costs assumed to be at 40.0% of revenues.
To estimate the investment value, we have calculated development cost per SQM by factoring in land costs based on the location, construction costs, equipping costs, professional fees and other development-related costs. The formula to calculate rental yield is as follows;
Rental Yield= Monthly Rent per SQM x Occupancy Rate x (1-40.0% operational cost) x 12 months Development Cost per SQM *
Key to note is that depending on the actual incurred land cost, plot ratios, the level of finishing and equipping, investors will generally incur varying costs. On performance, we will start by covering the performance by the node during the year, compare this with 2020 performance, then cover the performance by typology;
- Serviced Apartments Performance by Node
From our research and analysis, serviced apartments within the NMA recorded an average rental yield of 5.5% in 2021, 1.5% points higher than the 4.0% recorded in 2020. This is attributed to the increase in monthly charges per SQM by 0.7% to Kshs 2,549, from Kshs 2,533 recorded in 2020. Average occupancy also increased by 13.5% points to 61.5% in 2021, from the 48.0% recorded in 2020. The performance improvement is attributable to increased demand for hospitality facilities and services as a result of the reopening of the economy, the return of international flights, and focused marketing of serviced apartments to local clients. Most serviced apartments have also been issuing discounts to attract and maintain clients. Westlands and Kileleshwa were the best performing nodes in 2021, with a rental yield of 8.3% and 6.4%, respectively compared to the market average of 5.5%. Thika Road was the least performing node with a rental yield of 3.5%, 2.0% points lower than the market average of 5.5% and we attribute this to the this relatively low charge rates for apartments within the area given its unpopularity, the significant distance from main commercial zones, in addition to security concerns as the area is not mapped within the UN Blue Zone.
The table below shows a summary of the performance of the various nodes within the NMA;
|
2021 NMA Serviced Apartments Performance per Node |
||||||||||||
|
Average Unit Sizes (SQM) |
Monthly Charge/Unit (Kshs) |
|
||||||||||
|
Node |
Studio |
1 Bed |
2 Bed |
3 Bed |
Studio |
1 Bed |
2 Bed |
3 bed |
Occupancy |
Monthly Charge/ SQM (Kshs) |
Devt Cost/SQM (Kshs) |
Rental Yield |
|
Westlands |
37 |
57 |
87 |
114 |
175,000 |
208,410 |
262,639 |
300,000 |
68.8% |
3,568 |
209,902 |
8.3% |
|
Kileleshwa & Lavington |
38 |
91 |
128 |
166 |
120,000 |
218,500 |
296,667 |
440,000 |
57.1% |
2,571 |
206,132 |
6.4% |
|
Kilimani |
47 |
75 |
114 |
193 |
155,340 |
252,750 |
319,872 |
380,143 |
60.0% |
2,815 |
202,662 |
5.8% |
|
Limuru Road |
44 |
52 |
79 |
116 |
119,000 |
187,636 |
217,500 |
240,000 |
60.5% |
2,853 |
231,715 |
4.9% |
|
Nairobi CBD |
51 |
82 |
85 |
119 |
67,500 |
132,500 |
215,714 |
409,000 |
66.6% |
2,176 |
224,571 |
4.9% |
|
Upperhill |
- |
95 |
119 |
195 |
- |
216,667 |
290,000 |
393,333 |
61.1% |
2,109 |
209,902 |
4.5% |
|
Thika Road |
- |
70 |
101 |
145 |
- |
100,000 |
193,333 |
280,000 |
56.4% |
1,748 |
200,757 |
3.5% |
|
Average |
43 |
75 |
102 |
150 |
127,368 |
188,066 |
256,532 |
348,925 |
61.5% |
2,549 |
212,234 |
5.5% |
|
High |
51 |
95 |
128 |
195 |
175,000 |
252,750 |
319,872 |
440,000 |
68.8% |
3,568 |
231,715 |
8.3% |
|
Low |
37 |
52 |
79 |
114 |
67,500 |
100,000 |
193,333 |
240,000 |
56.4% |
1,748 |
200,757 |
3.5% |
|
· Overall, average occupancy for serviced apartments in the NMA increased by 13.5% points to 61.5% in 2021, from the 48.0% recorded in 2020 |
||||||||||||
Source: Cytonn Research 2021
- Comparative Analysis- 2020/2021 Market Performance
Overall, serviced apartments’ year on year performance improved, with the occupancy rates increasing by 13.5% points to 61.5%, from 48.0% recorded in 2020. The monthly charges per SQM increased by 0.7% to Kshs 2,549 in 2021 from Kshs 2,533 recorded in 2020. The average rental yield increased by 1.5% points to 5.5% in 2021, from 4.0% recorded in 2020. This is mainly attributable to an increase in the number of local and international tourist arrivals following the lift of travel bans by countries such as the UK. This led to increased number of hotel bookings, occupancies and operational hotels during the period. The increase in the number of tourists is attributable to the; i) aggressive local marketing through price discounts, and, international marketing through the Magical Kenya platform in countries such as the Ukraine, ii) positive accolades for the Kenyan hospitality sector, iii) the return of international flights which had stalled from COVID-19 operational guidelines, and, iv) the mass vaccination currently underway in the country boosting confidence in the sector;
The table below shows the comparative analysis between 2020 and 2021;
All values in Kshs unless stated otherwise
|
Comparative Analysis-2020/2021 Market Performance |
|||||||||
|
Node |
Occupancy 2021 |
Occupancy 2020 |
Change in Occupancy |
Monthly Charge/SQM 2021 (Kshs) |
Monthly Charge/SQM 2020 (Kshs) |
% Change in Monthly Charges/SQM |
Rental Yield 2021 |
Rental Yield 2020 |
Change in Rental Yield |
|
Westlands |
68.8% |
49.4% |
19.4% |
3,569 |
3,584 |
(0.4%) |
8.3% |
6.1% |
2.2% |
|
Kileleshwa & Lavington |
57.1% |
48.1% |
9.0% |
2,571 |
2,553 |
0.7% |
6.4% |
4.3% |
2.1% |
|
Nairobi CBD |
66.6% |
42.1% |
24.6% |
2,176 |
2,122 |
2.5% |
4.9% |
2.9% |
2.0% |
|
Kilimani |
60.0% |
48.4% |
11.7% |
2,815 |
2,783 |
1.1% |
5.8% |
4.8% |
1.0% |
|
Thika Road |
56.4% |
48.1% |
8.3% |
1,748 |
1,726 |
1.3% |
3.5% |
2.0% |
1.6% |
|
Upperhill |
61.1% |
48.9% |
12.2% |
2,109 |
2,121 |
(0.6%) |
4.5% |
3.6% |
0.9% |
|
Limuru Road |
60.5% |
51.4% |
9.1% |
2,853 |
2,839 |
0.5% |
4.9% |
4.5% |
0.4% |
|
Average |
61.5% |
48.0% |
13.5% |
2,549 |
2,533 |
0.7% |
5.5% |
4.0% |
1.5% |
|
· Average rental yield increased by 1.5% points to 5.5% in 2021 from 4.0% recorded in 2020. This is mainly attributable to an increase in the number of local and international tourists from the lift of travel bans |
|||||||||
Source: Cytonn Research 2021
- Westlands and Kileleshwa were the best performing nodes with a rental yield of 8.3% and 6.4%, respectively compared to the market average of 5.5%. The submarkets recorded an increase in rental charges by 2.2% and 2.1% points, respectively, compared to an overall market increase of 1.5%. This can be attributed the strategic locations of these areas given its the proximity Nairobi CBD, availability of high quality serviced apartments, ease of accessibility, and proximity to most international organizations hence the demand.
- Performance by Typology
In terms of performance by typology, studio units recorded the highest average rental yield at 6.2%, mainly attributed to the relatively high monthly charges/SQM at Kshs 3,044, compared to 1, 2 and 3 bedroom units at Kshs 2,571, 2,574 and 2,476, respectively. The performance of studio units is also supported by relatively high average occupancy at 62.4% compared to 2 and 3 bedroom units at 57.7% and 57.5%, respectively.
|
Summary per Typology |
||||
|
Typology |
Average Size per SQM |
Monthly Charges per SQM (Kshs) |
Occupancy (%) |
Rental Yield (%) |
|
Studio |
43 |
3,044 |
62.4% |
6.2% |
|
One Bedroom |
75 |
2,571 |
71.4% |
5.9% |
|
Two Bedroom |
102 |
2,574 |
57.7% |
5.6% |
|
Three Bedroom |
150 |
2,476 |
57.5% |
5.1% |
|
Average |
92 |
2,664 |
62.2% |
5.7% |
|
· Studio units recorded the highest average rental yield at 6.2%, mainly attributed to the relatively high monthly charges/SQM at Kshs 3,044, compared to 1, 2 and 3 bedroom units at Kshs 2,571, 2,574 and 2,476, respectively |
||||
Source: Cytonn Research 2021
Section V: Recommendations and Outlook
Having looked at the factors driving the hospitality industry, and specifically the serviced apartments sector, challenges and the current performance, we now conclude with a recommendation of the investment opportunity and outlook.
|
Serviced Apartments Sector Outlook |
||
|
Measure |
Sentiment |
Outlook |
|
Serviced Apartments Performance |
· Serviced apartments in the NMA recorded an average rental yield of 5.5% in 2021, 1.5% points higher than the 4.0% recorded in 2020. Average occupancies also increased by 13.5% points to 61.5% in 2021 from 48.0% in recorded in 2020. · Our outlook is neutral since the sector has not recovered fully from the effects of the COVID-19 pandemic and full recovery to pre-COVID levels is expected by 2024. |
Neutral |
|
International Tourism |
· International arrivals through Jomo Kenyatta International Airport (JKIA) and Moi International Airport (MIA) registered an improvement to 113,307 visitors in Q2’2021 from 1,177 visitors in Q2’2020 This is as a result of the ease of the pandemic restrictions and lockdowns, coupled with the aggressive efforts by the Ministry of Tourism to market the Kenyan hospitality industry as an attractive destination to the rest of the world. · Our outlook is still neutral due to the uncertainties brought about by the possibility of subsequent COVID-19 waves, and drastic measures by key source markets such as the US and the UK in case of developments in regard to the pandemic. |
Neutral |
|
MICE Tourism |
· Kenya has continued to gain popularity as a MICE hub with Kenyatta International Conference Centre (KICC) being recognized as Africa’s leading meeting and conference centre (MICE) in the WTA awards 2021. · Going forward this is expected to be supported by improving infrastructure, and, stable political and macro-economic environment. The wide array of awards indicates continued confidence in Kenya’s hospitality industry despite the impact of COVID-19 pandemic. However, the rise of e-conferencing and online meeting platforms such as Google Meet and Zoom meetings have continued to reduce the need for physical space in conducting meetings. |
Neutral |
|
Supply |
· The number of serviced apartments within the Nairobi Metropolitan Area (NMA) increased by a 7-Year CAGR of 8.5% to 6,044 apartments in 2020, from 3,414 apartments in 2015, with one of the key facilities coming into the market this year being 250-room Skynest Serviced Apartments located in Westlands and the 160-room Habitat Residences located in Kilimani. Spring Valley has also debuted the 40-room Elsie Ridge which was completed this year. · We expect developments in the pipeline to continue adding to the current supply and fostering competition to the benefit of clients |
Neutral |
Given that all our key metrics are neutral, we have a neutral overall outlook for the hospitality sector. Investment opportunity lies in Westlands and Kileleshwa were the best performing nodes with a rental yield of 8.3% and 6.4%, respectively, compared to the market average of 5.5%.
Disclaimer: The views expressed in this publication are those of the writers where particulars are not warranted. This publication, which is in compliance with Section 2 of the Capital Markets Authority Act Cap 485A, is meant for general information only and is not a warranty, representation, advice or solicitation of any nature. Readers are advised in all circumstances to seek the advice of a registered investment advisor.


