Unit Trust Funds, “UTFs”, are collective investment schemes that pool money together from many investors and are managed by professional Fund Managers, who invest the pooled funds in a portfolio of securities to achieve objectives of the trust. Following the release of Unit Trust Fund Managers’ results for FY'2019, we examine the performance of Unit Trust Funds, as they are among the most popular investment options in the Kenyan market. Further, we narrow down to analyze the performance of Money Market Funds, a product under Unit Trust Funds, currently the most popular in terms of Assets under Management, with 87.0% of the UTF market. In our previous focus on Unit Trust Funds, we looked at the H1’2019 Performance by Unit Trust Fund Managers. In this note, we focus on the FY’2019 performance by Unit Trust Fund Managers, where we shall analyze the following:
- Performance of the Unit Trust Funds Industry,
- Performance of Money Market Funds, and,
- Conclusion
Section I: Performance of the Unit Trust Funds Industry
As defined above, Unit Trust Funds are essentially investment schemes that pool money from investors, which are managed by a professional Fund Manager who invests the pooled funds in a portfolio of securities to achieve objectives of the trust. The funds in the unit trust earn returns in the form of dividends, interest income, and/or capital gains depending on the asset class the funds are invested in. The main types of Unit Trust Funds include;
- Money Market Fund – This fund mainly invests in short-term debt securities with high credit quality such as bank deposits, treasury bills, and commercial paper;
- Equity Fund – This fund aims to offer superior returns over the medium to longer-term by maximizing capital gains and dividend income through investing in listed equity securities;
- Fixed Income Fund – This fund invests in interest-bearing securities, which include treasury bills, treasury bonds, preference shares, corporate bonds, loan stock, approved securities, notes and liquid assets consistent with the portfolio’s investment objective; and;
- Balanced Fund – This fund invests in a diversified spread of equities and fixed income securities with the objective to offer investors a reasonable level of current income.
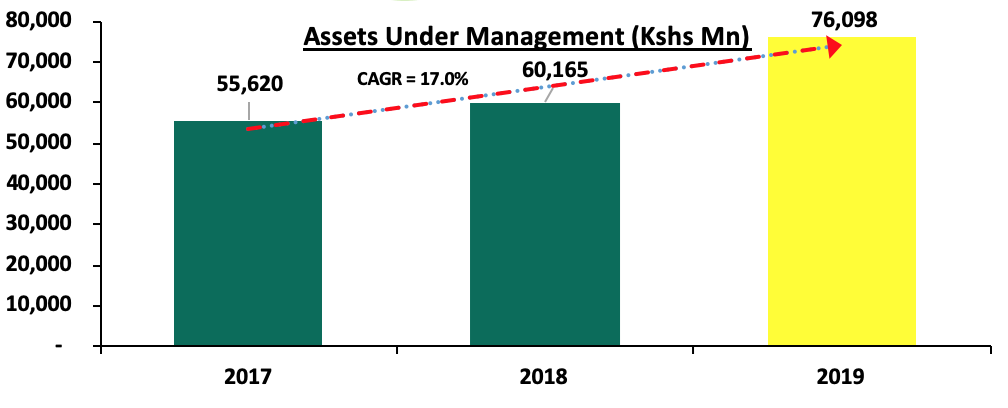
In line with Capital Market Regulations (2002) Part IV (32), Unit Trust Funds Managers released their FY’2019 results. As per the results, the overall Assets under Management (AUM) of the industry grew at a rate of 26.5% to Kshs 76.1 bn in FY’2019, from Kshs 60.2 bn as at FY’2018. In the last two-years, Assets under Management of the Unit Trust Funds have grown at a CAGR of 17.0% from Kshs 55.6 bn to Kshs 76.1 bn.
This growth can be largely attributable to:
- Affordability to Retail Investors: Unit Trust Funds have become more accessible to retail investors, with a majority of the Collective Investment Schemes’ (CIS) in the market requiring an initial investment ranging between Kshs 100.0 - Kshs 10,000.0,
- Diversification: Unit Trust Funds are also advantageous in terms of offering investors the opportunity of diversifying their portfolios by providing them with access to a wider range of investment securities even with limited capital, which would have not been accessible if they invested on their own, and,
- Liquidity: Compared to other investment options such as equities, unit trusts are liquid, as it is easy to sell and buy units without depending on supply and demand at the time of investment or exit. Furthermore, the advent of digitization and automation within the industry has enhanced liquidity enabling an investor to receive their funds within 3 to 5 working days if they are withdrawing to their bank accounts, and immediate access to funds when withdrawing via M-Pesa.
According to the Capital Markets Authority, there are 24 approved collective investment schemes made up of 92 funds in Kenya as of FY’2019. Out of the 24 however, only 19 are currently active. The table below outlines the performance of Fund Managers of Unit Trust Funds in terms of Assets under Management:
|
Assets Under Management (AUM) for the Approved and Active Collective Investment Schemes |
||||
|
No. |
Fund Managers |
FY'2018 AUM (Kshs mns) |
FY'2019 AUM (Kshs mns) |
AUM Growth FY'2018 - FY'2019 |
|
1 |
CIC Asset Managers |
20,270.8 |
29,717.3 |
46.6% |
|
2 |
British American Asset |
8,841.6 |
9,780.4 |
10.6% |
|
3 |
ICEA Lion |
6,951.9 |
8,020.4 |
15.4% |
|
4 |
Commercial Bank of Africa |
5,189.7 |
7,194.8 |
38.6% |
|
5 |
Old Mutual |
6,578.8 |
6,245.9 |
(5.1 %) |
|
6 |
Sanlam Investments |
1,751.0 |
2,735.4 |
56.2% |
|
7 |
African Alliance Kenya |
2,160.2 |
2,082.5 |
(3.6 %) |
|
8 |
Stanlib Kenya |
2,141.0 |
1,917.1 |
(10.5%) |
|
9 |
Dry Associates |
1014.5 |
1,662.4 |
63.9% |
|
10 |
Madison Asset Managers |
1225.4 |
1,594.6 |
30.1% |
|
11 |
Nabo Capital (Centum) |
880.8 |
1,157.9 |
31.5% |
|
12 |
Zimele Asset Managers |
874.6 |
1,099.4 |
25.7% |
|
13 |
Cytonn Asset Managers |
62.8 |
717.3 |
1,042.2% |
|
14 |
Amana Capital |
787.0 |
590.1 |
(25.0 %) |
|
15 |
Apollo Asset Managers |
276.0 |
523.1 |
89.5% |
|
16 |
Genghis Capital |
468.5 |
466.0 |
(0.5 %) |
|
17 |
Equity Investment Bank |
690.7 |
424.3 |
(38.6%) |
|
18 |
Alpha Africa Asset Managers |
- |
164.3 |
- |
|
19 |
Co-op Trust Investment Services Limited |
- |
5.3 |
- |
|
|
Total |
60,165.3 |
76,098.4 |
26.5% |
Source: Capital Markets Authority: Collective Investments Scheme Quarterly Report
Key to note from the above table:
- Assets Under Management: CIC Asset Managers remains the largest overall Unit Trust Fund Manager with an AUM of Kshs 29.7 bn in FY’2019, from an AUM of Kshs 20.3 bn as at FY’2018 translating to a 46.6% growth in AUM,
- Market Share: In terms of market share, CIC Asset Managers remains the largest overall Unit Trust with a market share of 44.1%, an increase from 40.7% in 2018, and,
- Growth: In terms of growth, Cytonn Asset Managers recorded the strongest annualized growth of 1,042.2%, with its market share growing to 0.9% from 0.1% in 2018. Equity Investment Bank recorded the largest decline of 38.6%, with its market share declining to 0.6% from 1.3% in 2018.
Among unit trust products, Money Market Funds continued to be the most popular product in terms of market share, with 87.0%, an increase from 84.3% in 2018 as shown in the table below;
|
Assets Under Management (AUM) by Type of Collective Investment Scheme (All values in Kshs mns unless stated otherwise) |
||||||
|
No. |
Product |
FY'2018 AUM |
FY'2019 AUM |
FY'2018 Market Share |
FY'2019 Market Share |
Variance |
|
1 |
Money Market Funds |
51,019.5 |
66,193.0 |
83.6% |
87.0% |
3.4% |
|
2 |
Equity Fund |
4,695.1 |
4,485.2 |
7.7% |
5.9% |
(1.8%) |
|
3 |
Balanced Fund |
1,741.1 |
1,312.0 |
2.9% |
1.7% |
(1.1%) |
|
4 |
Others |
3,583.1 |
4,108.1 |
5.9% |
5.4% |
(0.5%) |
|
|
Total |
61,038.8 |
76,098.4 |
100.0% |
100.0% |
|
Source: Capital Markets Authority: Collective Investments Scheme Quarterly Report
During the period under review, Money Market Funds recorded 35.5% growth in the Assets Under Management, and consequently, their market share rose to 87.0% from 84.3% in 2018, driven by local investors’ preference for capital preservation during the period of review defined by high volatility in the equities market. While Equity Funds have the potential to outperform stock market indices and deliver better yields than Money Market Funds over the medium to long-term, preservation of capital in Money Market Funds is the main contributory factor for its popularity in Kenya. Balanced Funds, on the other hand, ranked third in comparison to other products, with a market share of 1.7%. Balanced Funds offer investors a reasonable level of current income and long-term capital growth, achieved by investing in a diversified spread of equities and fixed income securities. Having a medium risk profile, Balanced Funds carry a high potential for growth in the near future as they are suitable for pension schemes, treasury portfolios of institutional clients, co-operatives, and high-net-worth individuals amongst others. The Other Funds include Income Funds, Growth Funds, Wealth Funds, Diversified Funds, and Bond Funds.
Section II: Performance of Money Market Funds
Money Market Funds (MMFs) in the recent past have gained popularity in Kenya with growth rates outperforming that of bank deposits. This much faster growth of MMFs’ relative to bank deposits may be attributable to the removal of the deposit rate cap floor in August 2018 by the National Assembly that initially required banks to pay at least 70.0% of the Central Bank Rate (CBR) base rate on deposits. The removal of the deposits rate control meant that banks were free to price the rate at the discretion of the Bank and the customer. This has seen the average deposit rate as per data from the CBK decline to 7.1% post the removal of the floor rate from an average of 7.7% when the legislation was in place. Money Market Funds, in contrast, have been able to offer investors more attractive yields from their investments owing to their diversified asset allocation that maximizes returns on a risk-adjusted basis. As per the regulation funds in MMFS’ are invested in liquid interest-bearing securities that have a weighted average maturity of less than 12-months. These securities include bank deposits, securities listed on NSE, and securities issued by the government. The allocation to these 3 asset classes in 2019 was 28.9%, 9.0%, and 55.0% for bank deposits, securities listed on NSE, and securities issued by the Government of Kenya, respectively in FY’2019. As such, the Fund is best suited for investors who require a low-risk investment that offers capital stability, liquidity, and a high-income yield. The Fund is also a good safe haven for investors who wish to switch from a higher risk portfolio to a low risk, high-interest portfolio, especially during times of high stock market volatility.
- Top Five Money Market Funds by Assets Under Management
The total Assets Under Management in Money Market Funds grew by 35.5% to Kshs 65.7 bn in FY’2019, from Kshs 48.5 bn in FY’2018. The top five Money Market Funds control AUM of Kshs 54.1 bn, which translates to 82.4% of the total AUM in Money Market Funds. The table below shows the top five Money Market Funds as at FY’2019:
|
Top 5 Money Market Funds by Assets Under Management |
||||||
|
No. |
Fund Managers |
FY'2018 Money Market Fund (Kshs Mns) |
FY'2019 Money Market Fund (Kshs Mns) |
FY'2018 Market Share |
FY'2019 Market Share |
Variance |
|
1. |
CIC Money Market Fund |
19,756.7 |
29,016.0 |
40.7% |
44.1% |
3.4% |
|
2. |
British-American Money Market Fund |
5,871.1 |
7,334.1 |
12.1% |
11.2% |
(0.9%) |
|
3. |
ICEA Lion Money Market Fund |
5,916.3 |
6,800.2 |
12.2% |
10.3% |
(1.9%) |
|
4. |
CBA Money Market Fund |
4,946.9 |
6,446.2 |
10.2% |
9.8% |
(0.4%) |
|
5. |
Old Mutual Money Market Fund |
4,877.6 |
4,545.5 |
10.1% |
6.9% |
(3.1%) |
|
|
Total |
41,368.5 |
54,141.9 |
85.3% |
82.4% |
(2.9%) |
Source: Capital Markets Authority: Collective Investments Scheme Quarterly Report
- Top Five (5) Money Market Funds by Growth Rate
As at the end of FY’2019, Cytonn Money Market Fund recorded the fastest growth in Assets under Management (AUM) coming in at 837.7% to Kshs 588.6 mn, from Kshs 62.8 mn recorded in FY’2018. The top five Money Market Funds in terms of growth rate recorded in FY’2019 as highlighted below:
|
Top 5 Money Market Funds by Growth Rate |
||||
|
No. |
Fund Managers |
FY'2018 AUM(Kshs Mns) |
FY'2019 AUM(Kshs Mns) |
FY'2019 Growth Rate |
|
1 |
Cytonn Money Market Fund |
62.8 |
588.6 |
837.7% |
|
2 |
Nabo Africa Money Market Fund |
237.7 |
486.4 |
104.6% |
|
3 |
Apollo Money Market Fund |
251.4 |
494.9 |
96.8% |
|
4 |
Dry Associates Money Market Fund |
894.3 |
1,524.5 |
70.5% |
|
5 |
Sanlam Pesa Money Market Fund |
1,715.9 |
2,700.2 |
57.4% |
Source: Capital Markets Authority: Collective Investments Scheme Quarterly Report
- Top Five (5) Money Market Funds by Yields
During the period under review, the following Money Market Funds had the highest average effective annual yield declared, with the Cytonn Money Market Fund having the highest effective annual yield at 10.9% against the industrial average of 8.7%.
|
Top 5 Money Market Funds by Yield |
||
|
Rank |
Money Market Funds |
Effective Annual Rate (Average FY’2019) |
|
1 |
Cytonn Money Market Fund |
10.9% |
|
2 |
Alphafrica Kaisha Money Market Fund |
10.7% |
|
3 |
Nabo Africa Money Market Fund |
10.0% |
|
3 |
Zimele Money Market Fund |
9.9% |
|
4 |
CIC Money Market Fund |
9.7% |
|
|
Industrial Average |
8.7% |
- Comparing Unit Trust Funds AUM Growth with Bank Deposits Growth
Unit Trust Funds assets recorded improved growth of 26.5% in FY’2019, compared to a growth of 4.3% in FY’2018, while the listed bank deposits grew by 12.7% in FY’2019 compared to a growth of 10.3% recorded in FY’2018. Money Market Funds, on the other hand, recorded an impressive growth of 35.5% in FY’2019, compared to a growth of 8.9% in FY’2018. This could be attributable to Money Market Funds offering more attractive yields as compared to bank deposits, more so since the scrapping of the rate cap floor in August 2018.
The reason for the popularity of Money Market Funds in Kenya is attributable to affordable initial and additional investment requirements, high liquidity, and daily compounding of interest. While initial deposit and additional investments may vary depending on the fund, Money Market Funds present a low risk, affordable and high-yielding investment opportunity for investors and guarantees capital preservation, a key feature of MMFs. Other than the ease of investing, Money Market Funds also provide individual investors with economies of scale through pooling their funds together and make investments that would otherwise be out of reach for individual investors. Thus, they benefit from the economies of scale created in the form of diversification, cost savings, and attractive returns on investments.
Section III: Conclusion
In conclusion, as Money Market Funds continue to lead among unit trust products, there is a need to leverage more on innovation and digitization in order to further propel the growth of MMFs in Kenya. Take for instance China’s first online money market fund known as Yu’eBao that has explosively grown into one of the world’s largest MMF with an AUM of USD 157.0 bn as at December 2019, despite being launched in 2013. Yu’eBao of Tianhong Asset Management was launched as a spare cash management platform, allowing users to transfer idle cash as low as USD 0.15 (Kshs 15.6) into the money market fund, with the use of the Alipay e-wallet. The use of technology as a distribution channel for mutual fund products opened up the fund manager to the retail segment, which is characterized by strong demand among retail clients for convenient and innovative products. The advent of digitization and automation within the industry has enhanced liquidity. A good example is the Cytonn Money Market Fund where clients can issue withdrawal instructions and have funds remitted to their bank accounts within 2 – 4 working days while funds withdrawn through the USSD or digital platforms are remitted to their M-Pesa and Bank accounts within 5 mins and 2 working days respectively; the Cytonn Money Market Fund is accessible through dialing *809#. Amidst the Coronavirus pandemic, we believe that the returns for Money Market Funds will remain stable with a bias to a slight increase upwards should rates on government securities increase. They will also remain the most liquid of all mutual funds providing a short-term parking bay that earns higher income yields compared to deposits and savings accounts. For more information on the potential effects of coronavirus on money market funds, see our topical, Potential Effects of COVID-19 on Money Market Funds.
In terms of the top 3 key performance indicators:
- The largest Money Market Fund was CIC Money Market Fund with a 44.1% market share, followed by British-American Money Market Fund with an 11.2% market share,
- The fastest-growing Money Market Fund was Cytonn Money Market Fund, registering 837.7% growth, followed by Nabo Africa Money Market Fund with 104.6% growth, and Apollo Money Market Fund with 96.8% growth, and,
- The highest yielding Money Market Fund was Cytonn Money Market Fund with an average yield of 10.9%, followed by Alphafrica Kaisha Money Market Fund with an average yield of 10.7%, and Nabo Africa Money Market Fund with an average yield of 10.0%.


