Unit Trust Funds (UTFs) are a form of Collective Investment Scheme that pools capital from multiple investors to invest in a diversified portfolio of assets, managed by a Fund Manager, with the goal of generating returns for the investors. Expert fund managers oversee these funds, allocating the pooled capital into a variety of securities such as equities, bonds, and other approved financial instruments. The objective is to achieve returns that match the fund’s specific goals. Following the release of the Capital Markets Authority (CMA) Quarterly CIS Report – Q1’2024, we examine the performance of Unit Trust Funds for the period ended 31st March 2024. These funds have seen consistent growth in total Assets Under Management (AUM) and are one of the preferred investment choices in Kenya. Additionally, we will delve into the performance of Money Market Funds, which are a sub-set of Unit Trust Funds.
In our previous focus on Unit Trust Funds, we looked at the Unit Trust Funds Performance – FY'2023 by Fund Managers, where we highlighted that their AUM stood at Kshs 215.1bn, a 4.1% growth from Kshs 206.7 bn recorded in Q3’2023. In this topical, we focus on the Q1’2024 performance of Unit Trust Funds where we shall analyze the following:
- Performance of the Unit Trust Funds Industry,
- Performance of Money Market Funds,
- Comparing Unit Trust Funds AUM Growth with other Markets, and,
- Recommendations.
Section I: Performance of the Unit Trust Funds Industry
Unit Trust Funds (UTF) are Collective Investment Scheme that pools money from various investors and invests it in a diversified portfolio of assets such as stocks, bonds, and other securities. The primary purpose of unit trust funds is to provide individuals and institutional investors with an opportunity to access a professionally managed and diversified investment portfolio, even with relatively small amounts of capital. These funds are managed by professional fund managers who make investment decisions on behalf of the investors, aiming to generate returns and mitigate risks. In this report, we will delve into the performance of Unit Trust Funds in Q1'2024 following the release of the Capital Markets Authority (CMA) Quarterly CIS Report – Q1’2024. Our objective is to provide a comprehensive analysis of how different types of unit trust funds have performed during this period, shedding light on the key factors influencing their performance.
Unit Trust Funds (UTFs) come in various forms, each tailored to different investment objectives, time horizons, and risk tolerance levels. Understanding these distinctions is essential for investors to make informed decisions. The main types of Unit Trust Funds include:
- Money Market Funds - These funds invest in short-term, low-risk securities such as fixed deposits, Treasury bills, and commercial papers. They aim to provide stability and liquidity, making them suitable for preserving capital and minimizing risk.
- Equity Funds - These funds primarily invest in publicly traded securities with the goal of achieving high returns over the medium to long term. They focus on capital appreciation and dividend income while maintaining a portion of assets in liquid fixed-income instruments to ensure liquidity and meet redemption requests without depleting overall value.
- Balanced Funds - Balanced funds invest in both equities and fixed-income securities to achieve a mix of income and capital appreciation. They offer a balanced risk-reward profile, ideal for investors seeking a middle ground between risk and returns.
- Fixed Income Funds - These funds focus on generating income by investing in a portfolio of fixed-income securities, such as government and corporate bonds. They aim to provide a stable income stream while managing interest rate and credit risks.
- Special Funds - These funds concentrate on a specific sector or industry, offering heightened diversification within the chosen sector. They provide investors with targeted exposure to a particular market area that may not be easily accessible through other fund types.
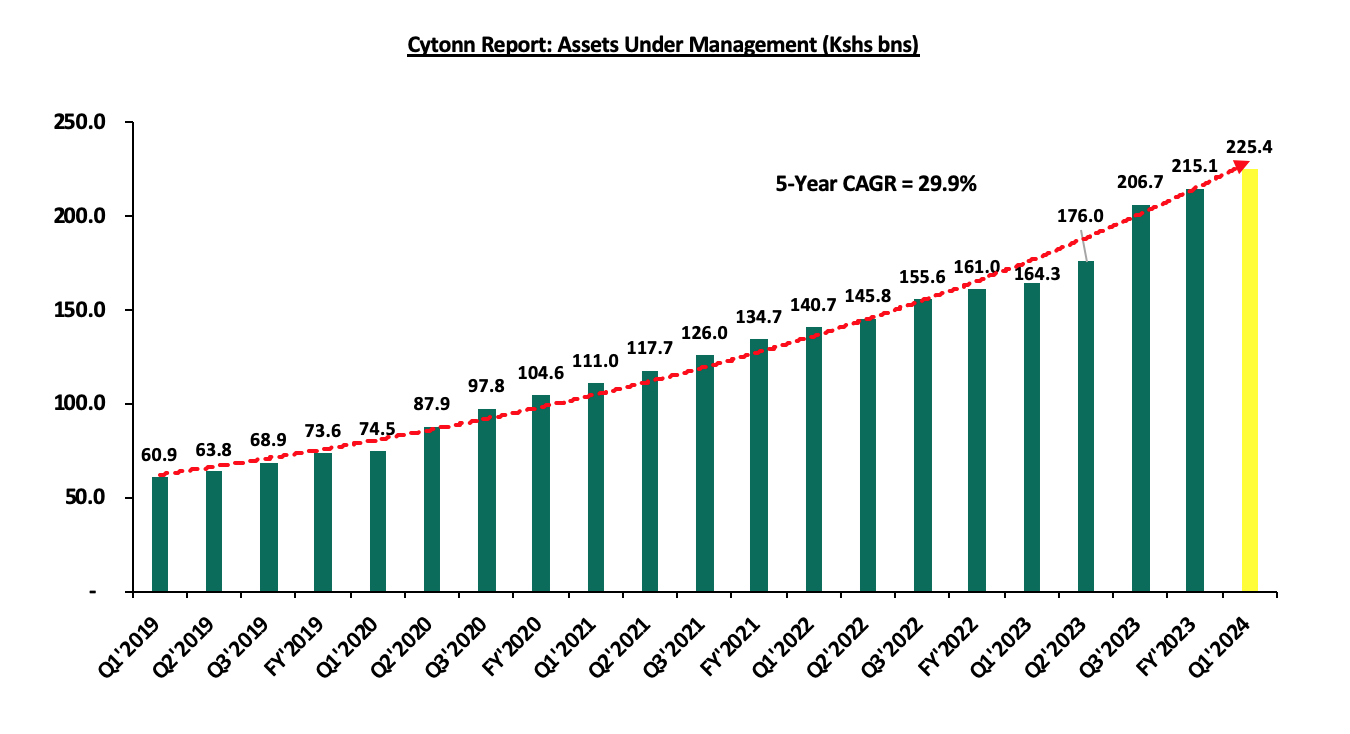
As per the Capital Markets Authority (CMA) Quarterly Collective Investment Schemes (CIS) Report-Q1’2024, the industry’s overall Assets under Management (AUM) grew by 4.8% on a quarter-on-quarter basis to Kshs 225.4 bn at the end of Q1’2024, from Kshs 215.1 bn recorded in FY’2023. On a y/y basis, the total AUM increased by 37.2%, from Kshs 164.3 bn as at the end of Q1’2023. Key to note, Assets under Management of the Unit Trust Funds have registered an upward trajectory over the last five years, growing at a 5-year CAGR of 29.9% from Kshs 60.9 bn recorded in Q1’2019. The chart below shows the growth in Unit Trust Funds’ AUM
Source: Capital Markets Authority
The growth can be largely attributed to:
- Low Investments minimums: Most Unit Trust Funds Collective Investment Schemes (CIS) in the market have relatively low initial investment requirements, typically ranging from Kshs 100.0 to Kshs 10,000.0. This has promoted financial inclusion by enabling small-scale investors to access professionally managed investment opportunities,
- Diversified product offering: Unit Trust Funds are also advantageous in terms of providing investors with access to a wider range of investment securities through the pooling of funds. This allows for portfolio diversification that might not be achievable individually, helping investors mitigate the risks associated with market volatility in some asset classes,
- Competitive returns: The positive performance and competitive returns of unit trust funds have been key in attracting investors. As these funds consistently outperform certain traditional investment options, they draw more investors seeking to generate wealth over the long term,
- Increased product awareness: There has been a drive towards investor education mainly by the Capital Markets Authority (CMA) and the fund managers on the various products offered by trust funds, which has meant that more people are aware and have a deeper understanding of the investment subject. As a result, their confidence has been boosted leading to increased uptake,
- Efficiency and High Liquidity: Investments in UTFs are managed as portfolios with various assets, and fund managers maintain a cash buffer. Unit trusts are highly liquid, making it easy to buy and sell units without being dependent on market demand and supply at the time of investment or exit, and,
- Adoption of Fintech: Digitization and automation within the industry have enhanced ease in cash accessibility, enabling investors to immediately access their investments via mobile payment platforms. According to the Central Bank of Kenya, more individuals are transacting through mobile money services as evidenced by the sustained growth in the total number of registered mobile money accounts. During the period under review, registered mobile money accounts recorded a 4.9% y/y increase to 77.3 mn accounts, from 73.7 mn accounts registered in Q1’2023. Notably, the total number of registered mobile money accounts also grew at a 5-year CAGR of 9.0% to 77.3 mn by February 2024, from 50.4 mn recorded at the end of Q1’2019. The upward trajectory is attributable to Fintech incorporation which has increased the efficiency of processing both payments and investments for fund managers. As a result, Collective Investment Schemes have become more accessible to retail investors.
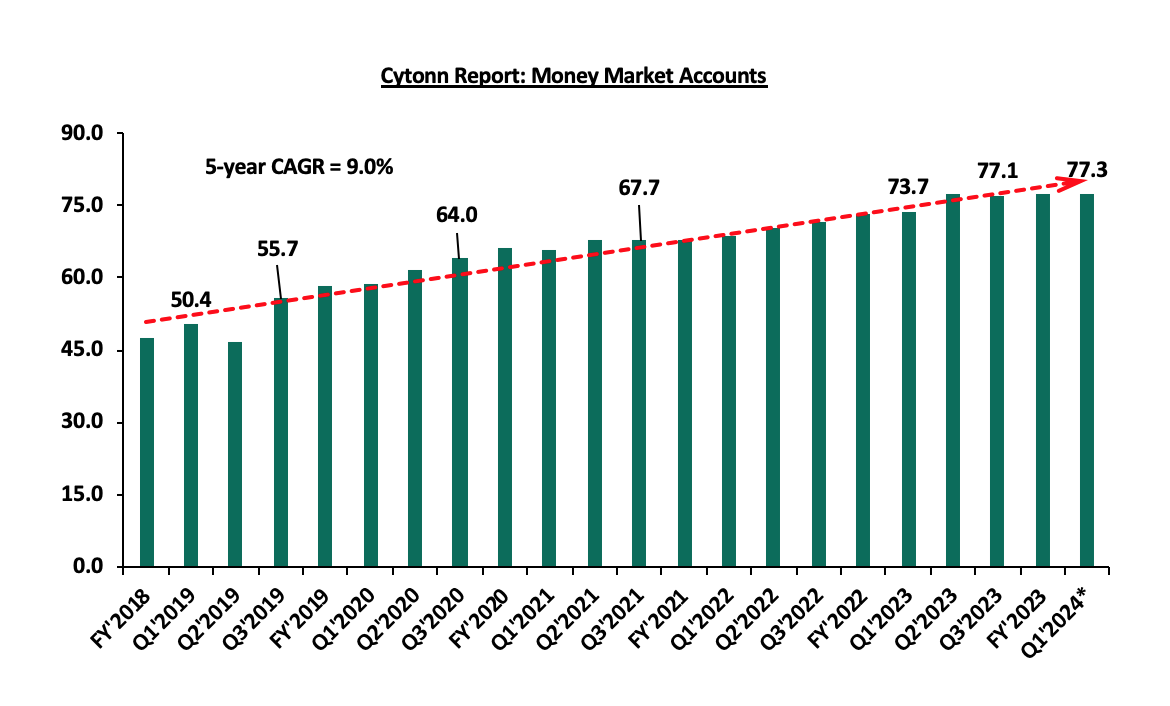
Source: Cytonn Research
*Data as of February 2024
Spread of Investments:
|
Cytonn Report: Investment Allocation in Different Funds |
|||||
|
Fund |
FY'2023 |
FY'2023 Investment Share |
Q1'2024 |
Q1'2024 Investment Share |
% points Change in Investment Share |
|
Money Market |
140.8 |
65.5% |
148.6 |
65.9% |
0.4% |
|
Fixed Income |
44.4 |
20.7% |
45.8 |
20.3% |
(0.4%) |
|
Equity Fund |
2.5 |
1.1% |
2.7 |
1.2% |
0.1% |
|
Balanced Fund |
2.0 |
0.9% |
1.7 |
0.8% |
(0.1%) |
|
Other |
25.4 |
11.8% |
26.5 |
11.8% |
(0.0%) |
|
Total |
215.1 |
100.0% |
225.4 |
100.0% |
|
Key take-outs from the table above include:
- Money Market Funds: MMFs remained with the largest investment allocation, coming in at 65.9% in Q1’2024, a slight improvement from 65.5% recorded in FY’2023. Notably, on a y/y basis the allocation in MMFs has declined by 9.0% points from 74.9% allocation recorded in Q1’2023, mainly attributable to the reallocation of funds into fixed income funds, following the higher yields by government securities especially short-term bonds. Key to note, according to Capital Markets Authority (CMA), MMFs are required to invest only in interest-earning money market instruments which have a maximum weighted average tenor of thirteen (13) months, while fixed income funds invest a minimum of 80.0% of their market value of assets under management (AUM) in fixed income securities at all times hence concentrating most their investments in bonds. However, the high percentage of 65.9% in Q1’2024 is an indication of MMFs preference by the majority of investors due to their ease of investing and high liquidity, coupled with high returns,
- Fixed Income Funds recorded a 3.1% q/q growth to Kshs 45.8 bn in Q1’2024, up from Kshs 44.4 in FY’2023. The allocation however decreased marginally by 0.4% points to 20.3%, from the 20.7% recorded the previous quarter. The decline in allocation can be attributed to the rise in investors’ preference for more liquid investment vehicles like Money Markets amid the tough economic environment and market volatility, and,
- Equity Funds recorded improved performance with their investment allocation increasing by 0.1% points to 1.2% at the end of Q1’2024, from 1.1% at the end of FY’2023. The increase in equity fund’s portfolio holdings is largely attributable to increased market activity, with the Nairobi All Share Index (NASI) registering a 22.8% gain in Q1’2024 following increased corporate earnings by major listed companies in the Nairobi Securities Exchange as well as the improvement in the Kenyan economy as supported by the easing inflationary pressures, strengthening Shilling and improved Purchasing Manager’s Index (PMI) to an average of 50.3 in Q1’2024, from an average of 49.3 in Q1’2023.
Notably, the overall UTFs portfolio is heavily invested in government Securities, registering a slight increase to Kshs 107.7 bn in Q1’2024, from Kshs 101.2 bn in FY’2023. Consequently, the allocation to government securities increased marginally by 0.8% points to 47.8% of the total assets, from the 47.0% recorded in FY’2023. This was followed by Fixed deposits at 29.7% allocation, a notable decrease from 34.5% allocation in FY’2023 and 39.5% in Q1’2023, attributable to the lower deposit rates provided by banking institutions. The table below represents asset allocations in different asset classes comparing Q1’2023, FY’2023 and Q1’2024 in the UTF industry.
|
Cytonn Report: Distribution of Investments in terms of Asset Classes (Kshs bn) |
||||||
|
Fund |
Q1'2023 |
Q1'2023 (%) |
FY'2023 |
FY'2023 (%) |
Q1'2024 |
Q1'2024 (%) |
|
Government Securities |
76.0 |
46.2% |
101.2 |
47.0% |
107.7 |
47.8% |
|
Fixed Deposits |
64.8 |
39.5% |
74.2 |
34.5% |
67.0 |
29.7% |
|
Cash and demand deposits |
10.6 |
6.6% |
22.9 |
10.7% |
35.3 |
15.7% |
|
Unlisted Securities |
4.3 |
2.6% |
10.1 |
4.7% |
9.6 |
4.2% |
|
Listed Securities |
5.9 |
3.6% |
4.6 |
2.1% |
3.8 |
1.7% |
|
Offshore Investments |
0.7 |
0.4% |
0.8 |
0.4% |
0.8 |
0.3% |
|
Other collective investments schemes |
1.2 |
0.8% |
0.8 |
0.3% |
0.8 |
0.4% |
|
Immovable property |
0.5 |
0.3% |
0.6 |
0.3% |
0.5 |
0.2% |
|
Total |
164.3 |
100.0% |
215.1 |
100.0% |
225.4 |
100.0% |
According to the Capital Markets Authority, as of the end of Q1’2024, there were 36 Collective Investment Schemes (CISs) in Kenya, up from 35 recorded at the end of Q1’2023 and remaining unchanged from 36 recorded at the end of FY’2023. Out of the 36 schemes, 29 of them (equivalent to 80.6%) were active while 7 (19.4%) were inactive. The table below outlines the performance of the Collective Investment Schemes comparing FY’2023 and Q1’2024;
|
Cytonn Report: Assets Under Management (AUM) for the Approved Collective Investment Schemes |
||||||
|
No. |
Collective Investment Schemes |
FY’2023 AUM |
FY’2023 |
Q1'2024 AUM |
Q1’2024 |
AUM Growth |
|
(Kshs mn) |
Market Share |
(Kshs mn) |
Market Share |
FY’2023 –Q1'2024 |
||
|
1 |
CIC Unit Trust Scheme |
63,331.6 |
29.4% |
61,916.2 |
27.5% |
(2.2%) |
|
2 |
NCBA Unit Trust Scheme |
30,934.4 |
14.4% |
31,287.8 |
13.9% |
1.1% |
|
3 |
British American Unit Trust Scheme |
31,707.1 |
14.7% |
30,029.5 |
13.3% |
(5.3%) |
|
4 |
Sanlam Unit Trust Scheme |
25,126.7 |
11.7% |
29,699.2 |
13.2% |
18.2% |
|
5 |
ICEA Unit Trust Scheme |
15,953.3 |
7.4% |
15,654.8 |
6.9% |
(1.9%) |
|
6 |
Old Mutual Unit Trust Scheme |
10,661.8 |
5.0% |
11,831.7 |
5.3% |
11.0% |
|
7 |
ABSA Unit Trust Scheme |
5,300.6 |
2.5% |
8,003.0 |
3.6% |
51.0% |
|
8 |
Co-op Unit Trust Scheme |
5,091.7 |
2.4% |
6,038.5 |
2.7% |
18.6% |
|
9 |
Madison Asset Managers |
5,564.0 |
2.6% |
5,934.5 |
2.6% |
6.7% |
|
10 |
Nabo Capital Limited |
4,495.2 |
2.1% |
4,707.3 |
2.1% |
4.7% |
|
11 |
Dry Associates Unit Trust Scheme |
4,483.9 |
2.1% |
4,253.9 |
1.9% |
(5.1%) |
|
12 |
Zimele Asset Managers |
2,867.4 |
1.3% |
2,862.7 |
1.3% |
(0.2%) |
|
13 |
Mali Money Market Fund |
1,441.8 |
0.7% |
1,828.1 |
0.8% |
26.8% |
|
14 |
Jubilee Unit Trust Scheme |
1,274.3 |
0.6% |
1,617.0 |
0.7% |
26.9% |
|
15 |
KCB Asset Managers |
911.1 |
0.4% |
1,555.5 |
0.7% |
70.7% |
|
16 |
African Alliance Kenya |
1,330.8 |
0.6% |
1,445.7 |
0.6% |
8.6% |
|
17 |
Apollo Asset Managers |
1,078.8 |
0.5% |
1,296.4 |
0.6% |
20.2% |
|
18 |
Etica Capital Limited |
275.5 |
0.1% |
1,027.6 |
0.5% |
273.0% |
|
18 |
Cytonn Asset Managers |
866.1 |
0.4% |
1,027.3 |
0.5% |
18.6% |
|
20 |
Lofty-Corban Unit Trust Scheme |
459.1 |
0.2% |
908.8 |
0.4% |
98.0% |
|
21 |
GenAfrica Unit Trust Scheme |
421.0 |
0.2% |
757.5 |
0.3% |
79.9% |
|
22 |
Genghis Unit Trust Fund |
647.5 |
0.3% |
613.7 |
0.3% |
(5.2%) |
|
23 |
Enwealth Capital Unit Trust |
184.8 |
0.1% |
306.2 |
0.1% |
65.7% |
|
24 |
Kuza Asset Managers |
200.7 |
0.1% |
297.2 |
0.1% |
48.1% |
|
25 |
Orient Collective Investment Scheme |
258.4 |
0.1% |
262.5 |
0.1% |
1.6% |
|
26 |
Equity Investment Bank |
143.6 |
0.1% |
144.1 |
0.1% |
0.4% |
|
27 |
Mayfair Asset Managers |
17.0 |
0.0% |
28.0 |
0.0% |
64.5% |
|
28 |
Amana Capital |
25.4 |
0.0% |
25.8 |
0.0% |
1.5% |
|
29 |
Wanafunzi Investments |
0.8 |
0.0% |
0.8 |
0.0% |
4.0% |
|
30 |
Diaspora Unit Trust Scheme |
- |
- |
- |
- |
|
|
31 |
Dyer and Blair Unit Trust Scheme |
- |
- |
- |
- |
|
|
32 |
Standard Investments Bank |
- |
- |
- |
- |
|
|
33 |
Masaru Unit Trust Fund |
- |
- |
- |
- |
|
|
34 |
Adam Unit Trust Fund |
- |
- |
- |
- |
|
|
35 |
First Ethical Opportunities Fund |
- |
|
- |
- |
|
|
36 |
Amaka Unit Trust (Umbrella) Scheme |
- |
|
- |
- |
|
|
|
Total |
215,054.2 |
100.0% |
225,361.4 |
100.0% |
4.8% |
Key take-outs from the above table include:
- Assets Under Management: CIC Unit Trust Scheme remained the largest overall Unit Trust Fund, accounting for 27.5% of the total market share. However, the AUM recorded a 2.2% decline to Kshs 61.9 bn in Q1’2024, slightly lower than the AUM of Kshs 63.3 bn in FY’2023,
- Growth: In terms of AUM growth, Etica Capital Limited recorded the highest growth of 273.0% with its AUM increasing to Kshs 1.0 bn, from Kshs 0.3 bn in FY’2023, due to the low base effect. On the other hand, British American Unit Trust Scheme recorded the largest decline with its AUM declining by 5.3% to Kshs 30.0 bn in Q1’2024, from Kshs 31.7 mn in FY’2023,
- Market Share: CIC Unit Trust Scheme remained the largest overall Unit Trust with a market share of 27.5%, a 2.0% points decline from 29.4% recorded in FY’2023. The decline in market share is an indication of increasing competition as new collective schemes enter the market,
- New Collective Investment Schemes: There were no new entrants in Q1’2024, and,
- 7 UTFs remained inactive as at the end of Q1’2024: First Ethical Opportunities Fund, Adam Unit Trust Fund, Masaru Unit Trust Fund, Dyer and Blair Unit Trust Scheme, Diaspora Unit Trust Scheme, Standard Investments Bank, and Amaka Unit Trust remained inactive as at the end of Q1’2024.
Section II: Performance of Money Market Funds
Money Market Funds (MMFs) have continued to gain popularity in Kenya, largely due to the higher returns they offer in comparison to bank deposits in addition to having a high degree of safety. According to the Central Bank of Kenya data, the average bank deposit rate in February 2024 increased to 10.3% from 10.2% recorded in January 2024, albeit lower than the Q1’2024 average yields of 91-day T-bill and Money Market Funds at 16.5% and 14.2% respectively. The graph below shows the performance of the Money Market Fund to other short-term financial instruments:
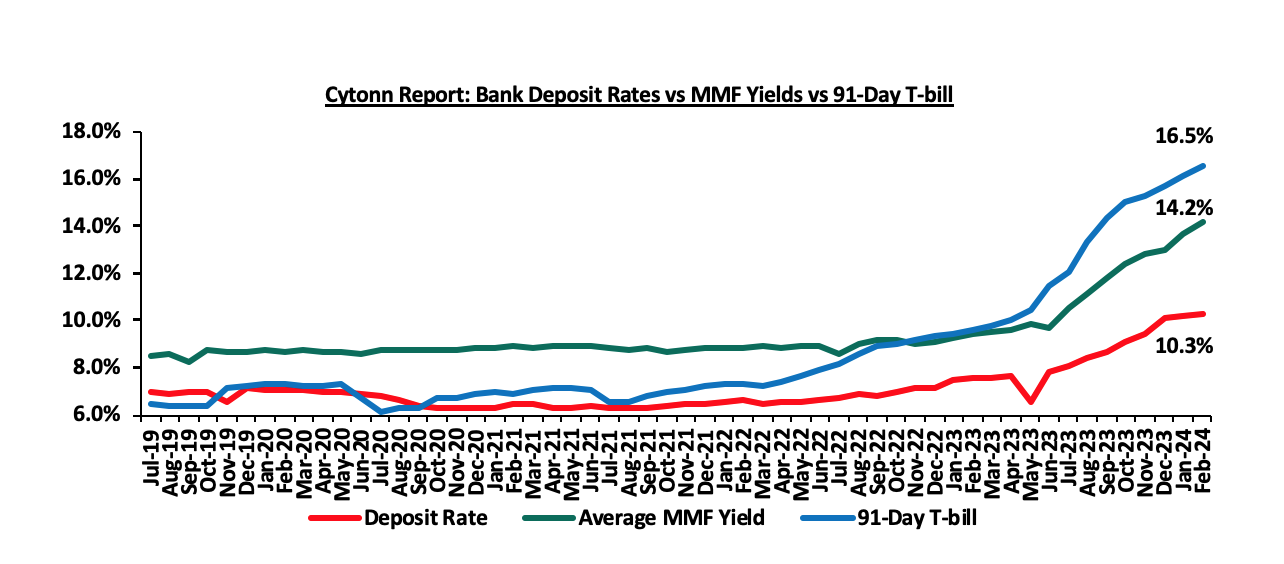
Source: Central Bank of Kenya, Cytonn Research
As per the regulations, funds in MMFs should be invested in short-term liquid interest-bearing securities with a weighted tenor to maturity of 13 months or less. The short-term securities include treasury bills, call deposits, commercial papers, and fixed deposits in commercial banks and deposit-taking institutions, among others as specified by CBK. As a result, Money Market Funds are best suited for investors who require a low-risk investment that offers capital preservation and liquidity, but with a high-income yield. The funds are also a good safe haven for investors who wish to switch from a higher-risk portfolio to a low-risk portfolio, especially during times of uncertainty.
Money Market Funds in Kenya accounted for Kshs 148.6 bn which makes up 65.9% of all the funds under management by Collective Investment Schemes for Q1’2024. This is 5.6% higher than the Kshs 140.8 bn recorded at the end of Q4’2023.
Money Market funds as an asset class are still below their utmost potential, with Kenya’s MMF assets to GDP coming in at 1.0% as of Q1’2024, which is below the global average MMF assets to GDP ratio of 8.7% as of FY’2023. This means that more needs to be done to increase the ratio, especially at a time when the government is trying to increase savings to GDP ratio. Notably, the 1.0% Money market AUM to GDP in Kenya has remained unchanged from the same figure recorded in 2021. This is still despite the rising yields in Money markets which remain highly competitive compared to other traditional investment options. The chart below shows the performance of the Money Market Funds AUM to GDP comparing Kenya to other economies:
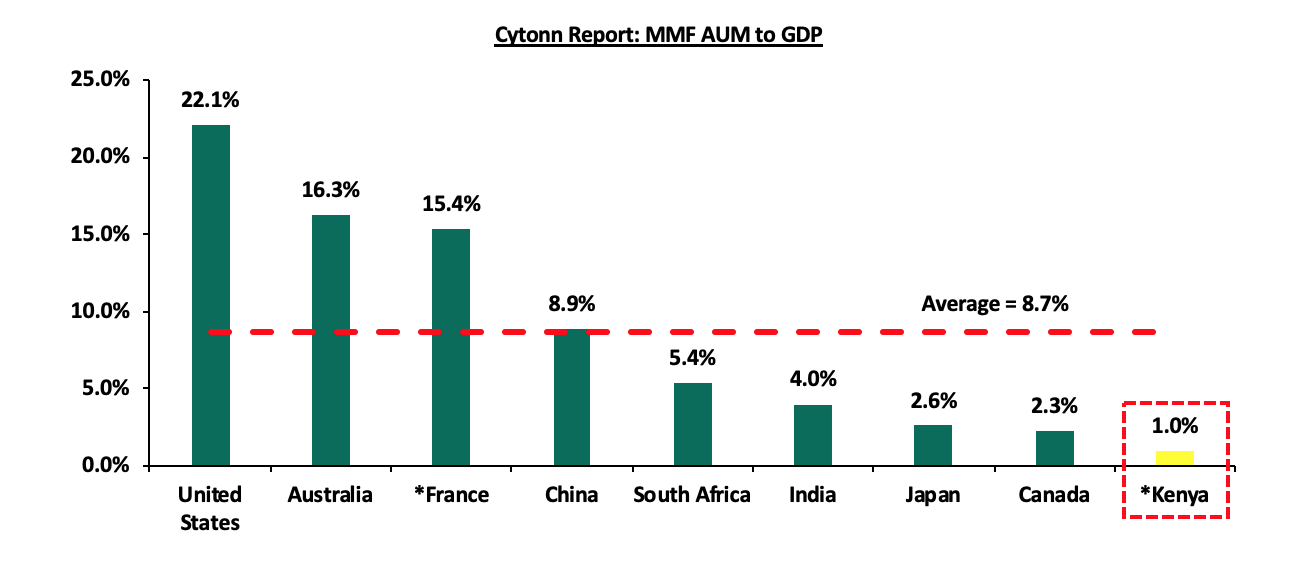
Source: World Bank, CMA, EFAMA
* Data as of Q1’2024
Top Five Money Market Funds by Yields
During the period under review, Etica Money Market Fund registered the highest average effective annual yield at 17.3% against the industry Q1’2024 average of 14.2%. Below is a table of the top five Money Market Funds with the highest average effective annual yield declared in Q1’2024;
|
Cytonn Report: Top 5 Money Market Fund Yield in Q1’2024 |
||
|
Rank |
Money Market Fund |
Effective Annual Rate (Average Q1'2024) |
|
1 |
Etica Money Market Fund |
17.3% |
|
2 |
Lofty-Corban Money Market Fund |
17.0% |
|
3 |
Cytonn Money Market Fund |
16.4% |
|
4 |
Nabo Africa Money Market Fund |
16.2% |
|
5 |
GenAfrica Money Market Fund |
16.1% |
|
|
Average of Top 5 Money Market Funds |
16.6% |
|
Industry average |
14.2% |
|
Source: Cytonn Research
Section III: Comparison between Unit Trust Funds AUM Growth and Other Markets
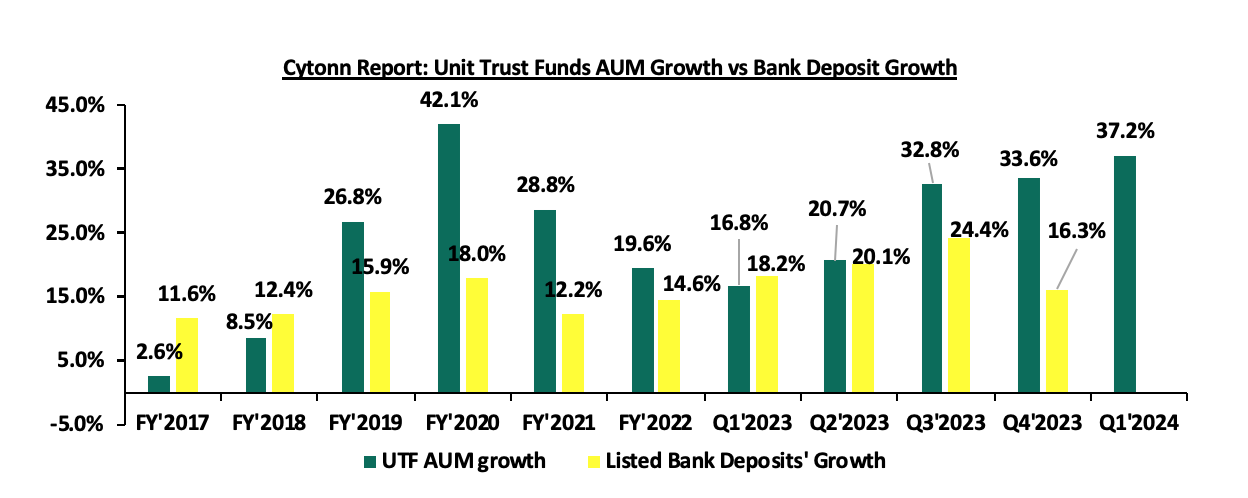
Unit Trust Funds’ assets recorded a y/y growth of 37.2% in Q1’2024, coming in above 16.3% cumulative deposit growth to Kshs 5.8 tn from Kshs 4.9 tn in December 2022 for the listed banks as per the last released data as at end of FY’2023. For the Unit Trust Funds, the growth of 37.2% was an increase of 3.6% points, compared to the 33.6% y/y growth recorded in Q4’2023. On the other hand, listed banks’ deposits recorded a growth of 16.3% in Q4’2023, translating to 8.1% points decrease from the 24.4% growth recorded in Q3’2023. The chart below highlights the year-on-year AUM growths for Unit Trust Funds AUM vs Listed banks’ deposits growth since 2017;
Source: Cytonn Research
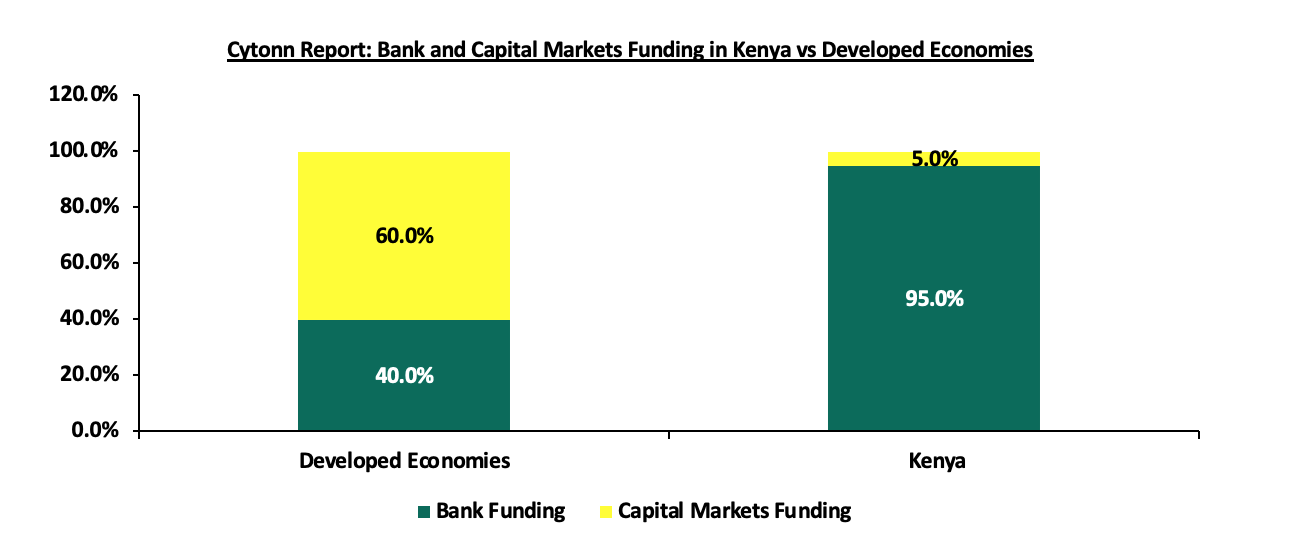
We note that there was a 4.8% points q/q increase in UTF growth which can be attributed to the relatively higher returns in the collective investment schemes, especially the MMFs, which have continued to gain traction among investors. As at February 2024, average bank deposit rates stood at 10.3%, while Money Market Funds offered an average return of 14.2% for the same period. We therefore anticipate an expansion in business funding coming from capital markets from the current 5.0%, in the short-term to medium term. World Bank statistics reveal that in efficient economies, only 40.0% of business financing comes from banks, while a significant 60.0% is sourced from Capital markets. However, in Kenya, the scenario is quite different. The World Bank points out that Kenyan businesses depend on banks for a whopping 95.0% of their funding, with a negligible 5.0% being raised from the capital markets.
Source: World Bank
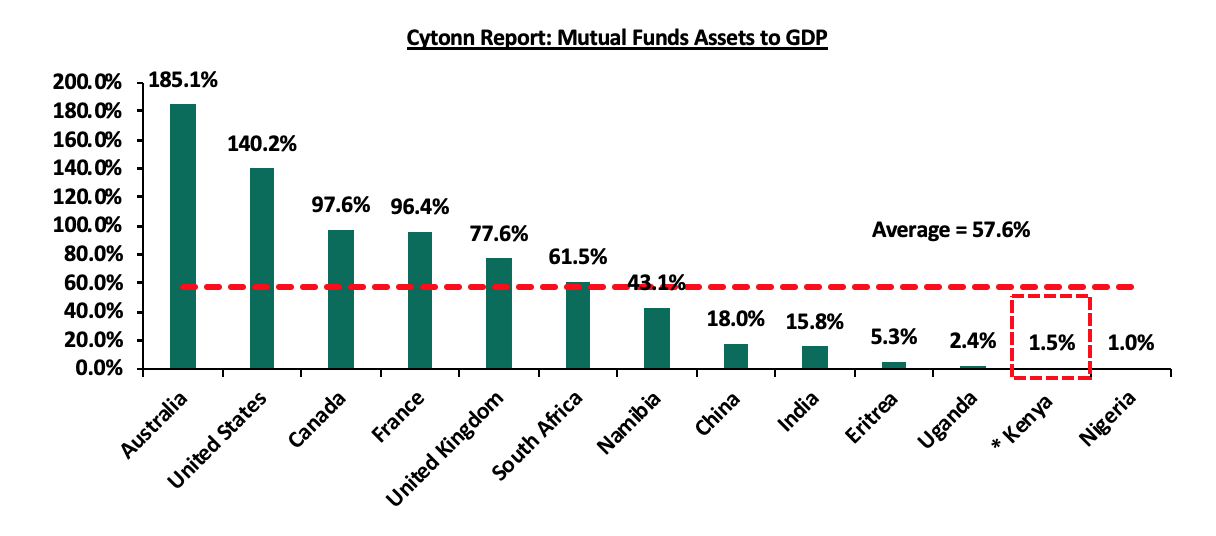
Notably, Kenya’s Mutual Funds/UTFs to GDP ratio at the end of Q1’2024 came in at 1.5%, significantly lower compared to an average of 57.6% amongst select global markets an indication of a need to continue enhancing our capital markets. Additionally, Sub-Saharan African countries such as South Africa and Namibia have higher mutual funds to GDP ratios coming in at 61.5% and 43.1%, respectively as at end of 2020, compared to Kenya. The chart below shows select countries’ mutual funds as a percentage of GDP:
*Data as of September 2023
Source: World Bank Data
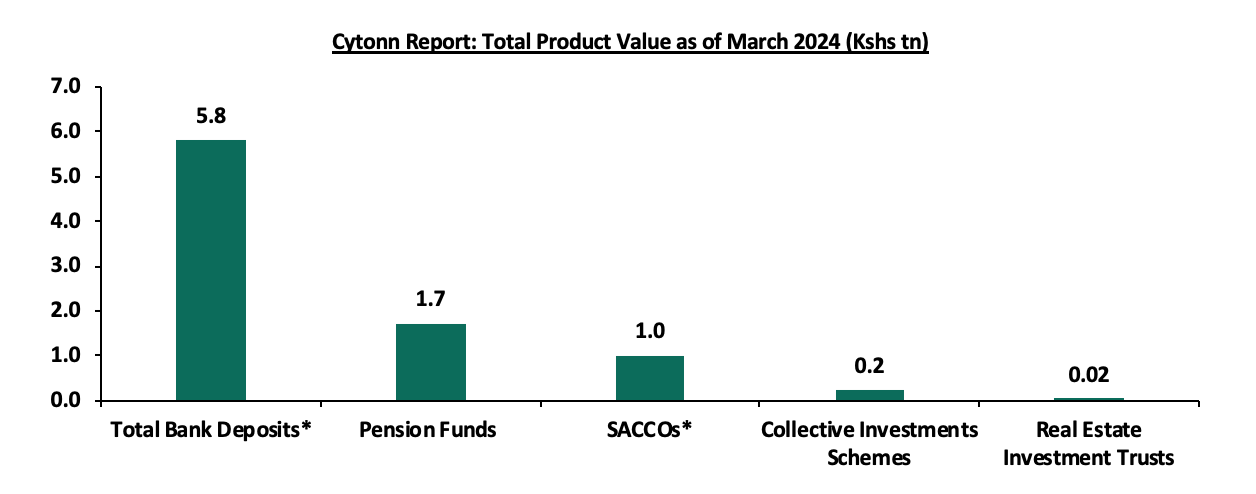
In the last five years, the Assets Under Management (AUM) of Unit Trust Funds (UTFs) have shown a remarkable performance, having grown at a 5-year CAGR of 29.9% to Kshs 225.4 bn in Q1’2024, from Kshs 60.9 bn recorded in Q1’2019. However, the industry is still dwarfed when compared to other deposit-taking institutions such as bank deposits, with the entire banking sector deposits coming in at Kshs 5.8 tn as at December 2023 from Kshs 5.5 tn recorded in September 2023. Similarly, the pension industry recorded an increase of 9.4%, to Kshs 1.7 tn as of December 2023 from Kshs 1.6 tn recorded in December 2022. Below is a graph showing the values of different saving channels and capital market products in Kenya;
*Data as of December 2023
Source: CMA, RBA, CBK, SASRA Annual Reports and REITs Financial Statements
Comparing other Capital Markets products like REITS, Kenya has made strides in the sector, however, there is still a lot of room for improvement. The REITs’ numbers remain low, with only 4 registered REITS. ILAM Fahari REIT, which was trading on the main segment of the NSE, was delisted from the platform effective 12th February 2024, and is looking to get into the Unquoted Securities Platform. The table below shows the authorized REITs in the country:
|
Cytonn Report: Authorized REITs in Kenya |
||||||
|
No |
Issuer |
Name |
Type of REIT |
Listing Date |
Market Segment |
Status |
|
1 |
ICEA Lion Asset Management (ILAM) |
Fahari |
I-REIT |
October 2015 |
Main Investment Segment |
Delisted |
|
2 |
Acorn Holdings Limited |
Acorn Student Accommodation (ASA) – Acorn ASA |
I-REIT |
February 2021 |
Unquoted Securities Platform (USP) |
Trading |
|
3 |
Acorn Holdings Limited |
Acorn Student Accommodation (ASA) – Acorn ASA |
D-REIT |
February 2021 |
Unquoted Securities Platform (USP) |
Trading |
|
4 |
Local Authorities Pension Trust (LAP Trust) |
Imara |
I-REIT |
November 2022 |
Main Investment Segment – Restricted Sub segment |
Restricted |
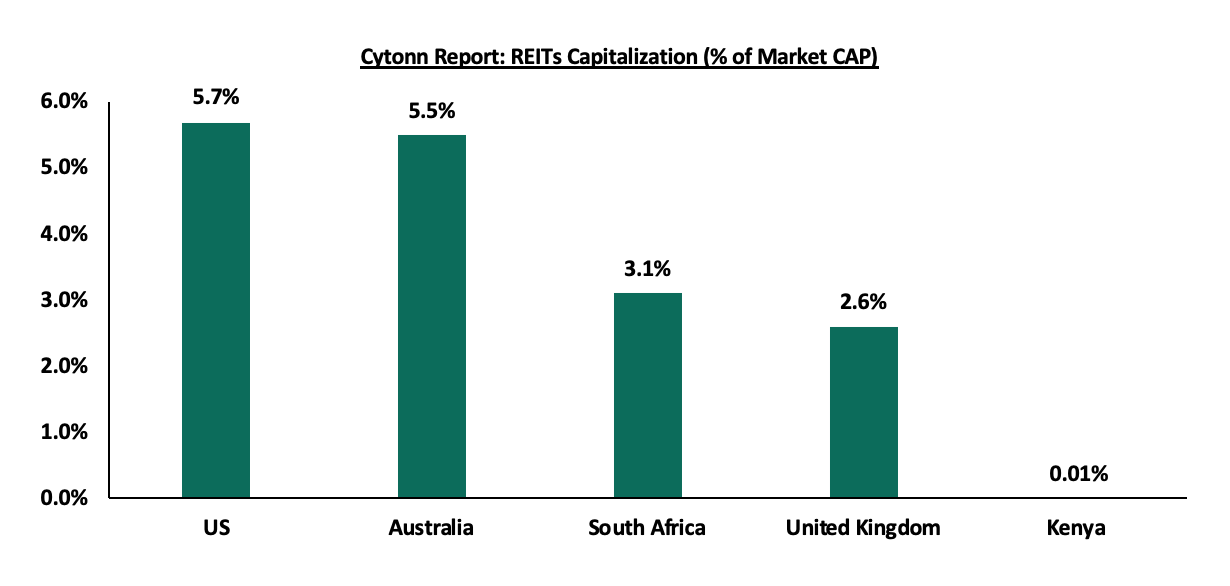
The listed REITs’ capitalization as a percentage of total market cap in Kenya stands at 0.01%, as compared to 5.7% in the USA, and 3.1% in South Africa as of May 2024. Notably, the REITS Capitalization in Kenya as a percentage of total market cap has remained relatively low at a paltry 0.01%. The decrease is due to a decline in REITS market capitalization, following the delisting of ILAM Fahari REIT earlier this year. Below is a graph showing a comparison of Kenya’s REITs to Market Cap Ratio to that of the US and South Africa:
Source: Online Research, Nairobi Securities Exchange (NSE)
*Kenya’s REIT combines both I-REITs and D-REITs
Section V: Recommendations
The number of total registered Mobile Money Accounts has been growing steadily, recording a CAGR of 9.0%, increasing from Kshs 50.4 mn at the end of Q1’2019 to Kshs 77.3 mn by the end of February 2024. Consequently, there is a pressing need to leverage innovation and digitization to drive the expansion of unit trust funds in Kenya. Utilizing technology as a distribution channel for unit trust products enables these funds to reach the retail segment, which demands convenient and innovative products. To further promote the growth of Unit Trust Funds (UTFs) in the Kenyan capital market, we advocate the following recommendations:
- Encourage innovation and diversity of UTF investments: At the end of Q1'2024, investment in the money market fund segment accounted for 65.9 % of total investments by collective investment schemes, indicating concentration risk. Notably, 47.8% of UTFs' AUM was invested in securities issued by the Kenyan government and 29.7% with Fixed Deposits with Commercial Banks, a market that competes with Unit Trust Funds for deposit mobilization. As a result, there is a need to reassess laws and encourage fund managers to diversify investments, as well as improve investment vehicle innovation,
- Provide Support to Fund Managers: We believe that the regulator, CMA, should incorporate market stabilization measures as part of the regulations/Act to assist fund managers in meeting fund responsibilities, particularly during times of distress, such as when there are a large number of withdrawals from the funds. We commend and appreciate the regulator's role in protecting investor interests. However, because fund managers play an important role in capital markets, the regulator should preserve the reputations of various fund managers in the business. This can be accomplished by partnering with industry participants to discover answers rather than openly rejecting and alienating industry players facing issues, which may not be in the best interests of investors,
- Encouraging investments in UTFs from diaspora remittances: The value of the diaspora remittances has been increasing over the years, with the remittances inflows from Kenyans living abroad recording a 24.0% y/y growth to USD 397.3 mn at the end of Q1’2024, from the USD 320.3 mn at the end of Q1’2023, yet only 8.0% of respondents in a 2021 Central Bank of Kenya survey on diaspora remittances were aware of investment opportunities in unit trusts. This therefore necessitates the need to educate the diaspora community on the benefits on unit trust funds, develop tailored investment products that cater to the needs of the diaspora community and increase partnerships with remittance services providers so as to integrate solutions where the remittances can be directly invested in the unit trust funds,
- Allow for sector funds: Under present capital markets regulations, UTFs must diversify. However, one must request specific permission in the form of sector funds such as a financial services fund, a technology fund, or a Real Estate Unit Trust Fund. Regulations permitting unit holders to invest in sector funds would go a long way towards widening the breadth of unit holders interested in participating,
- Encourage different players to enter the market to increase competition: Increased competition in capital markets will not only push Unit Trust Fund managers to provide higher returns for investors, but it will also eliminate conflicts of interest in markets and enhance the provision of innovative products and services,
- Fee optimization: Unit Trust Funds should continuously review and optimize management fees and other associated costs to ensure they are competitive while still covering operational expenses. The fee structure should be designed to align fund managers' interests with those of investors, while maintaining fairness and transparency,
- Improve fund transparency to provide more information to investors: To increase transparency for investors, each Unit Trust Fund should be required to publish their portfolio holdings on a quarterly basis and make the information available to the public. Providing more information to investors will increase accountability by enabling them to make more informed decisions, which will boost investor confidence, and,
- Allow non-financial institutions to participate as trustees and eliminate conflicts of interest in capital market governance: Capital market legislation should promote a governance structure that is more responsive to market participants and growth. In particular, confining Trustees of Unit Trust Schemes to Banks limits options, especially considering the direct competition between the banking industry and capital markets.
As Kenya's financial sector evolves, Unit Trust Funds play a critical role by offering diversity and accessibility to a wide range of investors. Emphasizing innovation, digitization, and product development in the capital markets will accelerate the growth of UTFs. Policymakers should support and enable UTF expansion and diversification to promote the overall growth of capital markets and attract new participants.
Disclaimer: The views expressed in this publication are those of the writers where particulars are not warranted. This publication is meant for general information only and is not a warranty, representation, advice or solicitation of any nature. Readers are advised in all circumstances to seek the advice of a registered investment advisor.


