Due to the unusual dominance of one counter in the NSE, this week we seek to examine the evolution of Safaricom’s share price and market capitalisation, its effect on the performance of the NSE, its performance in comparison to other listed Telcos in Sub Saharan Africa, how it is likely to affect portfolio construction decisions and conclude by drawing the key takeouts.
The Nairobi Securities Exchange (NSE), with 62 listed companies, has a total market capitalisation of USD 23.4 bn (Kshs 2.4 tn). The 62 listed companies are classified into various sectors with the Telecommunication and Technology sector being the largest by market capitalisation, and Safaricom Limited being the only listed company in the sector. The table below indicates the number of companies in each sector and their corresponding market capitalisation.
|
No. |
Sector |
No. of Companies Listed |
Market Cap. (Kshs bn) As at 15/12/2017 |
Percentage of Total Market Cap. |
|
1. |
Telecommunication and Technology |
1 |
1,061.9 |
44.0% |
|
2. |
Banking |
11 |
662.8 |
27.5% |
|
3. |
Manufacturing and Allied |
9 |
284.6 |
11.8% |
|
4. |
Insurance |
6 |
106.4 |
4.4% |
|
5. |
Energy and Petroleum |
5 |
87.5 |
3.6% |
|
6. |
Construction and Allied |
5 |
80.3 |
3.3% |
|
7. |
Commercial and Services |
10 |
66.8 |
2.8% |
|
8. |
Investment |
5 |
32.0 |
1.3% |
|
9. |
Agricultural |
6 |
16.2 |
0.7% |
|
10. |
Automobiles and Accessories |
3 |
9.5 |
0.4% |
|
11. |
Investment Services |
1 |
3.9 |
0.2% |
|
|
Total |
62 |
2,412.1 |
100.0% |
Safaricom Ltd, went public in 2008 with 40 bn issued shares priced at Kshs 5.0 per share at the time of the Initial Public Offer (IPO), effectively valuing the company at Kshs 200.0 bn. At the time of the IPO, Safaricom accounted for only 10.0% of NSE’s market capitalisation. Over the last 8-years we have seen Safaricom’s share price rally, touching a historical high of Kshs 28.5 per share on 23rd November 2017, effectively valuing the firm at Kshs 1.1 tn; at this valuation, Safaricom accounted for 48.0% of the NSE’s market capitalisation. Safaricom is currently trading at Kshs 26.8 per share, accounting for 44.0% of NSE’s market capitalization (Safaricom’s market capitalisation is Kshs 1.1 tn versus the NSE market capitalisation of Kshs 2.4 tn).
After going public in 2008, Safaricom’s share price hit a low of Kshs 2.95 per share in September 2011 following stiff price rivalry, which marked the lowest share price and market valuation since listing. In that period, the share lost 36.2% following the tough operating environment that was characterised by a high inflationary environment, high interest rates and a weakening shilling, which also affected the company’s earnings, recording an 47.4% decline in earnings, to Kshs 4.0 bn in September 2011 from Kshs 7.6 bn in September 2010. The graph below shows the evolution of Safaricom share price and market capitalisation from 2008, the year Safaricom listed, in comparison to stocks in the Banking Sector, which is the second largest sector by market capitalisation and has traditionally determined the performance of the NSE owing to its size and performance:
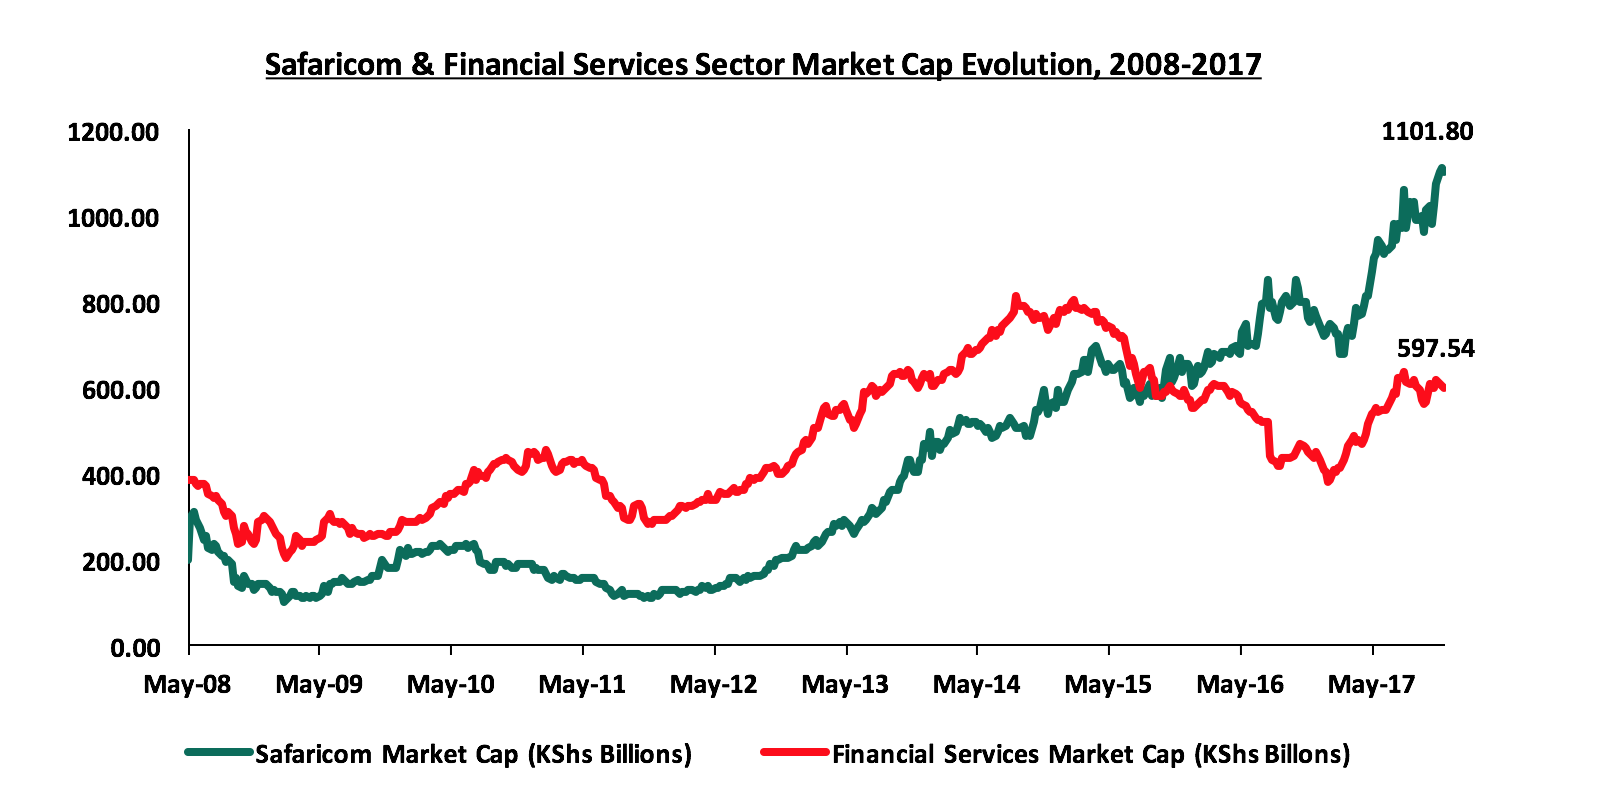
Safaricom’s market value is currently double the market value of the financial services sector
The performance of Safaricom’s stock is mainly attributed to improved investor confidence informed by:
- The growth of M-Pesa - Launched in 2007, M-Pesa is currently the second highest contributor to Safaricom’s total revenue, having contributed 26.2% of their H1’2018 revenue. The integration of M-Pesa onto most mobile banking platforms has also boosted its growth and sustainability;
- Safaricom’s diversification into data – With increased internet penetration, and with Safaricom boasting of up to 77.1% of totals mobile data subscriptions in the market, the company has been able to grow its revenues from mobile data over 5 years from 5.0% contribution to total revenue in H1’2013 to 15.3% in H1’2018;
- Earnings Performance – Over the last 5-years, Safaricom’s earnings have grown at a compounded annual growth rate of 30.9%, indicating the firm’s consistent positive performance.
Safaricom is additionally the most liquid counter at the NSE, and has dominated on both the turnover of trade and also in determining the direction of the market given its weight, liquidity and the number of free float shares. Below we show the annual market turnover for the NSE over the last 10-years compared to that of Safaricom over the same period:
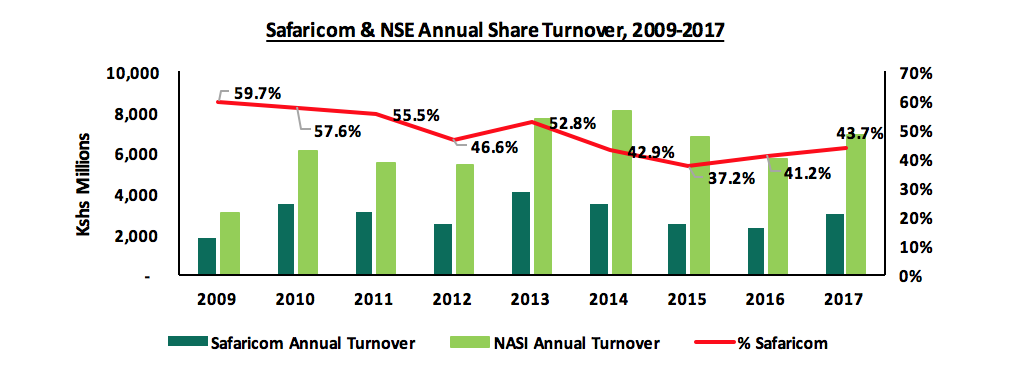
Safaricom has accounted for more than 40% of the Nairobi Stock Exchange’s annual share turnover from 2009
Safaricom’s contribution to overall market performance has been on the rise as illustrated in the charts below, compared to the banking sector, which has traditionally determined the performance of the NSE owing to its size and performance;
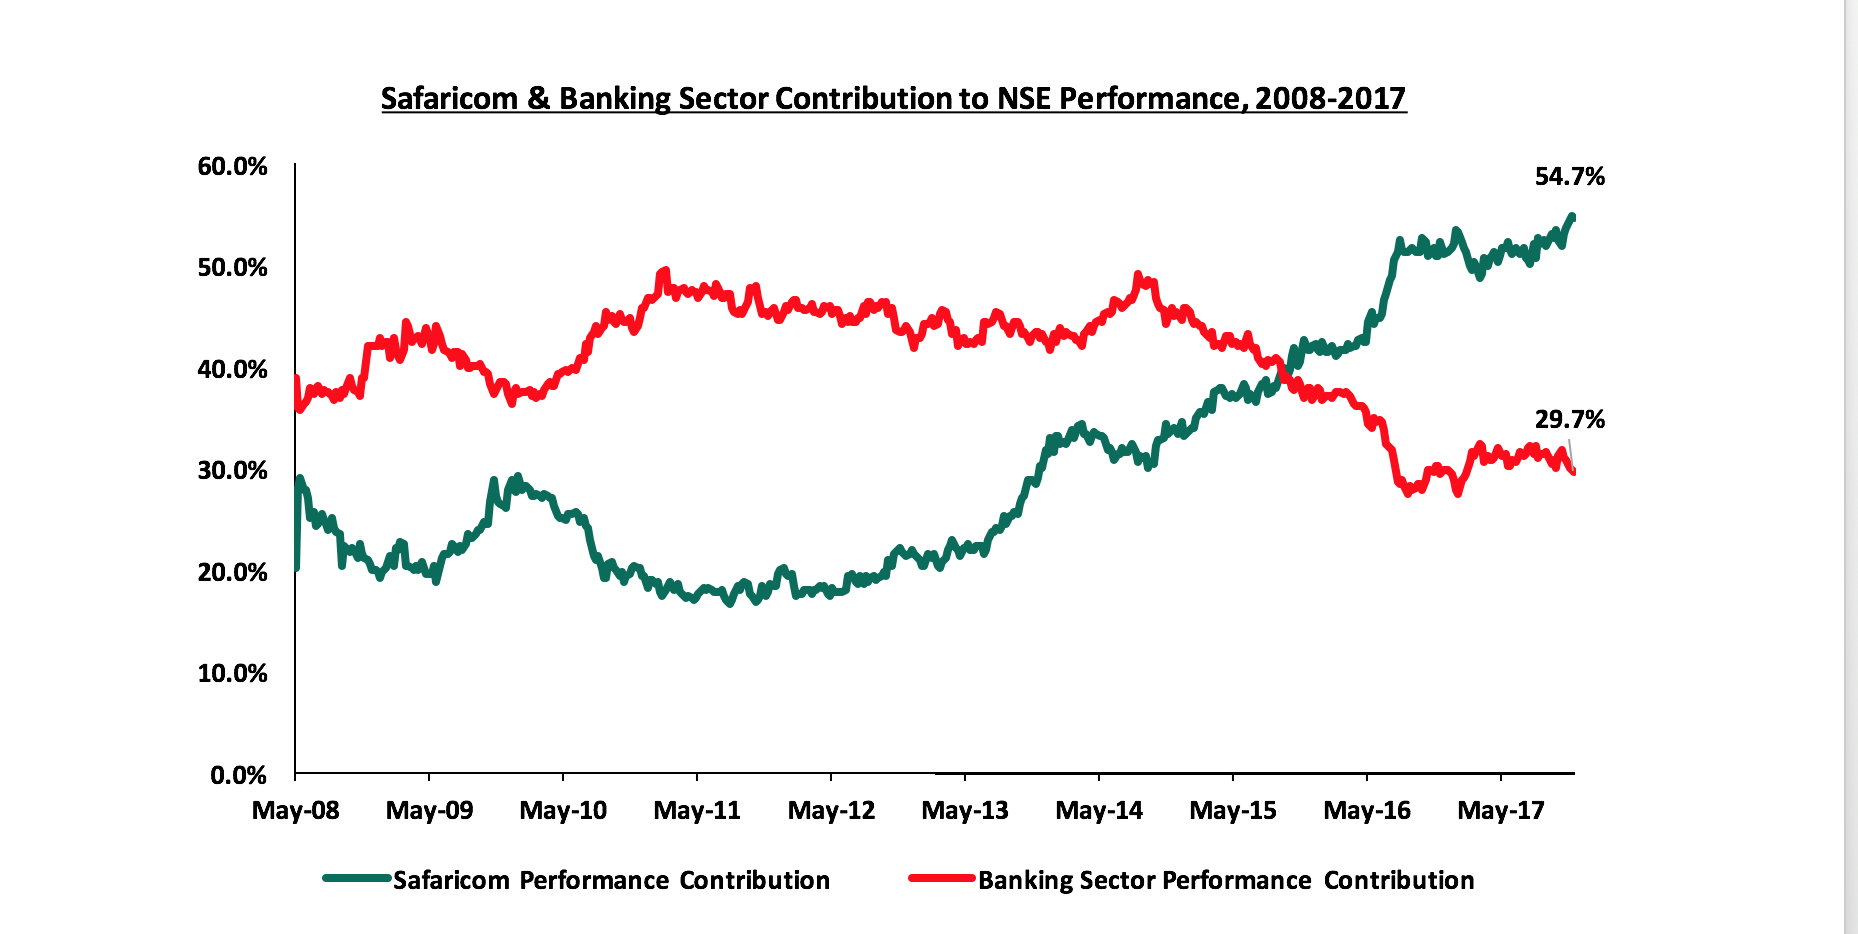
From November 2015 Safaricom overtook the Banking Sector to become the largest contributor to the performance of the Nairobi Stock Exchange
Valuation Relative to Peers and Banking industry: Having analysed the performance of Safaricom, and its contribution to the NSE, we sought to look at its valuation, how it compares to that of the banking sector in Kenya and other listed Telcos in Sub Saharan Africa. Safaricom is currently trading at a trailing P/E of 21.2x as compared to an SSA average of other listed Telcos of 19.2x. In comparison to the Kenyan banking sector, which is trading at a P/E of 8.2x, Safaricom may seem overpriced. However, the listed Telcos in SSA are also trading at a higher P/E of 19.2x compared to the SSA Banking Sector, which is trading at a P/E of 7.9x. This highlights that listed Telcos in SSA have more growth potential compared to banking stocks, hence why investors are willing to pay a premium. In our view, the pricing is mainly driven up by demand of Telcos stocks, with investors expecting future earnings growth, driven by (i) the expected growth in mobile penetration, which is currently at 43.0%, and is expected to hit 51.2% by 2020, and (ii) increased technological advancement in the financial services sector, which is highly dependent on the telco industry.
|
No. |
Telcos |
Bourse |
Current P/E |
Historical P/E |
|
1 |
Onatel |
BRVM Exchange |
37.4x |
13.4x |
|
2 |
MTN South Africa |
Johannesburg Stock Exchange |
32.4x |
17.5x |
|
3 |
Safaricom Limited | Nairobi Securities Exchange |
21.2x |
19.6x |
|
4 |
Crystal Telecom |
Rwanda Stock Exchange |
17.5x |
20.6x |
|
5 |
Airtel networks Zambia |
Zambia Stock Exchange |
17.1x |
15.7x |
|
6 |
Telkom South Africa |
Johannesburg Stock Exchange |
15.9x |
13.3x |
|
7 |
Vodacom Johannesburg |
Johannesburg Stock Exchange |
15.3x |
17.0x |
|
8 |
Sonatel |
BRVM Exchange |
9.6x |
15.9x |
|
9 |
Econet Wireless |
Zimbabwe stock exchange |
6.7x |
13.1x |
|
|
Average P/E |
19.2x |
16.2x |
|
|
|
Kenya Banking Sector |
8.2x |
|
|
|
|
SSA Banking Sector |
7.9x |
|
|
Effect on Portfolio Construction: With the stock’s performance, company size and valuation considered, we now seek to explore how these characteristics of the stock are likely to affect portfolio construction decisions. Given the contribution by Safaricom to the overall market performance, the company seems to be establishing another type of dominance, and this time not the dominance as per Communication Authority of Kenya, but in terms of determining the performance and the direction of the NSE. With the market capitalisation of about 44.0% of the market, and contributing 54.7% of the YTD performance of the NSE, Safaricom has established itself as a stock that investors cannot ignore if they want to outperform the market despite it being more expensive than banking sector stocks from a P/E perspective. This is evident from the fact that Safaricom has attracted the attention of international investors seeing as it is a top 10 constituent of the MSCI Frontier Markets Index and a major holding of 5 frontier markets ETFs and Mutual Funds, namely, (i) the iShares MSCI Frontier 100 ETF, (ii) VanEck Vectors Africa Index ETF, (iii) Guggenheim Frontier Markets ETF, (iv) Columbia Beyond BRICS ETF, and (iv) Global X Next Emerging and Frontier ETF.
In conclusion, Safaricom continues to be a key part of Kenyan equities portfolios because:
- Safaricom’s size and stability anchors the value of local equities given that it has contributed to 54.7% of the YTD performance of the NSE, and,
- Safaricom’s performance is also relatively unaffected by market performance. During periods in which investors in Kenyan banks and large cap non-financials lost value, Safaricom’s value remained steady. In the year 2017 to date for example, Safaricom shares have gained 39.7% while the Nairobi All Share Index has gained 29.1%.
However, portfolio managers should remain cautious on their allocation to Safaricom, so as to maintain diversification. Faced with the dilemma of great returns and diversification, investors in Naspers, a broad-based multinational internet and media group company listed in the Johannesburg Stock Exchange sought for a solution. Naspers accounts for 20.5% of the FTSE/JSE All Share Index, 24.5% of the Top 40 Index and 24.8% of the Shareholders Weighted Index (SWIX), which are the top 3 indices used as benchmarks for investors. To maintain diversification and address the dominance by Naspers, portfolio managers in South Africa are now shifting their benchmark to the Capped SWIX, which was introduced in November 2016. This variation rebalances every quarter to cap stocks at 10% of the index, creating less single-stock concentration. Such a variation is probably necessary for investors in Kenya’s equities market looking to safely have Safaricom on their portfolio.
Investors and portfolio managers are faced with a conundrum: on one hand, they have to continue to allocate Safaricom to their portfolios of Kenyan equities because it makes up almost half of the equities market, offers stability, and has accounted for the growth in Kenyan equities market over the past 10-years, & on the other hand, the allocation to Safaricom in line with its contribution to the NSE causes a risk, and minimises portfolio diversification. In our view, investors should be cautious of the equities market dominance by Safaricom, and in constructing a portfolio, should look for ways to discount allocation to Safaricom to something lower that the 44% it represents in the market, in order to achieve a portfolio that objectifies performance and risk diversification.


