Economic Growth
According to the World Bank’s latest African Pulse Issue, economic activity in the region is projected to have contracted by 3.3% in 2020, while the IMF, in their Regional economic outlook: Sub-Saharan Africa publication project a 3.0% contraction, from the 2.3% growth recorded in 2019. The contraction represents the first recession in Sub-Saharan Africa in 27 years, when the regional economy contracted by 0.9% in 1993 according to World Bank data. A combination of containment measures to curb the spread of the pandemic coupled with contraction in key sectors such as global trade, tourism and diaspora remittances contributed to subdued economic activity and the subsequent contraction in economic growth. The World Bank however expects the Sub-Saharan economy to pick up to a growth of 2.1% in 2021, with the IMF projecting a more optimistic recovery of 3.1%, boosted by the relaxation of containment measures, a rebounding global economy and stabilisation of commodity prices.
Currency Performance
All select currencies depreciated against the US Dollar in 2020, apart from the Ugandan Shilling, which gained by 0.4%, supported by subdued appetite for hard currency among commercial banks and importers in the manufacturing, telecommunications and energy sectors. The Zambian Kwacha was the worst performer for the third year running, depreciating by 50.4% against the dollar, attributable to low copper production, low commodity prices arising from subdued demand and high demand for hard currency from investors and the government as it seeks to meet its debt repayment obligations. The Kenya Shilling depreciated by 7.7% in 2020 to close at Kshs 109.2 against the US Dollar, compared to Kshs 101.3 recorded at the end of 2019, driven by the decline in dollar receipts from dollar-earning sectors such as tourism and horticulture in addition to high demand for hard currency from investors.
Below is a table showing the performance of select African currencies;
|
Select Sub Saharan Africa Currency Performance vs USD |
|||||
|
Currency |
Dec-18 |
Dec-19 |
Dec-20 |
2019 y/y change (%) |
2020 y/y change (%) |
|
Ugandan Shilling |
3,699.3 |
3,660.0 |
3,647.0 |
1.1% |
0.4% |
|
Tanzanian Shilling |
2,295.0 |
2,293.0 |
2,314.0 |
0.1% |
(0.9%) |
|
Botswana Pula |
10.7 |
10.6 |
10.8 |
1.3% |
(2.3%) |
|
Ghanaian Cedi |
4.8 |
5.7 |
5.8 |
(17.4%) |
(3.2%) |
|
Malawian Kwacha |
719.8 |
729.1 |
763.2 |
(1.3%) |
(4.7%) |
|
South African Rand |
14.3 |
14.0 |
14.7 |
2.5% |
(5.0%) |
|
Kenyan Shilling |
101.8 |
101.3 |
109.2 |
0.5% |
(7.7%) |
|
Mauritius Rupee |
34.2 |
36.2 |
39.6 |
(6.0%) |
(9.3%) |
|
Nigerian Naira |
307.0 |
306.0 |
380.7 |
0.3% |
(24.4%) |
|
Zambian Kwacha |
11.9 |
14.1 |
21.1 |
(18.1%) |
(50.4%) |
Source: Reuters
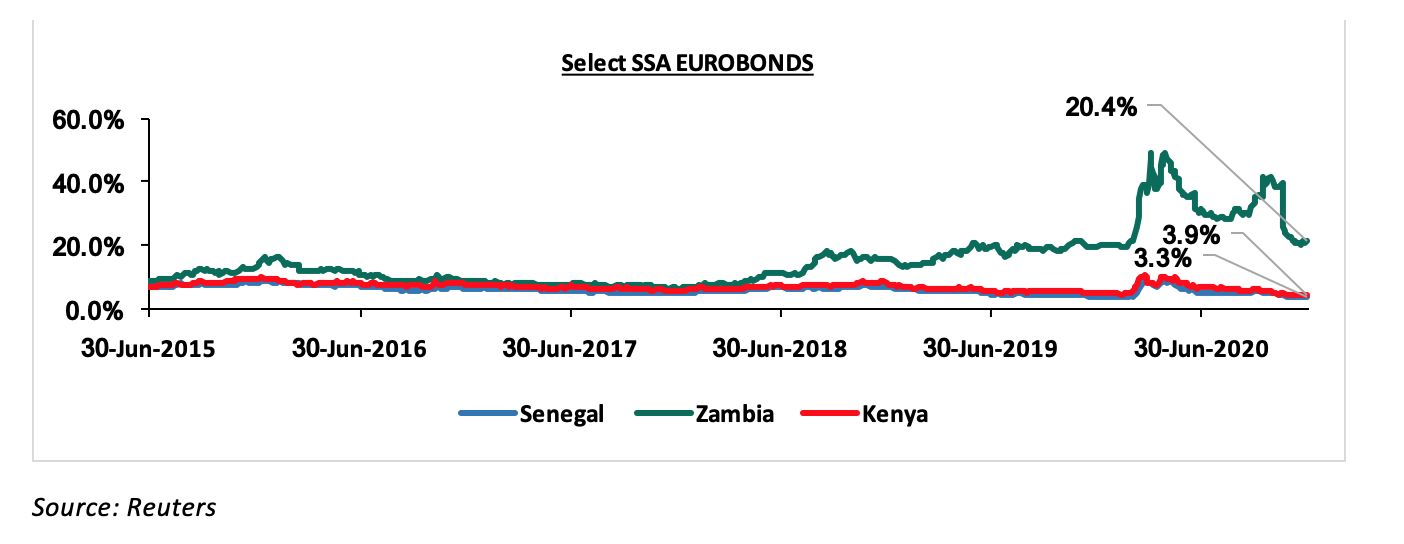
African Eurobonds
Yields on African Eurobonds generally declined in 2020, partly attributed to the global hunt for higher yields as a result of massive monetary easing in developed markets and recovering private capital inflows. Key to note is that there was a spike recorded during Q2’2020 due to the heavy outflows recorded by emerging market funds as investors dumped risky assets amid the coronavirus crisis. Yields on the Zambia Eurobond however recorded a rise during the year, attributable to the exodus of foreign investors as the country failed to honour its service obligations of a USD 42.5 mn Eurobond coupon in November. The country is struggling with high debt levels. According to the IMF’s Regional Economic Outlook: Sub-Saharan Africa, Zambia’s debt to GDP ratio is estimated at 120.0% in 2020, further confirming fears of a debt crisis in the country. The Government of Zambia’s debt was downgraded by Fitch Ratings in September 2020 to C from CC.
Below is a graph showing the Eurobond secondary market performance of select 10-year Eurobonds issued by their respective countries;
Equities Market Performance
Sub-Saharan Africa (SSA) stock markets recorded mixed performance in 2020, with Nigeria’s NGSEASI being the best performing index gaining by 20.6% driven by the accommodative monetary stance adopted by the Central Bank. Zambia’s LASIZ was the worst-performing index with losses of 39.0% due to the economic uncertainties in the country. Below is a summary of the performance of key exchanges:
|
Equities Market Performance (Dollarized*) |
||||||
|
Country |
Index |
Dec-18 |
Dec-19 |
Dec-20 |
2019 y/y change (%) |
2020 y/y change (%) |
|
Nigeria |
NGSEASI |
102.4 |
87.7 |
105.8 |
(14.3%) |
20.6% |
|
Rwanda |
RSEASI |
0.1 |
0.1 |
0.2 |
(1.4%) |
3.4% |
|
Tanzania |
DARSDSEI |
1.6 |
1.5 |
1.5 |
(7.0%) |
0.7% |
|
South Africa |
JALSH |
3,675.7 |
4,079.3 |
4,069.0 |
11.0% |
(0.3%) |
|
Kenya |
NASI |
1.4 |
1.6 |
1.4 |
19.2% |
(15.2%) |
|
Ghana |
GGSECI |
518.5 |
405.5 |
332.5 |
(21.8%) |
(18.0%) |
|
Uganda |
USEASI |
0.4 |
0.5 |
0.4 |
10.3% |
(26.8%) |
|
Zambia |
LASILZ |
440.7 |
303.3 |
185.2 |
(31.2%) |
(39.0%) |
|
*The index values are dollarized for ease of comparison |
||||||
Source: Reuters
GDP growth in Sub-Saharan Africa region is expected to recover in 2021 in line with the rest of the global economy. The region still faces key challenges among them Covid-19 and the probability that the region shall be among the last to get the vaccinations. Some of the countries are suffering from high debt levels that will make them less attractive to foreign capital. The significant weakening of the currencies has made debt service also become very expensive.


