According to the World Bank, the Sub-Saharan economy is projected to grow at a moderate rate of 3.7% in 2025, which is 0.2% points higher than the 3.5% growth recorded in 2024, and a downward revision from the January 2025 projection of 4.1%. The downward revision is mainly due to the rising trade barriers coupled with the weakened global investor confidence. The expected recovery from 2024 is primarily driven by global economic stability, and easing of monetary policy rates in the region, which is expected to boost private consumption and investment. However, most countries face the risk of increased inflation due to increased food prices resulting from drought, prompting them to increase or hold off on further easing of the rates. Nevertheless, the risk of debt distress remains high with more than half of countries facing unsustainable debt burdens. The public debt is expected to remain high due to increased debt servicing costs as a result of high interest rates in developed economies and a reduction in donor support.
Currency Performance:
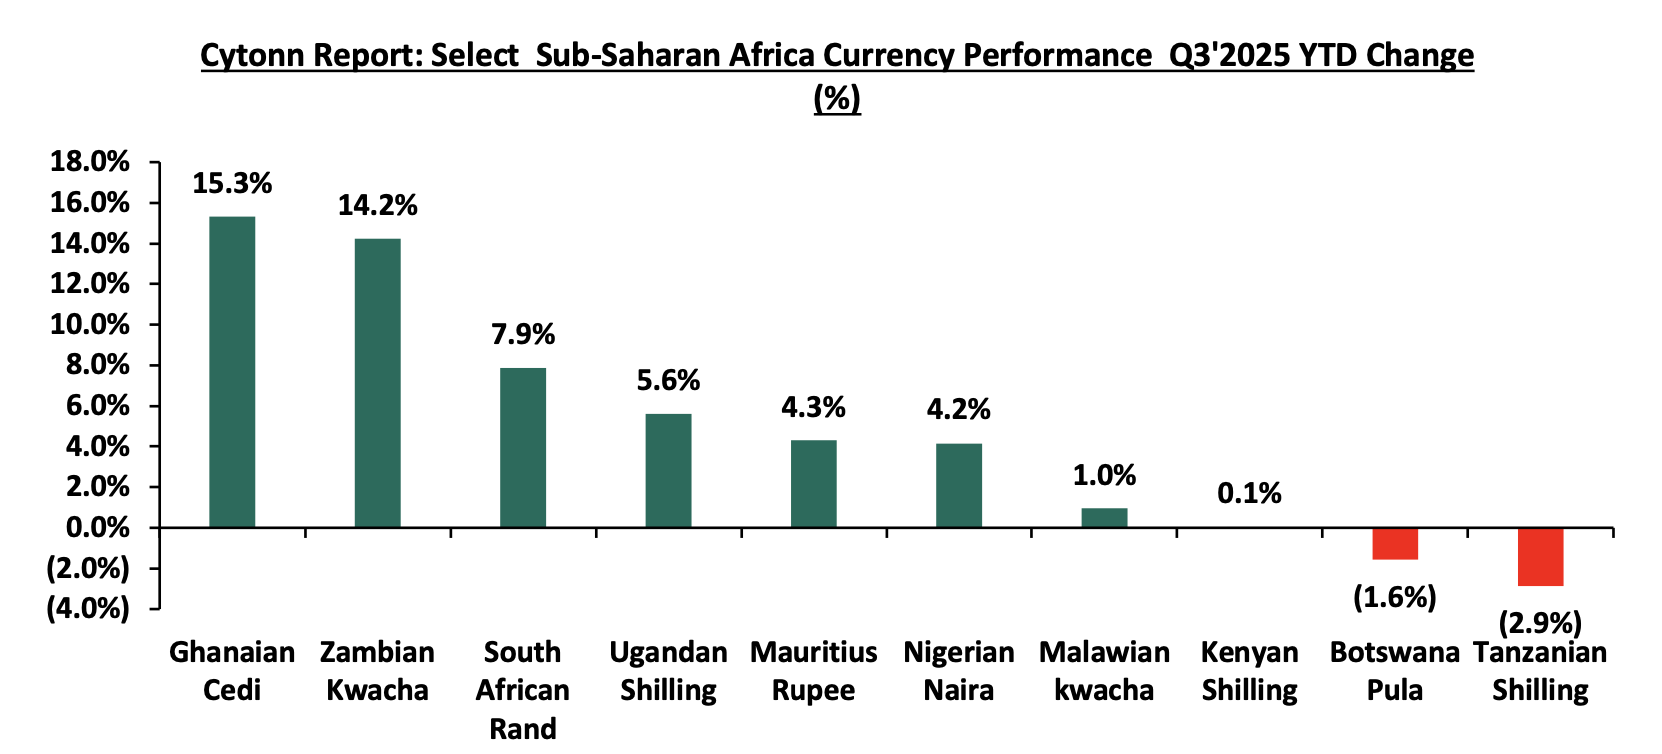
In Q3’2025, most of the select Sub-Saharan currencies appreciated against the US Dollar, primarily due to the respective central bank efforts, increased foreign currency inflows and debt-restructuring and policy reforms which have improved forex reserves. Notably, the Ghanaian Cedi emerged as the best performer among the selected currencies, appreciating by 15.3% against the USD on a year-to-date basis, closing Q3'2025 at GHS 12.5, from GHS 14.7 at the beginning of the year. The Ghanaian Cedi’s performance is majorly attributable to improved monetary policies, reduced inflation, and strong export earnings from gold and cocoa. Below is a table showing the performance of select African currencies against the US Dollar:
|
Cytonn Report: Select Sub-Saharan Africa Currency Performance vs USD |
|||||
|
Currency |
Sep-24 |
Jan-25 |
Sep-25 |
Last 12 months |
YTD change (%) |
|
Ghanaian Cedi |
15.8 |
14.7 |
12.5 |
21.2% |
15.3% |
|
Zambian Kwacha |
26.4 |
27.9 |
23.9 |
9.3% |
14.2% |
|
South African Rand |
17.3 |
18.8 |
17.3 |
(0.1%) |
7.9% |
|
Ugandan Shilling |
3768.0 |
3,697.6 |
3490.2 |
7.4% |
5.6% |
|
Mauritius Rupee |
45.9 |
47.7 |
45.66 |
0.5% |
4.3% |
|
Nigerian Naira |
1,669.0 |
1,540.7 |
1,476.62 |
11.5% |
4.2% |
|
Malawian kwacha |
1,733.7 |
1,750.3 |
1,733.7 |
0.0% |
1.0% |
|
Kenyan Shilling |
129.2 |
129.3 |
129.2404 |
(0.0%) |
0.1% |
|
Botswana Pula |
13.0 |
14.0 |
14.2 |
(8.7%) |
(1.6%) |
|
Tanzanian Shilling |
2,730.0 |
2,374.7 |
2,442.8 |
10.5% |
(2.9%) |
Source: Yahoo Finance, Central Banks
The chart below shows the year-to-date performance of different sub-Saharan African countries in Q3’2025;
Source: Yahoo Finance
Key take outs from the above table and chart include:
- The Ghanaian Cedi was the largest gainer against the USD Dollar, gaining by 15.3% year to date to close at GHS 12.5 as at the end of September from the GHS 15.8 recorded at the beginning of the year. The Cedi’s strength has been supported by several factors, including improved monetary policies, lower inflation, robust export revenues from gold and cocoa, and economic recovery that attracted global investors. and,
- The Tanzanian Shilling was the worst performing currency in Q3’2025, depreciating by 2.9%, mainly as a result of the country’s heavy dependence on imports, underperforming export sectors, and limited foreign exchange inflows to support the currency.
African Eurobonds:
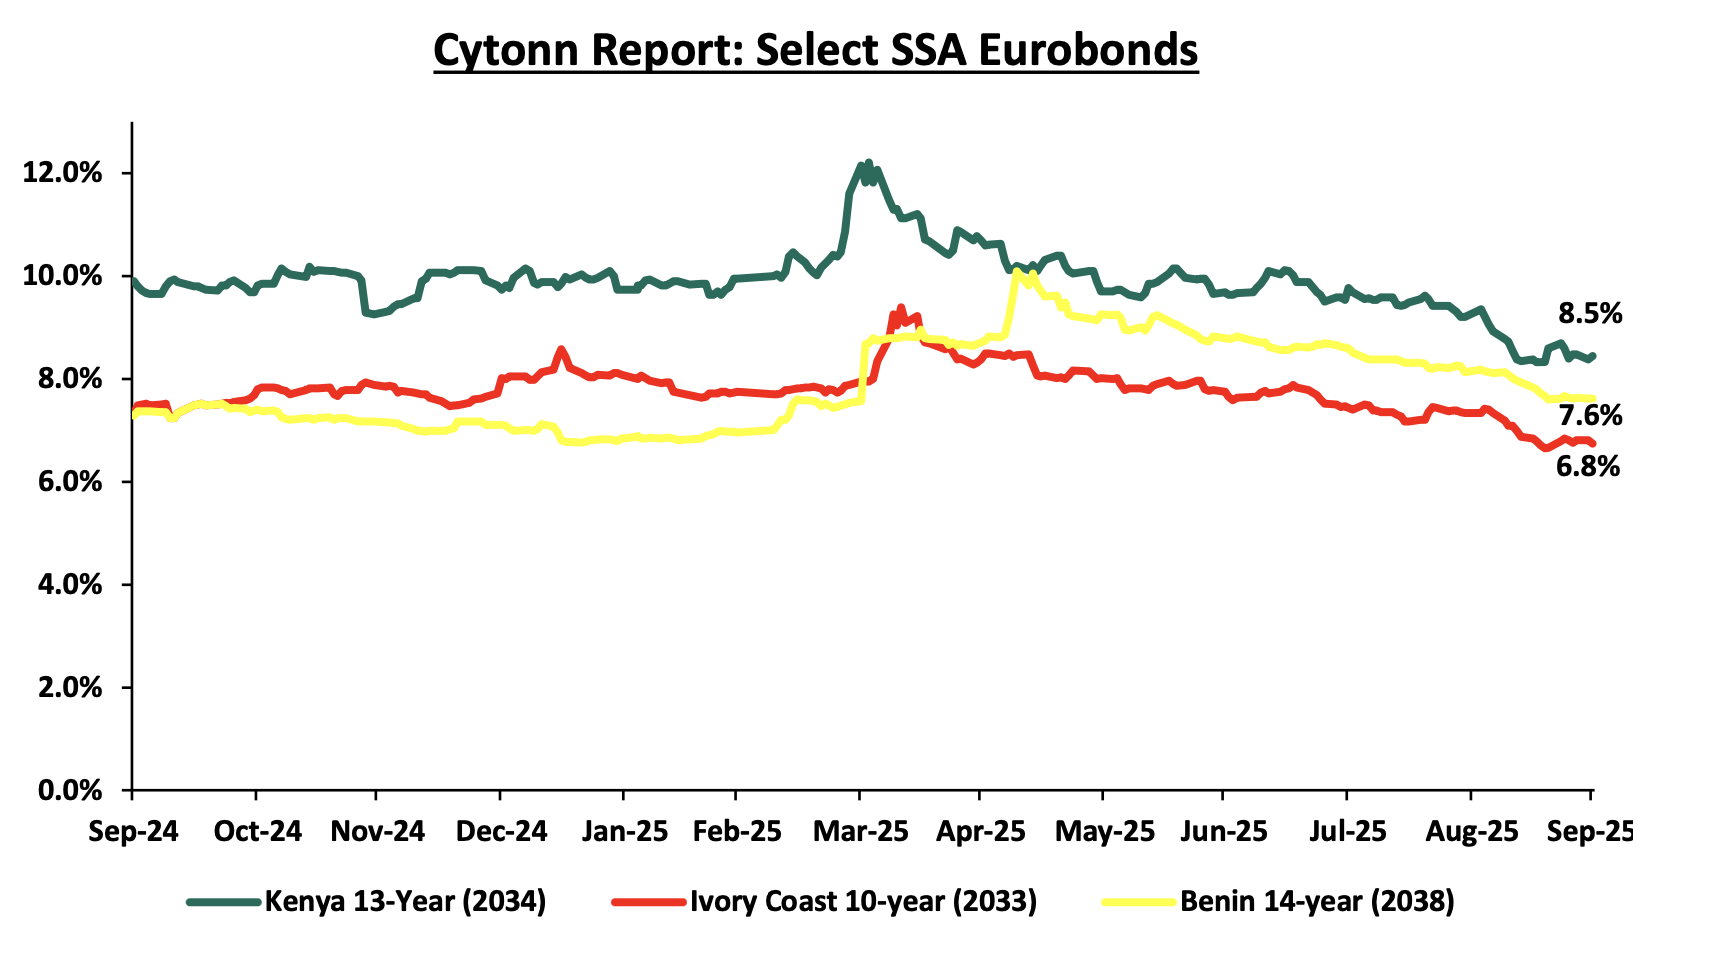
Africa’s appetite for foreign-denominated debt has increased in recent times with the latest issuers during the nine months to end of Q3’2025 being being Ivory Coast and Benin raising a total of USD 1.8 bn and USD 0.5 bn respectively in March 2025 and January 2025 respectively. Additionally, 2024 issuers were Ivory Coast, Benin, Kenya, Senegal and Cameroon raising a total of USD 2.6 bn, USD 0.8 bn, USD 1.5 bn, USD 0.8 bn and USD 0.6 bn respectively. Notably, all the bonds were oversubscribed with the high support being driven by the yield hungry investors and also the outlook of positive recovery in the regional economies. It is good to note that there was a general decline in the yields of the various bonds from most countries due to general improvement in investor sentiment as the economy recovers and the easing inflationary pressures in the region. The Yields of the Kenya’s 13-year Eurobond maturing in 2034 decreased by 1.4% points to 8.5% as at the end of September 2025 from 9.9% in September 2024. Similarly, the yields for Benin’s 14-year and Ivory Coast’s 10-year Eurobonds maturing in 2038 and 2033 respectively decreased by 0.3% points and 0.6% points to 7.6% and 6.7% respectively at the end of September 2025, down from 7.3% each in September 2024. Below is a graph showing the Eurobond secondary market performance of select Eurobonds issued by the respective countries:
Source: Bloomberg, CBK
Equities Market Performance:
Sub-Saharan Africa (SSA) stock markets were on an upward trajectory in Q3’2025, with Ghana’s stock market (GSECI) being the best performing market gaining by 96.5% YTD attributable to gains in the large-cap stocks such as MTN Ghana, Ecobank and Total Energies gaining by 48.5%, 37.9% and 34.5% respectively following improved earnings and growing investor interest in telecom stocks offering attractive dividend payouts. Below is a summary of the performance of key indices:
|
Cytonn Report: Equities Market Performance Q3'2025(Dollarized*) |
||||||
|
Country |
Index |
Sep-24 |
Jan-25 |
Sep-25 |
Last 12 months |
YTD Change |
|
Ghana |
GSECI |
277.6 |
333.8 |
656.1 |
136.3% |
96.5% |
|
Zambia |
LASILZ |
626.5 |
578.8 |
844.4 |
34.8% |
45.9% |
|
Kenya |
NASI |
0.8 |
1.0 |
1.4 |
65.0% |
43.2% |
|
South Africa |
JALSH |
5,015.1 |
4,502.1 |
6,246.1 |
24.5% |
38.7% |
|
Nigeria |
NGEASI |
59.1 |
67.5 |
96.6 |
63.7% |
43.2% |
|
Uganda |
USEASI |
0.3 |
0.3 |
0.4 |
44.9% |
33.5% |
|
Tanzania |
DARSDEI |
0.8 |
0.9 |
1.0 |
31.6% |
17.3% |
|
Rwanda |
RSEASI |
0.1 |
0.1 |
0.1 |
13.7% |
15.0% |
|
*The index values are dollarized for ease of comparison |
||||||
Source: Cytonn Research, Kwayisi, Yahoo Finance
The chart below shows the YTD Performance of the sub-Saharan Equities Market;
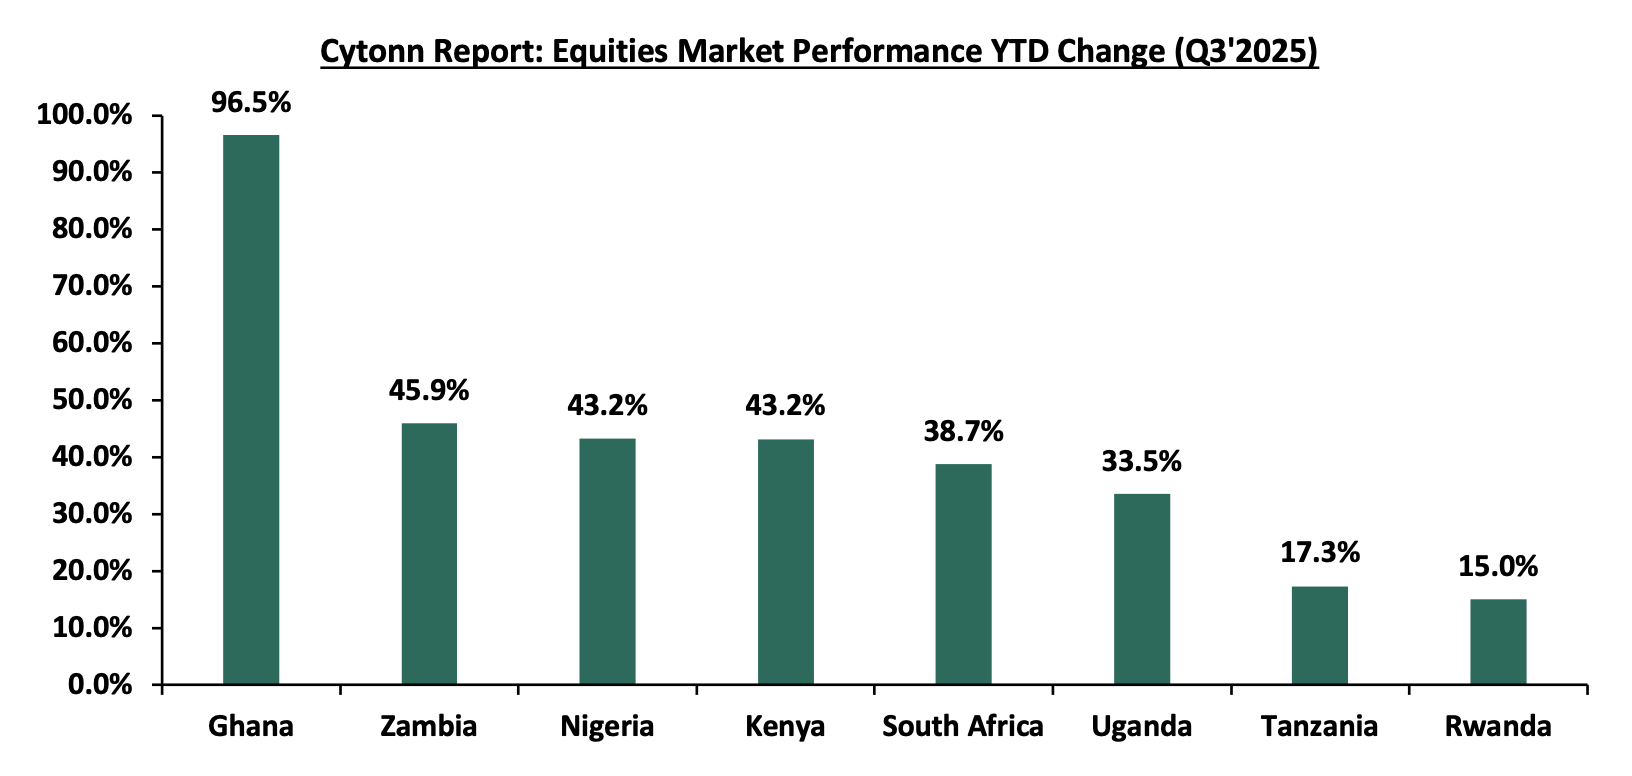
Dollarized performance
GDP growth in the Sub-Saharan Africa region is expected to improve, in contrast with the rest of the global economy. Additionally, public debt continues to be a major headwind, with high debt levels experienced in the region on the back of continued weakening of local currencies, which will make debt servicing costlier, making the region less attractive to foreign capital.


