According to the International Monetary Fund (IMF), the Sub Saharan economy is projected to grow at a rate of 3.4% in 2021, a significant improvement from the 1.8% contraction recorded in 2020. This projection comes on the back of the increased rollout of vaccines in the region which has resulted to most countries re-opening their economies. However, SSA remains prone to a third wave of the pandemic, given the resurgence in the number of infections and the rising COVID-19 death tolls in some countries.
Currency Performance
In the third quarter of 2021, we have seen most Sub-Saharan currencies depreciate against the US Dollar with Nigerian Naira being the largest loser, losing 7.7% on YTD. The Zambian kwacha registered significant recovering gaining by 20.6% compared to the 42.2% depreciation recorded in Q3’2020. The strong performance of the Kwacha is mainly attributable to the strong recovery in global copper prices which led to improved foreign exchange flows from the mining sector. The Malawian Kwacha is the largest decliner over the last twelve months, having lost 9.6%, attributable to changes in government policy including the removal of currency swap mechanisms which had previously held the Kwacha steady in times of low foreign exchange reserves. Going forward, the increase in commodity prices will see commodity driven economies perform better due to increased dollar inflows from the higher prices which will support their currencies.
Below is a table showing the performance of select African currencies:
|
Select Sub Saharan Africa Currency Performance vs USD |
|||||
|
Currency |
Sep-20 |
Dec-20 |
Sep-21 |
Last 12 Months change (%) |
YTD change (%) |
|
Zambian Kwacha |
20.0 |
21.1 |
16.7 |
16.3% |
20.6% |
|
Ugandan Shilling |
3,712.0 |
3,647.0 |
3,543.6 |
4.5% |
2.8% |
|
Tanzanian Shilling |
2,315.0 |
2,314.0 |
2,303.9 |
0.5% |
0.4% |
|
Kenyan Shilling |
108.4 |
109.2 |
110.5 |
(2.0%) |
(1.2%) |
|
South African Rand |
16.7 |
14.7 |
15.0 |
10.1% |
(2.2%) |
|
Ghanaian Cedi |
5.7 |
5.8 |
6.0 |
(6.0%) |
(4.2%) |
|
Botswana Pula |
11.7 |
10.8 |
11.3 |
3.3% |
(4.8%) |
|
Malawian Kwacha |
743.9 |
763.2 |
815.2 |
(9.6%) |
(6.8%) |
|
Mauritius Rupee |
39.7 |
39.6 |
42.4 |
(6.9%) |
(7.1%) |
|
Nigerian Naira |
380.6 |
380.7 |
410.2 |
(7.8%) |
(7.7%) |
African Eurobonds
Africa’s appetite for foreign-denominated debt has increased in recent times with the latest issuer during the third quarter of 2021 being Nigeria who raised a total of USD 4.0 bn in September after receiving bids worth USD 12.2 bn, translating to a subscription rate of 3.1x. The oversubscription is mainly driven by the yield hungry investors and also the positive outlook of Nigeria’s economic recovery.
Below is a 5 year graph showing the Eurobond secondary market performance of select 10-year Eurobonds issued by the respective countries:
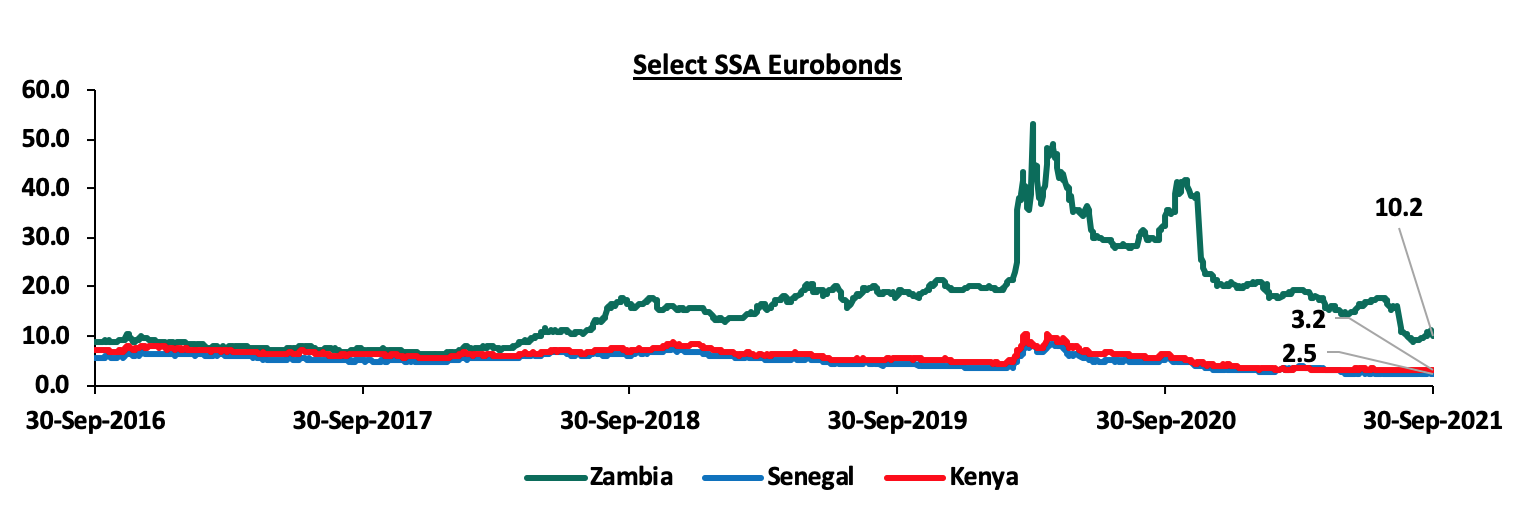
It is good to note that there was a general decline in the yields of the various bonds from different countries due to general improvement in investor sentiment as the economy recovers and the demand for commodities increase. The Zambian Eurobond registered the highest decline of 6.6%, moving from 16.8% to 10.2% as the government took measures on debt sustainability and as copper prices increased. Investor confidence was also supported by the smooth transition of power observed as the country underwent successful elections in the month of August.
Equities Market Performance
Sub-Saharan Africa (SSA) stock markets recorded mixed performance in Q3’2021, with most of the markets recording positive returns, attributable to the improved investor sentiments in the region. The Zambia Stock market (LASILZ) was the best performing index with a 59.0% YTD gain, while Nigeria’s NGSEASI was the worst-performing index with losses of 7.3% YTD. Below is a summary of the performance of key indices:
|
Equities Market Performance (Dollarized*) |
||||||
|
Country |
Index |
Sep-20 |
Dec-20 |
Sep-21 |
Last 12 Months change (%) |
YTD change (%) |
|
Zambia |
LASILZ |
190.2 |
185.2 |
294.5 |
54.8% |
59.0% |
|
Ghana |
GGSECI |
323.6 |
332.5 |
472.4 |
46.0% |
42.1% |
|
Tanzania |
DARSDEI |
0.7 |
0.7 |
0.8 |
20.8% |
27.4% |
|
Kenya |
NASI |
1.3 |
1.4 |
1.6 |
24.1% |
15.2% |
|
Uganda |
USEASI |
0.4 |
0.4 |
0.4 |
6.6% |
6.6% |
|
South Africa |
JALSH |
3,242.8 |
4,069.0 |
4,280.2 |
32.0% |
5.2% |
|
Rwanda |
RSEASI |
0.2 |
0.2 |
0.1 |
(28.1%) |
(4.2%) |
|
Nigeria |
NGSEASI |
70.5 |
105.8 |
98.1 |
39.1% |
(7.3%) |
|
*The index values are dollarized for ease of comparison |
||||||
GDP growth in Sub-Saharan Africa region is expected to recover gradually in 2021, in line with the rest of the global economy. Key risks remain tough business conditions brought about by the COVID-19 pandemic, poor infrastructure, reliance on commodity exports, political tension in some countries and debt sustainability due to the high levels of public debt in most economies in the region.


