According to the World Bank, the Sub-Saharan economy is projected to grow at a moderate rate of 3.4% in 2024, which is 0.8% higher than the 2.6% growth estimate recorded in 2023. The expected recovery is primarily driven by private consumption growth as declining inflation boosts the purchasing power of household incomes. Nevertheless, the risk of debt distress remains high with more than half of countries facing unsustainable debt burdens as the region’s public debt to GDP ratio is expected to remain high at 57.0% in 2024, albeit a decline from 60.0% in 2023. The public debt is expected to remain high due to increased debt servicing costs as a result of continued currency depreciation and increased interest rates in developed economies. Additionally, many countries are providing subsidies in order to mitigate inflationary pressures, which could worsen public finance, increase public debt, and weigh down on debt sustainability.
Currency Performance:
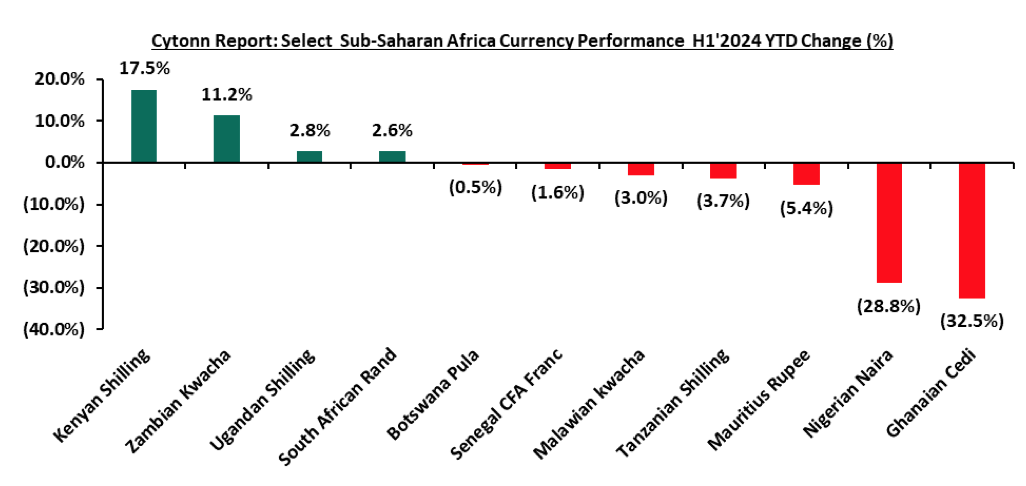
In H1’2024, most of the select Sub-Saharan currencies depreciated against the US Dollar, mainly attributable to the elevated inflationary pressures in the region, high debt servicing costs that continue to dwindle foreign exchange reserves, and monetary policy tightening by advanced economies. The high interest rates in developed countries have led to massive capital outflows as investors, both institutional and individual seek to take advantage of the higher returns offered in developed economies. Further, the elevated inflationary pressures in most economies in the region puts pressure on the value of local currencies due to expensive importation. Below is a table showing the performance of select African currencies against the US Dollar:
|
Cytonn Report: Select Sub Saharan Africa Currency Performance vs USD |
|||||
|
Currency |
Jun-23 |
Jan-24 |
Jun-24 |
2024 y/y change (%) |
YTD change (%) |
|
Ghanaian Cedi |
11.3 |
11.6 |
15.3 |
(35.1%) |
(32.5%) |
|
Malawian kwacha |
1043.0 |
1683.4 |
1734.0 |
(66.2%) |
(3.0%) |
|
Kenyan Shilling |
140.5 |
157.0 |
129.5 |
7.8% |
17.5% |
|
Botswana Pula |
13.4 |
13.5 |
13.6 |
(1.0%) |
(0.5%) |
|
Zambian Kwacha |
17.7 |
27.1 |
24.0 |
(35.6%) |
11.2% |
|
Nigerian Naira |
758.8 |
1191.9 |
1535.4 |
(102.4%) |
(28.8%) |
|
Senegal CFA Franc |
625.0 |
602.8 |
612.5 |
2.0% |
(1.6%) |
|
South African Rand |
18.8 |
18.7 |
18.2 |
3.4% |
2.6% |
|
Ugandan Shilling |
3665.0 |
3815.0 |
3710.1 |
(1.2%) |
2.8% |
|
Mauritius Rupee |
45.4 |
44.8 |
47.2 |
(4.0%) |
(5.4%) |
The chart below shows the year-to-date performance of different sub-Saharan African countries in H1’2024;
Source: Yahoo Finance
Key take outs from the above table and chart include:
- The Kenyan Shilling was the largest gainer against the USD Dollar, gaining by 17.5% year to date to close at Kshs 129.5 as at the end of June from the Kshs 157.0 recorded at the beginning of the year. The shilling was supported by the government’s Eurobond buyback in February, alleviating the debt risk on the country, increased dollar inflows into the country including the recent World Bank funding amounting USD 1.2 bn under the Development Policy Operations (DPO), partly channeled towards settling the last June 2024 Eurobond maturity payment. Notably, the Kenyan economy has continued to improve during the period under review with the Purchasing Managers Index (PMI) having crossed the 50.0 points threshold to 51.8 as of May 2024,
- The Ghanaian Cedi was the worst performing currency in H1’2024, depreciating by 32.5%, mainly as a result of the lower current account surplus due to increased import demand, a sharp decline in cocoa exports and energy sector payments, in addition to speculative activity and delays in external debt restructuring,
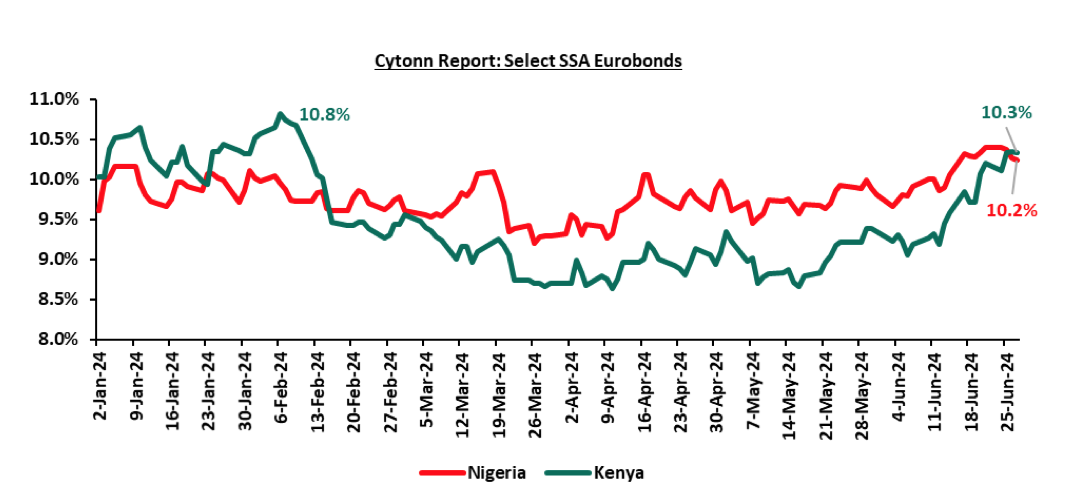
African Eurobonds:
Africa’s appetite for foreign-denominated debt has increased in recent times with the latest issuers during the first half of 2024 being Ivory Coast, Benin, and Kenya raising a total of USD 2.6 bn, USD 0.8 bn, and USD 1.4 bn respectively. Notably, all the bonds were oversubscribed with the high support being driven by the yield hungry investors and also the outlook of positive recovery in the regional economies. It is good to note that there was a general decline in the yields of the various bonds from different countries due to general improvement in investor sentiment as the economy recovers and the easing inflationary pressures in the region. The yields of the Nigeria’s 10-year Eurobond maturing in 2031 increased marginally by 0.8% points to 10.2% as at the end of June 2024 from 9.5% recorded in December 2023. Similarly, the Yields of the Kenya’s 10-year Eurobond maturing in 2028 increased by 0.5% points to 10.3% as at the end of June 2024 from 9.8% in December 2023, partly attributable to improved investor confidence following the successful buy-back of the 2024 Eurobond maturity, increased IMF Credit funding and the strengthening of the Kenyan shilling against the dollar having gained by 17.5% on a year-to-date. Below is a graph showing the Eurobond secondary market performance of select 10-year Eurobonds issued by the respective countries:
Source: Debt Management Office Nigeria, CBK
Equities Market Performance:
Sub-Saharan Africa (SSA) stock markets recorded mixed performance in H1’2024, with Kenya’s stock market (NASI) being the best performing market gaining by 44.5% YTD driven by gains in the large-cap stocks in the financial sector following improved earnings during the period as well as the improved business conditions in the country as evidenced by the Purchasing Managers Index (PMI) which came in at 51.8 as of May 2024. Nigeria’s NGSEASI was the worst performing stock market, declining by 22.1% YTD, mainly attributable to increased capital flight with investors chasing higher returns from advanced economies following hiking of interest rates as well as deterioration in investor confidence in country on the back of macroeconomic uncertainties occasioned by the high inflation at 34.0% as of May 2024 and continued weakening of the Nigerian Naira which has depreciated by 28.8% on year-to-date basis in 2024. Below is a summary of the performance of key indices:
|
Cytonn Report: SSA Equities Market Performance H1’2024 (Dollarized*) |
||||||
|
Country |
Index |
Jun-23 |
Jan-24 |
Jun-24 |
Last 12 months |
YTD Change |
|
Kenya |
NASI |
0.8 |
0.6 |
0.8 |
10.5% |
44.5% |
|
Zambia |
LASILZ |
474.4 |
455.5 |
567.7 |
19.7% |
24.6% |
|
Uganda |
USEASI |
0.3 |
0.2 |
0.3 |
0.1% |
20.5% |
|
Tanzania |
DARSDEI |
0.7 |
0.7 |
0.8 |
2.3% |
12.2% |
|
South Africa |
JALSH |
4,038.4 |
4,137.9 |
4,383.5 |
8.5% |
5.9% |
|
Rwanda |
RSEASI |
0.1 |
0.1 |
0.1 |
(9.7%) |
(3.9%) |
|
Ghana |
GSECI |
255.7 |
263.0 |
252.3 |
(1.4%) |
(4.1%) |
|
Nigeria |
NGEASI |
80.4 |
84.9 |
66.1 |
(17.7%) |
(22.1%) |
|
*The index values are dollarized for ease of comparison |
||||||
Source: Cytonn Research, Kwayisi, Yahoo Finance
The chart below shows the YTD Performance of the sub-Saharan Equities Market;
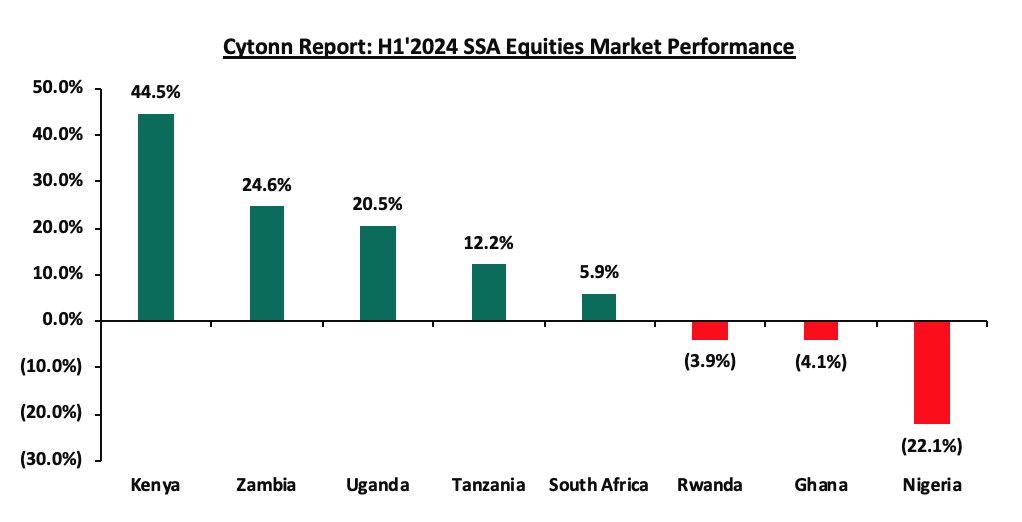
Dollarized performance
GDP growth in Sub-Saharan Africa region is expected to slow down, in line with the rest of the global economy. Additionally, public debt continues to be a major headwind, with high debt levels experienced in the region on the back of continued weakening of local currencies, which will make debt servicing costlier, making the region less attractive to foreign capital.


