Unit Trust Funds (UTFs) are Collective Investment Schemes that pool funds from different investors and are managed by professional fund managers. The fund managers invest the pooled funds in a portfolio of securities such as equity stocks, bonds or any authorized financial securities, with the aim of generating returns to meet the specific objectives of the fund. Following the release of the Capital Markets Authority (CMA) Quarterly Statistical Bulletin-Q1’2023, we analyze the performance of Unit Trust Funds for the period ending 31 December 2022, whose total Assets Under Management (AUM) have been steadily increasing, and are among the most popular investment options in the Kenyan market. We will further analyze the performance of Money Market Funds, a product under Unit Trust Funds.
In our previous focus on Unit Trust Funds, we looked at the Unit Trust Funds Performance-Q3’2022 by Fund Managers, where we highlighted that their AUM stood at Kshs 155.9 bn, a 7.0% increase from Kshs 145.8 bn recorded in Q2’2022. In this topical, we focus on the FY’2022 performance of Unit Trust Funds where we shall analyze the following:
- Performance of the Unit Trust Funds Industry,
- Spread of Investments,
- Performance of Money Market Funds,
- Comparing Unit Trust Funds AUM Growth with other Markets, and,
- Recommendations.
Section I: Performance of the Unit Trust Funds Industry
Unit Trust Funds are investment schemes that pool funds from investors and are managed by professional Fund Managers. The fund manager invests the pooled funds with the aim of generating returns in line with the specific objectives of the fund. The Unit Trust Funds earn returns in the form of dividends, interest income, rent and/or capital gains depending on the underlying security. The main types of Unit Trust Funds include:
- Money Market Funds – These are funds that invest in fixed income securities such as fixed deposits, treasury bills and bonds, commercial papers, etc. They are very liquid, have stable returns, and, they are suitable for risk averse investors,
- Equity Funds – These are funds which largely invest in listed securities and seek to offer superior returns over the medium to long-term by maximizing capital gains and dividend income. The funds invest in various sectors to reduce concentration risk and maintain some portion of the fund’s cash in liquid fixed income investments to maintain liquidity and pay investors if need be without losing value,
- Balanced Funds – These are funds whose investments are diversified across the Equities and the Fixed Income market. Balanced Funds offer investors long-term growth as well as reasonable levels of stability of income,
- Fixed Income Funds – These are funds which invest in interest-bearing securities, which include treasury bills, treasury bonds, preference shares, corporate bonds, loan stock, approved securities, notes and liquid assets consistent with the portfolio’s investment objective, and,
- Sector Specific Funds – These are funds that invest primarily in a particular sector or industry. The funds provide a greater measure of diversification within a given sector than may be otherwise possible for the other funds. They are specifically approved by the Capital Markets Authority as they are not invested as per the set rules and regulations.
As per the Capital Markets Authority (CMA) Quarterly Statistical Bulletin-Q1’2023, the industry’s overall Assets under Management (AUM) grew by 3.3% on a quarter on quarter basis to Kshs 161.0 bn as at the end of FY’2022, from Kshs 155.9 bn recorded in Q3’2022. Similarly, on a y/y basis, the total AUM increased by 19.6% to Kshs 161.0 bn, from Kshs 134.8 bn as at the end of FY’2021. Key to note, Assets under Management of the Unit Trust Funds have registered an upward trajectory over the last five years, growing at a 5-year CAGR of 23.0% to Kshs 161.0 bn in FY’2022, from Kshs 57.2 bn recorded in FY’2017. The chart below shows the growth in Unit Trust Funds’ AUM:
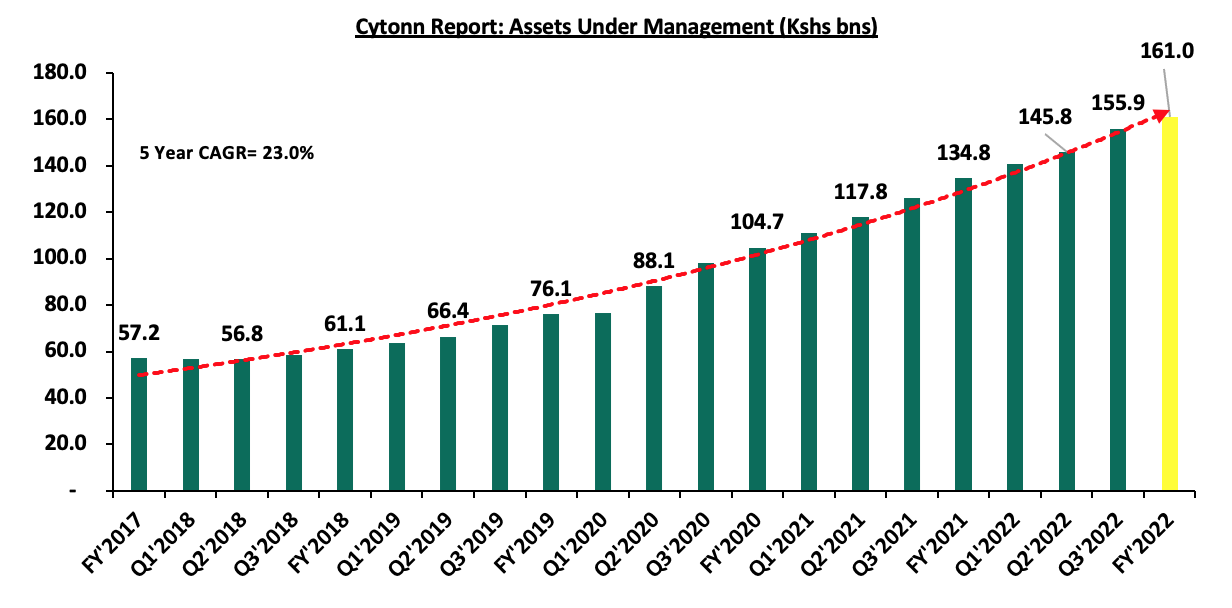
Source: Capital Markets Authority Quarterly Statistical bulletins
The growth can be largely attributed to:
- Low Investments minimums: Majority of the Unit Trust Funds Collective Investment Schemes’ (CIS) in the market require a relatively low initial investment ranging between Kshs 100.0 - Kshs 10,000.0. This has in turn made them attractive to retail and individual investors, boosting their growth,
- Increased Investor Knowledge: There has been a drive towards investor education mainly by the fund managers on the various products offered by trust funds, which has meant that more people are aware and have a deeper understanding of the investment subject. As a result, their confidence has been boosted leading to increased uptake,
- Diversified product offering: Unit Trust Funds are also advantageous in terms of providing investors with access to a wider range of investment securities through pooling of funds. This allows investors the opportunity of diversifying their portfolios which would have not been accessible if they invested on their own,
- Adoption of Fintech: Digitization and automation within the industry has enhanced ease in cash accessibility, enabling investors to immediately access their investments via M-pesa withdrawals and 3 to 5 working days if they are withdrawing to their bank accounts. According to the Central Bank of Kenya, more individuals are transacting through mobile money services as evidenced by the increase in the total number of registered mobile money accounts to 73.1 mn in December 2022, up from 37.4 mn recorded in December 2017, translating to a 5-year CAGR of 14.4%. The graph below shows the growth in the number of money market accounts in the period 2017 to 2022;
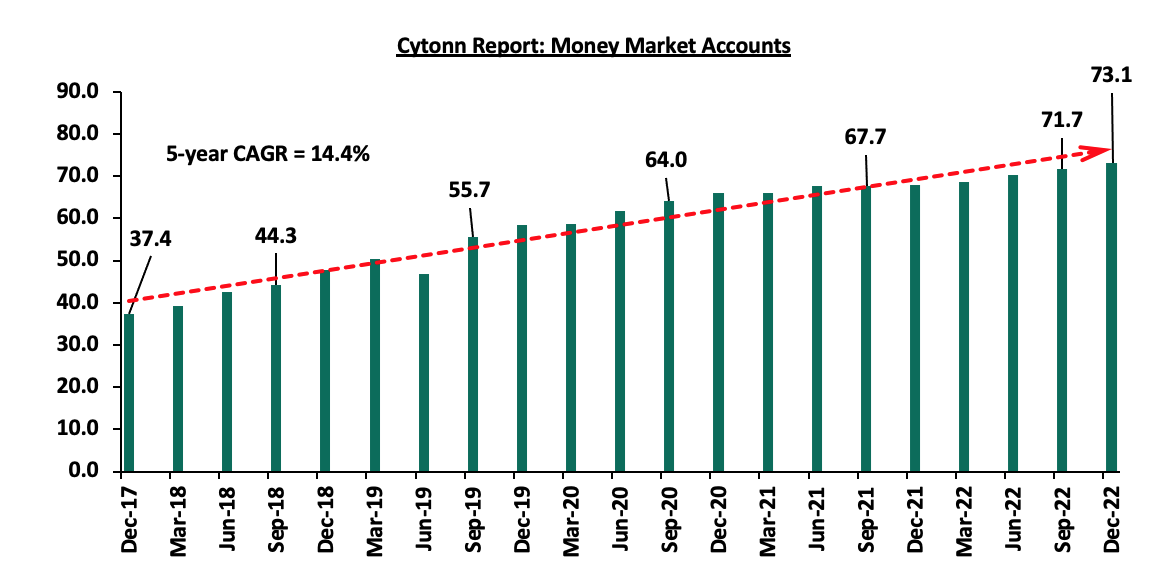
Source: CBK
Further, investors can easily track their investments based on principal invested as well as interest earned during various periods and the charges incurred via mobile apps. Some of the apps in the market include Cytonn money market App, SC Shilingi App Zimele Asset Managers App, among others, and,
- Efficiency and ease of access to cash/High Liquidity: Funds invested in UTFs are invested as portfolios with different assets and the fund managers always maintain a cash buffer. Unit trusts are highly liquid, as it is easy to sell and buy units without depending on demand and supply at the time of investment or exit.
According to the Capital Markets Authority, as at the end of FY’2022, there were 34 Collective Investment Schemes (CISs) in Kenya, up from 32 recorded at the end of Q3’2022, and a further 20.7% y/y increase from 29 recorded at the end of FY’2021. Out of the 34, 21 equivalent to 61.8% were active while 13 (38.2%) were inactive. The table below outlines the performance of the Collective Investment Schemes comparing Q3’2022 and FY’2022:
|
|
Cytonn Report: Assets Under Management (AUM) for the Approved Collective Investment Schemes |
|||||
|
No. |
Collective Investment Schemes |
Q3'2022 AUM |
Q3’2022 |
FY'2022 AUM |
FY’2022 |
AUM Growth |
|
(Kshs mns) |
Market Share |
(Kshs mns) |
Market Share |
Q3'2022 –FY'2022 |
||
|
1 |
CIC Unit Trust Scheme |
60,579.0 |
38.9% |
61,263.9 |
38.1% |
1.1% |
|
2 |
NCBA Unit Trust Scheme |
23,687.8 |
15.2% |
25,342.0 |
15.7% |
7.0% |
|
3 |
Sanlam Unit Trust Scheme |
14,542.6 |
9.3% |
15,841.6 |
9.8% |
8.9% |
|
4 |
ICEA Unit Trust Scheme |
14,939.0 |
9.6% |
14,758.9 |
9.2% |
(1.2%) |
|
5 |
British American Unit Trust Scheme |
13,439.1 |
8.6% |
13,318.0 |
8.3% |
(0.9%) |
|
6 |
Old Mutual Unit Trust Scheme |
7,363.3 |
4.7% |
7,570.5 |
4.7% |
2.8% |
|
7 |
Dry Associates Unit Trust |
3,849.3 |
2.5% |
3,881.8 |
2.4% |
0.8% |
|
8 |
Coop Unit Trust Scheme |
3,341.6 |
2.1% |
3,567.4 |
2.2% |
6.8% |
|
9 |
Nabo Capital Ltd |
3,158.7 |
2.0% |
3,291.4 |
2.0% |
4.2% |
|
10 |
Madison Asset Unit Trust Funds |
2,806.8 |
1.8% |
2,923.2 |
1.8% |
4.1% |
|
11 |
Zimele Unit Trust Scheme |
2,485.3 |
1.6% |
2,605.5 |
1.6% |
4.8% |
|
12 |
ABSA Unit Trust Scheme |
1,536.3 |
1.0% |
2,342.1 |
1.5% |
52.5% |
|
13 |
African Alliance Kenya Unit Trust Scheme |
1,476.6 |
0.9% |
1,579.3 |
1.0% |
7.0% |
|
14 |
Apollo Unit Trust Scheme |
809.5 |
0.5% |
871.1 |
0.5% |
7.6% |
|
15 |
Cytonn Unit Trust Fund |
795.7 |
0.5% |
774.5 |
0.5% |
(2.7%) |
|
16 |
Genghis Unit Trust Funds |
626.4 |
0.4% |
608.9 |
0.4% |
(2.8%) |
|
17 |
Orient Collective Investment Scheme |
247.9 |
0.2% |
248.0 |
0.2% |
0.0% |
|
18 |
Equity Investment Bank |
189.3 |
0.1% |
185.5 |
0.1% |
(2.0%) |
|
19 |
Amana Unit Trust Funds |
27.8 |
0.0% |
27.8 |
0.0% |
0.3% |
|
20 |
GenAfrica Unit Trust Scheme |
0 |
0.0% |
2.9 |
0.0% |
0.0% |
|
21 |
Wanafunzi |
0.7 |
0.0% |
0.7 |
0.0% |
2.6% |
|
22 |
Genghis Specialized Funds |
- |
- |
- |
- |
- |
|
23 |
Standard Investments Bank |
- |
- |
- |
- |
- |
|
24 |
Diaspora Unit Trust Scheme |
- |
- |
- |
- |
- |
|
25 |
Dyer and Blair Unit Trust Scheme |
- |
- |
- |
- |
- |
|
26 |
Jaza Unit Trust Fund |
- |
- |
- |
- |
- |
|
27 |
Masaru Unit Trust Fund |
- |
- |
- |
- |
- |
|
28 |
Adam Unit Trust Fund |
- |
- |
- |
- |
- |
|
29 |
First Ethical Opportunities Fund |
- |
- |
- |
- |
- |
|
30 |
Natbank Unit Trust Scheme |
- |
- |
- |
- |
- |
|
31 |
Amaka Unit Trust (Umbrella) Scheme |
- |
- |
- |
- |
- |
|
32 |
Mali Money Market Fund |
- |
- |
- |
- |
- |
|
33 |
Jubilee Unit Trust Scheme |
- |
- |
- |
- |
- |
|
34 |
Enwealth Capital Unit Trust |
- |
- |
- |
- |
- |
|
Total |
155,902.6 |
100.0% |
161,004.8 |
100.0% |
3.3% |
|
Source: Capital Markets Authority: Quarterly Statistical Bulletin, Q1’2023, and Collective Investments Scheme December 2022
Key take outs from the above table include:
- Assets Under Management: CIC Unit Trust Scheme remained the largest overall Unit Trust Fund, with an AUM of Kshs 61.3 bn in FY’2022, from an AUM of Kshs 60.6 bn in Q3’2022, translating to a 1.1% AUM growth, albeit a lower growth rate from 6.0% AUM growth recorded in Q3’2022,
- Growth: In terms of AUM growth, Absa Unit Trust recorded the highest growth for the fourth consecutive quarter, with its AUM increasing to Kshs 2.3 bn, from Kshs 1.5 bn in Q3’2022, equivalent to a 52.5% AUM growth. On the other hand, Genghis Unit Trust Fund recorded the largest decline with its AUM declining by 2.8% to Kshs 0.61 bn in FY’2022, from Kshs 0.63 bn in Q3’2022,
- Market Share: CIC Unit Trust Scheme remained the largest overall Unit Trust with a market share of 38.1%, a 0.8% points decline from 38.9% achieved in Q3’2022. The decline in market share is an indication of increasing competition as new collective schemes enter the market,
- New Collective Investment Schemes: GenAfrica Unit Trust Scheme, with AUM of Kshs 2.9 mn became an active collective investment scheme in the capital market at the end of FY’2022, increasing the number of active collective schemes to 21. Additionally, Kuza money market fund began its operation in December posting its first daily yield on 23 December 2022,
- 13 UTFs remained inactive at the end of FY’2022: Natbank Unit Trust Scheme, First Ethical Opportunities Fund, Adam Unit Trust Fund, Masaru Unit Trust Fund, Jaza Unit Trust Fund, Dyer and Blair Unit Trust Scheme, Diaspora Unit Trust Scheme, Standard Investments Bank, Genghis Specialized Fund, Jubilee Unit Trust, Enwealth Capital Trust, Amaka Unit Trust and Mali Money Market Fund remained inactive as at the end of FY’2022,
Section II: Spread of Investments
Money Market Funds (MMFs) have continued to gain popularity in Kenya with MMFs accounting for Kshs 123.8 bn out of the Kshs 161.0 bn managed by Collective Investments Schemes as at end of FY’2022, equivalent to 76.9%, which is the largest share of investments allocation by the Collective Investment Schemes. Further, this translates to a 2.0% y/y increase from Kshs 121.4 bn recorded as at end of FY’2021. The popularity of MMFs is driven by the ease in investing in terms of time and requirements, as it does not involve opening of a Central Depository System (CDS) account, coupled with the higher returns they offer compared to the returns on bank deposits and treasury bills. The table below shows investment allocations of the different funds comparing FY’2021and FY’2022:
|
Cytonn Report: Investment Allocation in Different Funds (Kshs bn) |
||||||
|
Item |
Dec-21 |
FY'2021 Investment Share |
Sep-22 |
Q3'2022 Investment Share |
Dec-22 |
FY’2022 Investment Share |
|
Money Market Funds |
121.4 |
90.2% |
121.3 |
77.8% |
123.8 |
76.9% |
|
Fixed Income Funds |
3.7 |
2.8% |
21.2 |
13.6% |
22.7 |
14.1% |
|
Equity Funds |
3.5 |
2.6% |
3.0 |
1.9% |
2.9 |
1.8% |
|
Other funds |
6.1 |
4.5% |
10.4 |
6.7% |
11.6 |
7.2% |
|
Total |
134.7 |
100.0% |
155.9 |
100.0% |
161.0 |
100.0% |
Source: CMA
Key take outs from the table above include:
- Money Market Funds: MMFs have the largest investment allocation, coming in at 76.9% at the end of FY’2022, an indication of its preference by majority of investors due to its ease of investing and high liquidity, coupled with high returns. The fund is also a good safe haven for investors who wish to switch from a higher risk portfolio to a low risk portfolio, especially in times of uncertainty. Notably, despite the large market share, the investment allocation is a decline from 77.8% and 90.2% allocations in Q3’2022 and FY’2021, respectively, highlighting the gaining competition from other funds especially the Fixed Income Fund,
- Fixed Income Funds recorded tremendous growth in 2022 to Kshs 22.7 bn in FY’2022, up from Kshs 3.7 bn in FY’2021. Similarly, on a q/q basis, Fixed Income allocation increased by 7.1% to Kshs 22.7 bn, from Kshs 21.2 bn. The growth is largely attributed to higher yields, following the upward readjustment of the yield curve, with investors demanding a higher premium to compensate for the perceived risks on the Kenyan economy, following the elevated inflationary pressures, currency depreciation, and the growing concerns surrounding the government’s ability to pay its debt obligations, and,
- Equity Funds continued on the downward trajectory, with investment allocation in equities recording a 14.7% decline to Kshs 2.9 bn as at end of FY’2022, from Kshs 3.5 bn as at end of FY’2021. The decline in equity fund’s portfolio holdings is attributable to the downward movements in the Equities market, with the Nairobi All Share Index (NASI) registering a 23.7% loss as at the end of FY’2022, a complete reversal from the 5.5% gain recorded in FY’2021. The loss is mainly attributable to increased selloffs in the Nairobi Securities Exchange, underpinned by capital outflows by foreign investors to developed economies.
In terms of UTFs’ distribution of investments by asset classes, government securities segment had the largest share of investments, with Kshs 73.4 bn out of the total 164.0 bn, translating to 45.5% of investments allocation. Similarly, investments in Fixed Deposits had Kshs 69.3 bn (43.0%) in a similar period. Key to note, the concentration of investments in the fixed income assets highlights the lack of diversification of investments and the overreliance on one investment asset class. The table below shows the distribution of investments into various asset classes:
|
Cytonn Report: Distribution of Investments in terms of Asset Classes (Kshs bn) |
|||||||
|
Asset Class |
Dec-21 |
FY’2021(%) |
Sep-22 |
Q3’2022 (%) |
Dec-22 |
FY’2022(%) |
y/y Change |
|
Government securities |
59.7 |
44.1% |
74.9 |
46.5% |
73.4 |
45.6% |
1.5% |
|
Fixed Deposit |
60.4 |
44.7% |
63.4 |
39.4% |
69.3 |
43.0% |
(1.7%) |
|
Cash and Demand Deposits |
3.6 |
2.7% |
5.6 |
3.4% |
5.6 |
3.5% |
0.8% |
|
Nairobi Stock Exchange (NSE) Listed Securities |
6.0 |
4.5% |
5.2 |
3.2% |
5.1 |
3.1% |
(1.4%) |
|
Other securities not listed at the NSE |
3.4 |
2.5% |
4.3 |
2.7% |
4.8 |
3.0% |
0.5% |
|
Other collective investments schemes |
0.8 |
0.6% |
1.2 |
0.7% |
1.5 |
1.5% |
0.9% |
|
Off-shore investments |
0.6 |
0.5% |
0.7 |
0.4% |
0.9 |
0.5% |
0.0% |
|
Immovable property |
0.6 |
0.5% |
0.5 |
0.3% |
0.5 |
0.3% |
(0.2%) |
|
Total |
135.3 |
100.0% |
155.6 |
100.0% |
161.0 |
100.0% |
0.6% |
Source: CMA
Section III: Performance of Money Market Funds
According to the Central Bank of Kenya Q4’2022 economic review, the average deposit rate increased by 40.0 bps to 7.2% in Q4’2022, from 6.8% recorded in Q3’2022. Despite the increase, the average deposit rate continues to offer the lowest returns in comparison to investing in either government securities focusing on the 91-day T-bill, or the money market funds.
During the period under review, the average deposit rate offered lower yields, with the average deposit rate for the month of December 2022 coming in at 7.2%, compared to December’s average MMF yield of 9.1%. The 91-day T-bill offered a higher return of 9.3%, with the continued increase in returns occasioned by continuous upward readjustment in the yield curve as investors demand higher compensation for the perceived risks in the country driven by high inflation and currency depreciation. The graph below shows the performance of the Money Market Fund to other short-term financial instruments:
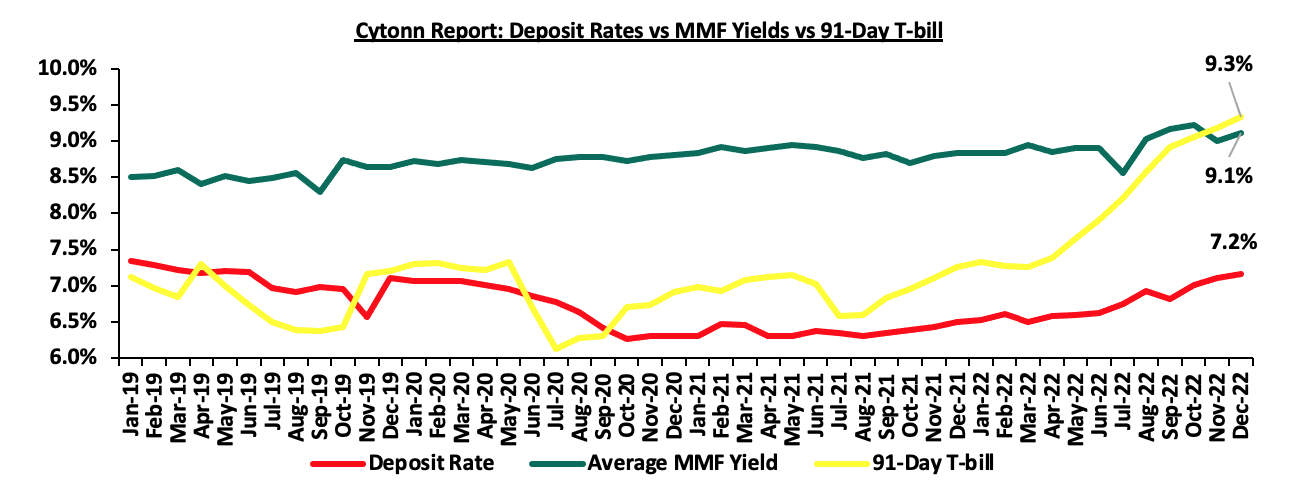
Source: Central Bank of Kenya, Cytonn Research
As per the regulations, funds in MMFs should be invested in short-term liquid interest-bearing securities with an average tenor to maturity of 18 months or less. The short-term securities include bank deposits, fixed income securities listed on the Nairobi Securities Exchange (NSE) and securities issued by the Government of Kenya. As a result, the Money Market funds are best suited for investors who require a low-risk investment that offers capital stability, liquidity, but with a high-income yield. The fund is also a good safe haven for investors who wish to switch from a higher risk portfolio to a low risk portfolio, especially in times of uncertainty.
Top Five Money Market Funds by Yields
During the period under review, the following Money Market Funds had the highest average effective annual yield declared, with the Cytonn Money Market Fund having the highest effective annual yield at 10.7% against the industry Q4’2022 average of 8.5%.
|
Cytonn Report: Top 5 Money Market Fund Yield in Q4’2022 |
||
|
Rank |
Money Market Fund |
Effective Annual Rate (Average Q4'2022) |
|
1 |
Cytonn Money Market Fund |
10.7% |
|
2 |
Zimele Money Market Fund |
9.9% |
|
3 |
GenCap Hela Imara Money Market Fund |
9.8% |
|
4 |
NCBA Money Market Fund |
9.6% |
|
5 |
Sanlam Money Market Fund |
9.5% |
|
Average of Top 5 Money Market Funds |
9.9% |
|
|
Industry average |
8.5% |
|
Source: Cytonn Research
Section IV: Comparison between Unit Trust Funds AUM Growth and other Markets
Unit Trust Funds’ assets recorded a Year on Year growth of 19.6% in FY’2022, compared to a 14.8% growth recorded by listed banks cumulative deposits over the same period. For the Unit Trust Funds, the growth of 19.6% was a decline, from 28.6% growth recorded in FY’2021. On the other hand, listed banks deposits, recorded an increase of 2.6% points to 14.8%, from the 12.2% growth recorded in FY’2021. The chart below highlights the year-on-year AUM growths for Unit Trust Funds AUM vs Listed banks deposits since 2017;
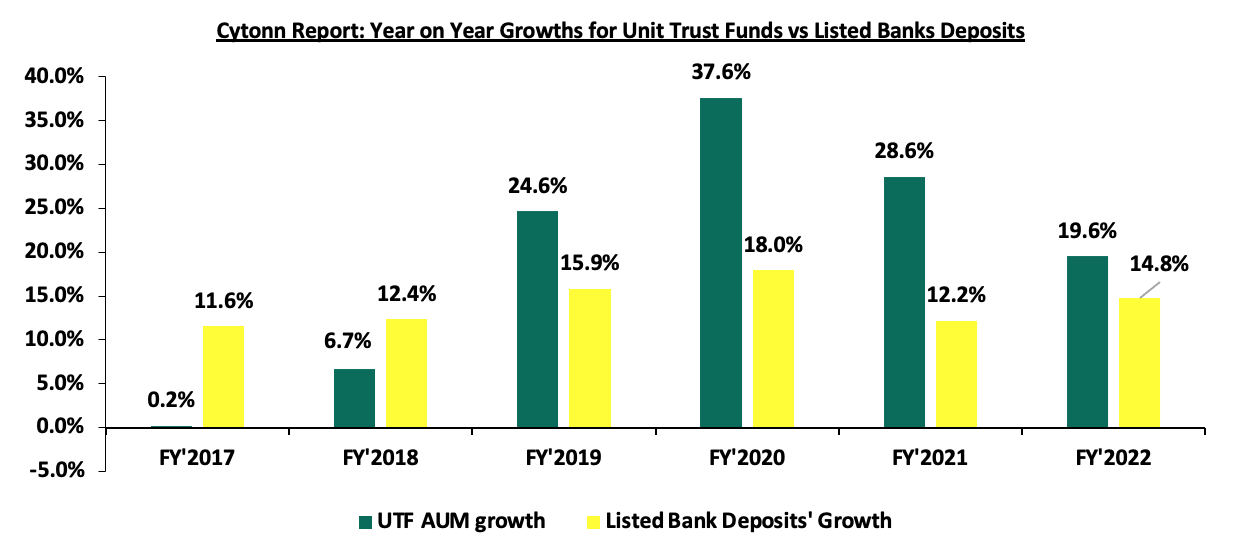
Source: Cytonn Research
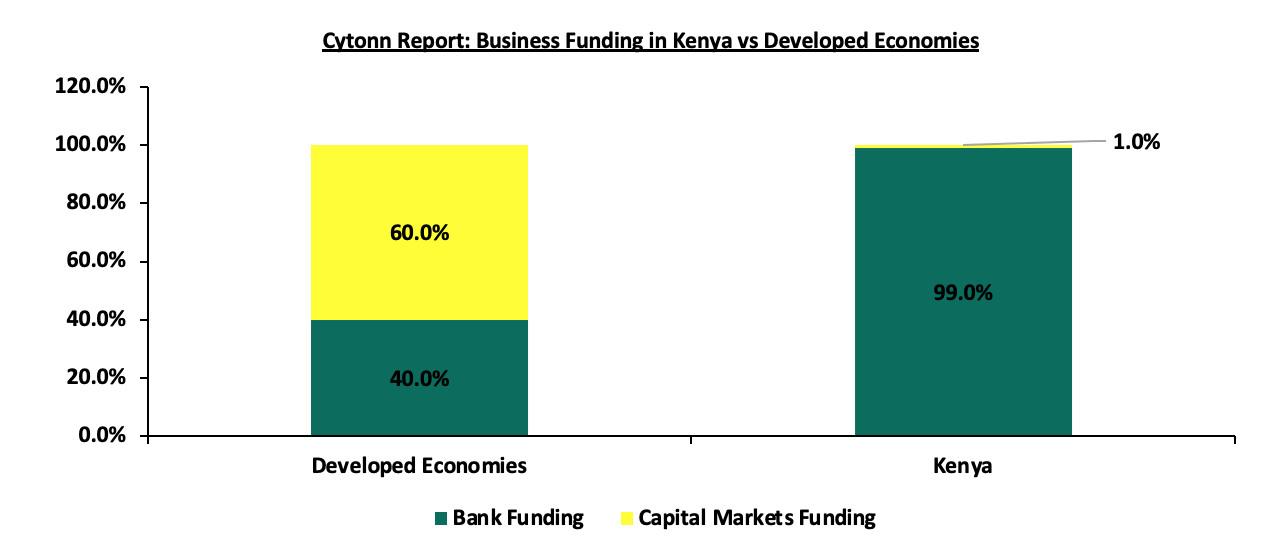
The UTFs are gaining popularity as seen by a higher growth rate, however we note that Kenya’s capital market remains stunted, driven by overreliance on the banking sector for funding. According to the World Bank data, in developed economies, businesses rely on bank funding for 40.0% of the funding; with the larger percentage of funding at 60.0% coming from the Capital markets. However, closer home, the World Bank noted that businesses in Kenya relied on banks for 99.0% of their funding while less than 1.0% comes from the capital markets, an indication of constraints in our capital markets.
Source: World Bank
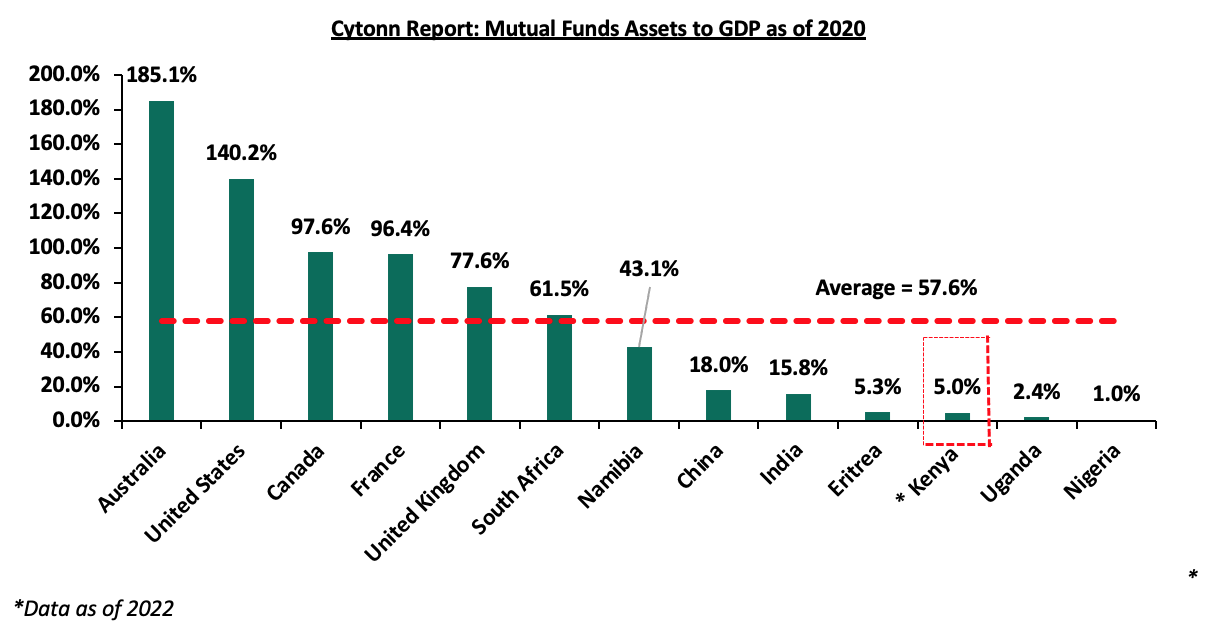
Notably, Kenya’s Mutual Funds/UTFs to GDP ratio at the end of FY’2022 came in at 5.0%, an increase from the 1.1% recorded as at end of Q3’2022, but significantly lower compared to an average of 57.6% amongst select global markets. Additionally, Sub-Saharan African countries such as South Africa and Namibia have higher mutual funds to GDP ratios of 61.5% and 43.1%, respectively as at end of 2020, compared to Kenya’s 5.0% depicting that the Kenya’s UTF industry suffers from low penetration rate, driven by an underdeveloped capital market. As such, we still have room to improve and enhance our capital markets. The chart below shows some countries’ mutual funds as a percentage of GDP:
Source: World Bank Data
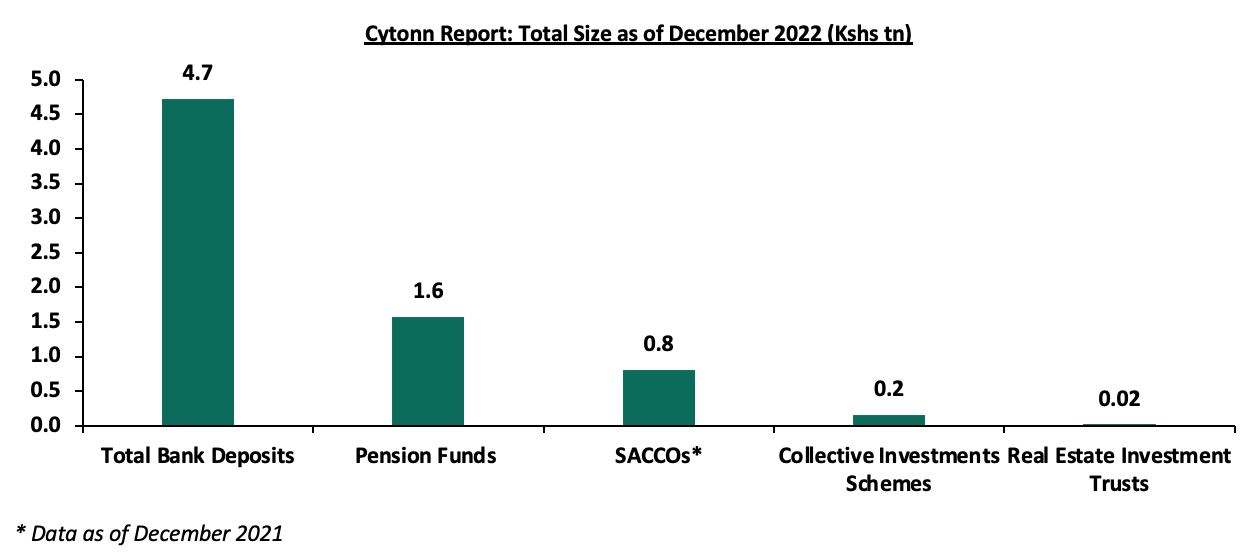
Over the past 5 years, Unit Trust Funds (UTFs) AUM has exhibited positive performance, with the Unit Trust Funds AUM having grown at a 5-year CAGR of 23.0% to Kshs 161.0 bn in FY’2022, from Kshs 57.2 bn recorded in FY’2017. However, the industry is still overshadowed by other asset gatherers such as bank deposits with the entire banking sector deposit coming in at Kshs 4.7 tn and the pension industry at Kshs 1.8 tn as of December 2022. Below is a graph showing the sizes of different saving channels and capital market products in Kenya as at December 2022;
Source: CMA, RBA, CBK, SASRA Annual Reports and REITs Financial Statements
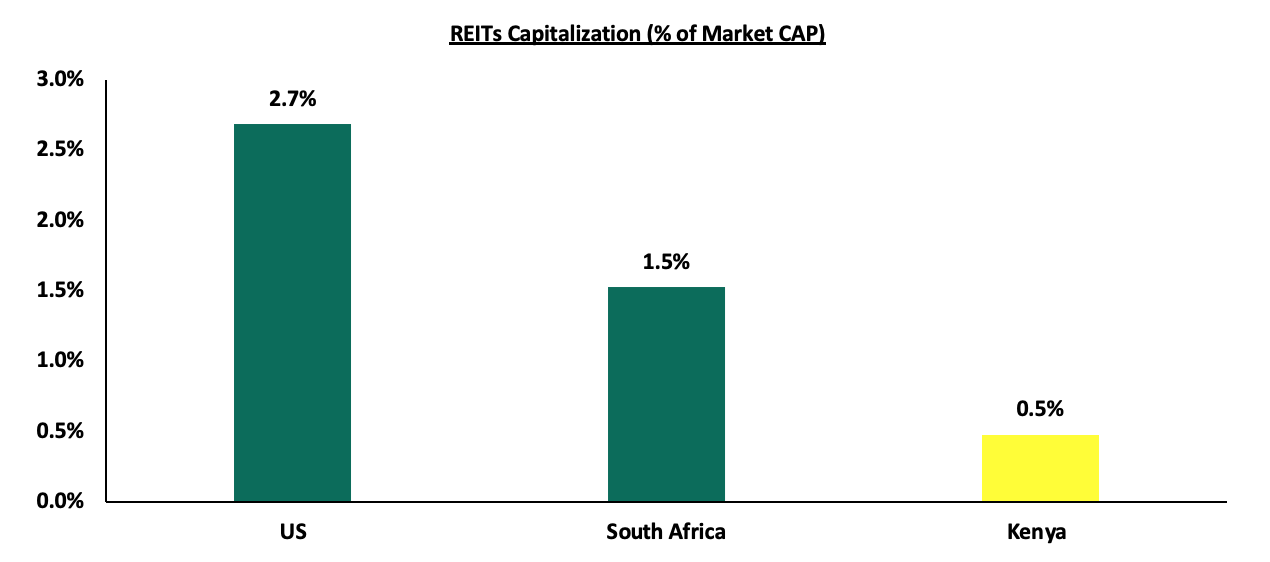
Comparing other Capital Markets products like REITS, Kenya has made strides in the sector, evidenced by the increase in REITS to market capitalization ratio to 0.5% in FY’2022, from a paltry 0.1% in FY’2021, however, there is still a lot of room for improvement. The listed REITs capitalization as a percentage of total market cap in Kenya stands at 0.5%, as compared to 2.7% in the United States (US) and 1.5% in South Africa, as of 28 April 2023. Notably, the increase is due to a decline in the total market capitalization that has adversely affected Nairobi Stock Exchange, with NASI registering 15.5% YTD decline, attributable to increased sell offs by institutional investors. Below is a graph showing comparison of Kenya’s REITs to Market Cap Ratio to that of US and South Africa:
Source: Online research, Nairobi Securities Exchange (NSE)
Section V: Recommendations
In conclusion, as witnessed by the penetration of Money Market Fund apps resulting in MMFs leading among unit trust products, there is still need to leverage more on innovation and digitization in order to further propel the growth of unit trust products in Kenya. This is further emphasized by the launch of the HISA app in Kenya, enabling retail investors to trade in Kenyan stocks, as well as, the US REITs and mutual funds, and effortlessly set up and open Central Depository and Settlement Corporation (CDSC) accounts via the application. In addition, we recommend the following actions that can be taken to stimulate growth of UTFs in the Kenyan capital market;
- Lower the minimum investment amounts: Currently, the minimum investment for sector specific funds is Kshs 1.0 mn, while that for Development REITS is currently at Kshs 5.0 mn. According to the Kenya National Bureau of Statistics, 42.2% of employees in the formal sector earn a monthly median gross income of Kshs 50,000.0 or less and another 45.5% earn a gross income range of Kshs 50,000.0 to Kshs 100,000.0, resulting in 87.7% of employees earning below Kshs 100,000.0 monthly. As such, the high minimum initial and top up investments amounts for investing in sector specific funds deter potential investors. Furthermore, these high amounts disadvantage the majority of retail investors by restricting their options for investments,
- Encourage innovation and diversification of UTFs’ investments: Majority of UTFs’ investments are either in fixed income or fixed deposits, highlighting high concentration risks. There is need to encourage fund managers to invest in different sectors of the economy as this will spur diversification of investments, as seen in the US UTF industry, as well as enhance innovation of other investment vehicles, and,
- Update regulations: The current Collective Investments Schemes Regulations in Kenya were formulated in 2001 and have not been updated since, despite the dynamic nature of the capital markets worldwide. This has led to the regulations lagging behind. For instance, the regulations do not include provisions for private offers that have grown in importance over the years. The regulations also lack stipulated guidelines on special funds to cater for the sophisticated investors’ interest in regulated alternative investments products. While there are efforts to update the regulations, we note that they remain in progress and are yet to be completed,
- Allow for sector funds: Under the current capital markets regulations, UTFs are required to diversify. However, one has to seek special dispensation in the form of sector funds such as a financial services fund, a technology fund or a Real Estate Unit Trust Fund. Regulations allowing unit holders to invest in sector funds would go a long way in expanding the scope of unit holders interested in investing,
- Eliminate conflicts of interest in the capital markets governance and allow non-financial institutions to also serve as Trustees: The capital markets regulations should foster a governance structure that is more responsive to both market participants and market growth. In particular, restricting Trustees of Unit Trust Schemes to Banks only limits options, especially given the direct competition between the banking industry and capital markets, and,
- Provide Support to Fund Managers: In our opinion, the regulator, CMA needs to include market stabilization tools as part of the regulations/Act that will help Fund Managers meet fund obligations especially during times of distress like when there are a lot of withdrawals from the funds. This can be done by collaborating with industry players to find solutions rather than publicly shunning and alienating industry players facing challenges as this may not be in the best interest of investors. We commend and appreciate the regulator’s role in safeguarding investor interests. However, since Fund Managers also play a significant role in the capital markets, the regulator should also protect the reputation of different fund managers in the industry.
Key to note, the Capital Markets Authority (CMA) publicized the Draft Capital Markets (Licensing Requirements) Regulations 2023 meant to replace the Capital Markets (Licensing)(General)Regulations, 2002, which have been in effect since 19 July 2002, with the aim of revising the fees in the capital markets operations for various industry players. The key takeout from the new draft regulations include; increase application fees for investment bank to Kshs 20,000.0 and that of other firms to Kshs 10, 000.0, from the initial fees of Kshs 2,500.0. The license fee for the fund managers registered with Retirement Benefits Authority is also set to increase to Kshs 100,000.0 from Kshs 50,000.0, while the renewal fees was maintained at Kshs 50,000.0. Additionally, the authority introduced a new category in the market, a brokerage dealer, creating room for any firm to either be a broker, or a dealer, or combine both in offering brokerage and dealership services.
Despite the growth of Unit Trust Fund penetration in Kenya, the industry still has potential to grow through the introduction of different innovative products, promotion of sector specific REITs as is the norm in the US with over 172 REITs, pushing the level of innovation higher as the REITs compete for the limited market within the U.S economy. Additionally, we note that the updated draft regulations set to increase fees in the UTF industry could be more of a disincentive to majority of the industry players. Therefore, we maintain that to spur more growth the Capital Markets Authority needs to relax its regulations to support capital markets growth.
Disclaimer: The views expressed in this publication are those of the writers where particulars are not warranted. This publication, which is in compliance with Section 2 of the Capital Markets Authority Act Cap 485A, is meant for general information only and is not a warranty, representation, advice or solicitation of any nature. Readers are advised in all circumstances to seek the advice of a registered investment advisor.


