Unit Trust Funds, “UTFs”, are collective investment schemes that pool money together from many investors and are managed by professional Fund Managers, who invest the pooled funds in a portfolio of securities to achieve objectives of the trust. Following the release of Unit Trust Fund Managers’ results for Q2’2020, we examine the performance of Unit Trust Funds, as they are among the most popular investment options in the Kenyan market. We will further analyze the performance of Money Market Funds, a product under Unit Trust Funds, currently the most popular in terms of Assets Under Management, with 89.6% of the UTF market as at Q2’2020. In our previous focus on Unit Trust Funds, we looked at the Q1’2020 Performance by Unit Trust Fund Managers. In this topical, we focus on the Q2’2020 performance by Unit Trust Fund Managers, where we shall analyze the following:
- Performance of the Unit Trust Funds Industry,
- Performance of Money Market Funds,
- Comparing Unit Trust Funds AUM Growth with Bank Deposits Growth, and,
- Conclusion
Section I: Performance of the Unit Trust Funds Industry
As defined above, Unit Trust Funds are essentially investment schemes that pool money from investors and are managed by a professional Fund Manager. The fund manager invests the pooled funds in line with the portfolio’s objectives. The funds in the unit trust earn returns in the form of dividends, interest income, and/or capital gains depending on the asset class the funds are invested in. The main types of Unit Trust Funds include;
- Money Market Fund – This fund invests in short-term debt securities with high credit quality such as treasury bills and commercial paper. The fund offers high-income yield, liquidity as well as capital stability. Risk adverse investors are prone to invest in Money Market Funds in times of high stock market volatility;
- Equity Fund – This fund aims to offer superior returns over the medium to longer-term by maximizing capital gains and dividend income through investing in listed equity securities. To maintain liquidity, the fund reduces its high exposure in the equities market through diversifying its portfolio of shares in various sectors;
- Balanced Fund – These are funds in which the investments are diversified across the Equities and the fixed income market. The fund offers its investors with long-term growth as well as reasonable levels of income;
- Fixed Income Fund – This fund invests in interest-bearing securities, which include treasury bills, treasury bonds, preference shares, corporate bonds, loan stock, approved securities, notes and liquid assets consistent with the portfolio’s investment objective; and,
- Sector Funds – These are funds that invest primarily in a particular sector or industry. The funds provide a greater measure of diversification within a given sector than may be otherwise possible.
In line with Capital Market Regulations (2002) Part IV (32), Unit Trust Funds Managers released their Q2’2020 results. As per the Capital Markets Authority CMA Quarterly Statistical Bulletin - Q3 2020, the industry’s overall Assets Under Management (AUM) grew by 15.1% to Kshs 88.1 bn as at the end of Q2’2020, from Kshs 76.5 bn as at the end of Q1’2020. In the last three-years, Assets Under Management of the Unit Trust Funds have grown at a CAGR of 16.6% to Kshs 88.1 bn in Q2’2020 from Kshs 55.5 bn recorded in Q2’2017.
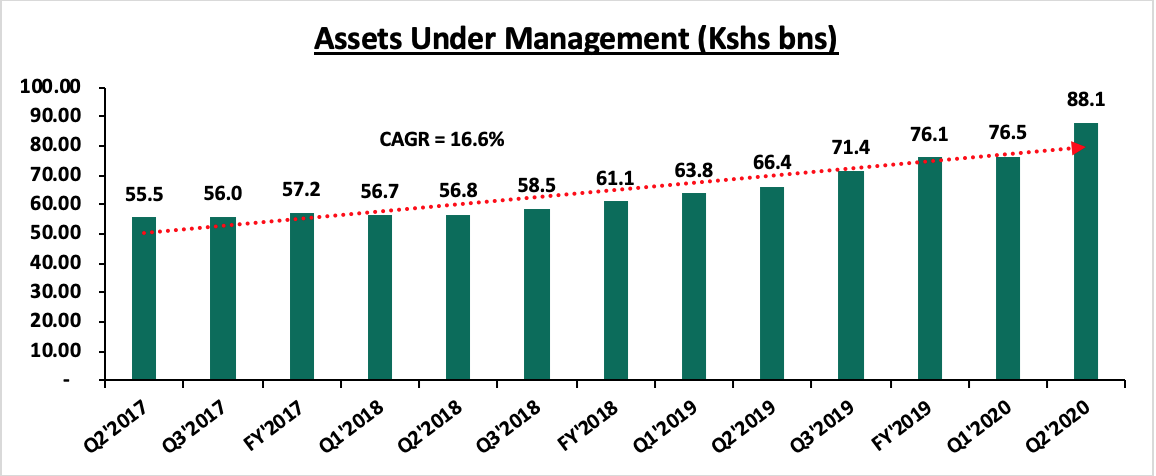
Source: CMA
This growth can be largely attributable to:
- Affordability to Retail Investors: Unit Trust Funds have become more accessible to retail investors, with a majority of the Collective Investment Schemes’ (CIS) in the market requiring an initial investment ranging between Kshs 100.0 - Kshs 10,000.0,
- Diversification: Unit Trust Funds are also advantageous in terms of offering investors the opportunity of diversifying their portfolios by providing them with access to a wider range of investment securities even with limited capital, which would have not been accessible if they invested on their own,
- Liquidity: Compared to other investment options such as equities, unit trusts are liquid, as it is easy to sell and buy units without depending on supply and demand at the time of investment or exit. Furthermore, the advent of digitization and automation within the industry has enhanced liquidity enabling an investor to receive their funds within 3 to 5 working days if they are withdrawing to their bank accounts, and immediate access to funds when withdrawing via M-Pesa, and,
- Emergence of Fintech: The financial services industry in the country is seeing its traditional model disrupted by technology and regulations; from March when the pandemic hit, many individuals and businesses have been forced to resort to technological avenues to curb the spread of the virus as they enforce social distancing. The reception of mobile money technology has increased financial inclusion, providing financial services to the ‘unbanked’, and as such, investing and divesting has been made easy for investors. Additionally, Fintech Inclusion has increased the efficiency of processing both payments and investments for fund managers.
According to the Capital Markets Authority, as at the end of Q2’2020 there were 23 approved collective investment schemes made up of 93 funds in Kenya. Out of the 23 however, only 19 were currently active while 4 were inactive. During the period under review, total Assets under Management grew by 15.1% to Kshs 88.1 bn in Q2’2020, from Kshs 76.5 bn as at Q1’2020. The table below outlines the performance of Fund Managers of Unit Trust Funds in terms of Assets under Management:
|
Assets Under Management (AUM) for the Approved and Active Collective Investment Schemes |
||||||
|
No. |
Fund Managers |
Q1’2020 AUM (Kshs mns) |
Q1’2020 Market Share |
Q2’2020 AUM (Kshs mns) |
Q2’2020 Market Share |
AUM Growth Q1’2020 – Q2’2020 |
|
1 |
CIC Asset Managers |
29,784.6 |
38.9% |
36,313.7 |
41.2% |
21.9% |
|
2 |
BRITAM |
10,004.4 |
13.1% |
10,444.7 |
11.9% |
4.4% |
|
3 |
ICEA Lion |
8,040.9 |
10.5% |
9,801.9 |
11.1% |
21.9% |
|
4 |
Commercial Bank of Africa |
7,724.8 |
10.1% |
9,263.0 |
10.5% |
19.9% |
|
5 |
Old Mutual |
6,133.1 |
8.0% |
6,129.0 |
7.0% |
(0.1%) |
|
6 |
Sanlam Investments |
3,320.2 |
4.3% |
4,328.5 |
4.9% |
30.4% |
|
7 |
African Alliance Kenya |
1,883.4 |
2.5% |
1,907.4 |
2.2% |
1.3% |
|
8 |
Stanlib Kenya |
1,419.5 |
1.9% |
- |
0.0% |
(100.0%) |
|
9 |
Dry Associates |
1,781.4 |
2.3% |
1,947.9 |
2.2% |
9.3% |
|
10 |
Madison Asset Managers |
1,372.0 |
1.8% |
1,481.0 |
1.7% |
7.9% |
|
11 |
Nabo Capital (Centum) |
1,106.4 |
1.4% |
1,284.4 |
1.5% |
16.1% |
|
12 |
Zimele Asset Managers |
1,102.3 |
1.4% |
1,206.2 |
1.4% |
9.4% |
|
13 |
Cytonn Asset Managers |
757.8 |
1.0% |
951.6 |
1.1% |
25.6% |
|
14 |
Amana Capital |
597.2 |
0.8% |
203.5 |
0.2% |
(65.9%) |
|
15 |
Apollo Asset Managers |
471.5 |
0.6% |
498.4 |
0.6% |
5.7% |
|
16 |
Genghis Capital |
458.9 |
0.6% |
655.4 |
0.7% |
42.8% |
|
17 |
Equity Investment Bank |
397.1 |
0.5% |
329.7 |
0.4% |
(17.0%) |
|
18 |
Alpha Africa Asset Managers |
143.4 |
0.19% |
192.4 |
0.22% |
34.2% |
|
19 |
Co-op Trust Investment Services Limited |
10.8 |
0.0% |
1,156.4 |
1.3% |
10,568.3% |
|
20 |
Wanafunzi Investments |
0.0 |
0.0% |
0.2 |
0.0% |
343.1% |
|
|
Total |
76,509.8 |
100.0% |
88,095.1 |
100.0% |
15.1% |
Source: Capital Markets Authority: Collective Investments Scheme Quarterly Report
Key to note from the above table:
- Assets Under Management: CIC Asset Managers remained the largest overall Unit Trust Fund Manager with an AUM of Kshs 36.3 bn in Q2’2020, from an AUM of Kshs 29.7 bn as at Q1’2020 translating to a 21.9% AUM growth,
- Market Share: CIC Asset Managers remained the largest overall Unit Trust with a market share of 41.2%, an increase from 38.9% in Q1’2020. Key to note, CIC Asset Managers recorded the highest increase in its markets share with the market share increasing by 2.3% points, and,
- Growth: In terms of AUM growth, Co-op Trust Investments recorded the strongest growth of 10,568.3%, with its market share increasing to 1.31% from 0.01% in Q1’2020. Key to note, the decline in Stanlib’s AUM is mainly due to the Asset Manager’s exit in Kenya, which was effective June 2020. The fund manager attributed the exit to the significant operating losses incurred in both Kenya and Uganda.
Among unit trust products, Money Market Funds continued to be the most popular product in terms of market share, accounting for Kshs 78.9 bn equivalent to 89.6% of all the funds under management by Collective Investment Schemes for the quarter ended 30th June 2020, an increase from 88.0% in Q1’2020 as shown in the table below;
|
Assets Under Management (AUM) by Type of Collective Investment Scheme (All values in Kshs mns unless stated otherwise) |
||||||
|
No. |
Product |
Q1’2020 AUM |
Q2’2020 AUM |
Q1’2020 Market Share |
Q2’2020 Market Share |
Variance (% Points) |
|
1 |
Money Market Funds |
67,358.0 |
78,936.2 |
88.0% |
89.6% |
1.6% |
|
2 |
Equity Fund |
3,631.6 |
3,630.3 |
4.7% |
4.1% |
(0.6%) |
|
3 |
Balanced Fund |
1,166.5 |
1,245.6 |
1.5% |
1.4% |
(0.1%) |
|
4 |
Others |
4,188.2 |
4283.0 |
5.7% |
4.9% |
(0.8%) |
|
|
Total |
76,344.3 |
88,095.1 |
100.0% |
100.0% |
|
Source: Capital Markets Authority: Collective Investments Scheme Quarterly Report
Key take-outs from the above table include:
- Money Market Funds recorded a 1.6% growth in the Assets under Management, and consequently, their market share rose to 89.6% from 88.0% recorded in Q1’2020, driven by local investors’ preference for capital preservation during the period of review defined by high volatility in the equities market. Risk averse investors invest in Money Market Funds in times of high stock market volatility. While Equity Funds have the potential to outperform and deliver better returns than Money Market Funds over the medium to long-term, preservation of capital in Money Market Funds is the main contributory factor for its popularity in Kenya,
- Equity Fund recorded a 0.6% points decline in its market share to 4.1% from 4.7% recorded in Q1’2020 partly attributable to increased capital flight by investors from the fund as they seek for safe havens as well as the downward trend recorded in the equities market since the onset of the COVID-19 pandemic, which saw the Nairobi all share Index (NASI) shed by 17.3% in H1’2020,
- Balanced Funds, on the other hand, ranked third in comparison to other products, with a market share of 1.4% in Q2’2020 from 1.5% recorded in Q1’2020. Given that Balance Funds invest in both the Equities and the fixed income market, the declines recorded in the Equities market has contributed to the slight decline its market share, however, the declines recorded in the Equities Market have been mitigated by the gains recorded in Fixed Income Securities. Balanced Funds offer investors a reasonable level of current income and long-term capital growth, achieved by investing in a diversified spread of equities and fixed income securities. Having a medium risk profile, Balanced Funds carry a high potential for growth in the near future as they are suitable for pension schemes, treasury portfolios of institutional clients, co-operatives, and high-net-worth individuals amongst others, and,
- The Other Funds include Income Funds, Growth Funds, Wealth Funds, Diversified Funds, and Bond Funds.
Section II: Performance of Money Market Funds
Money Market Funds (MMFs) in the recent past have gained popularity in Kenya with their AUM growth outperforming the growth in bank deposits. One of the main reasons is the higher returns from money market funds compared to the returns on bank deposits. According to the Central Bank of Kenya data, the average deposit rate during the quarter declined to 6.9%, post the removal of the deposit rate cap floor in August 2018, from an average of 7.8% when the legislation was in place.
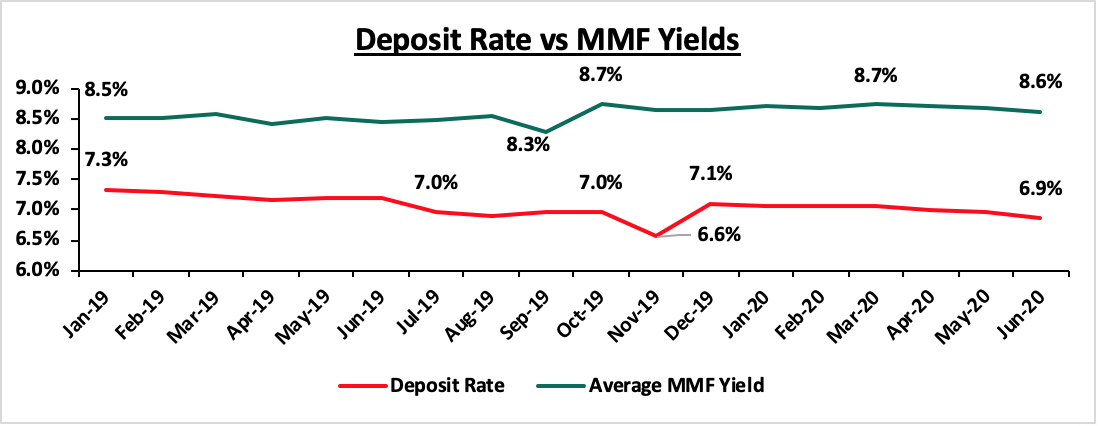
Source: CBK
As per the regulation, funds in MMFS’ are invested in liquid interest-bearing securities that have a weighted average maturity of less than 12-months. These securities include bank deposits, securities listed on NSE, and securities issued by the Government of Kenya. The allocation to these three asset classes in Q2’2020 was 35.2%, 7.9%, and 43.7% for bank deposits, securities listed on NSE, and securities issued by the Government of Kenya, respectively in Q2’2020. The Fund is best suited for investors who require a low-risk investment that offers capital stability, liquidity, and require high-income yield. The Fund is also a good safe haven for investors who wish to switch from a higher risk portfolio to a low risk portfolio, especially during times uncertainty.
- Top Five Money Market Funds by Assets Under Management
The total Assets Under Management in Money Market Funds grew by 17.2% to Kshs 78.9 bn in Q2’2020, from Kshs 65.7 bn in Q1’2020. The top five Money Market Funds control an AUM of Kshs 64.5 bn, which translates to 81.7% of the total AUM in Money Market Funds. The table below shows the top five Money Market Funds as at Q2’2020:
|
Top 5 Money Market Funds by Assets Under Management |
||||||
|
No. |
Fund Managers |
Q1’2020 Money Market Fund (Kshs Mns) |
Q2’2020 Money Market Fund (Kshs Mns) |
Q1’2020 Market Share |
Q2’2020 Market Share |
Variance (% Points) |
|
1. |
CIC Money Market Fund |
29,016.0 |
35,735.1 |
44.0% |
45.3% |
1.3% |
|
2. |
British-American Money Market Fund |
7,334.1 |
8,463.9 |
11.0% |
10.7% |
(0.3%) |
|
3. |
NCBA Money Market Fund |
6,446.2 |
8,240.8 |
9.8% |
10.4% |
0.6% |
|
4. |
ICEA Lion Money Market Fund |
6,800.2 |
7,424.1 |
10.3% |
9.4% |
(0.9%) |
|
5. |
Old Mutual Money Market Fund |
4,545.5 |
4,636.2 |
6.9% |
5.9% |
(1.0%) |
|
|
Total |
54,141.9 |
64,500.1 |
82.0% |
81.7% |
(0.3%) |
Source: Capital Markets Authority: Collective Investments Scheme Quarterly Report
- Top Five (5) Money Market Funds by Growth Rate
As at the end of Q2’2020, Co-op Money Market Fund recorded the fastest growth in Assets under Management (AUM) coming in at 21,890.3% to Kshs 1.2 bn, from Kshs 5.3 mn recorded in Q1’2020. The top five Money Market Funds in terms of growth rate recorded in Q2’2020 as highlighted below:
|
Top 5 Money Market Funds by Growth Rate |
||||
|
No. |
Fund Managers |
Q1’2020 AUM(Kshs Mns) |
Q2’2020 AUM(Kshs Mns) |
Q2’2020 Growth Rate |
|
1 |
Co-op Money Market Fund |
5.3 |
1,156.4 |
21,890.3% |
|
2 |
Sanlam Money Market Fund |
2,700.2 |
4,292.7 |
59.0% |
|
3 |
GenCapHela Imara Money Market Fund |
434.0 |
623.6 |
43.7% |
|
4 |
Cytonn Money Market Fund |
588.6 |
776.7 |
31.9% |
|
5 |
NCBA Money Market Fund |
6,446.2 |
8,240.8 |
27.8% |
Source: Capital Markets Authority: Collective Investments Scheme Quarterly Report
- Top Five (5) Money Market Funds by Yields
During the period under review, the following Money Market Funds had the highest average effective annual yield declared, with the Cytonn Money Market Fund having the highest effective annual yield at 10.8% against the industrial average of 8.7%.
|
Top 5 Money Market Funds by Yield in Q2’2020 |
||
|
Rank |
Money Market Funds |
Effective Annual Rate (Average Q2’2020) |
|
1 |
Cytonn Money Market Fund |
10.8% |
|
2 |
Zimele Money Market Fund |
9.9% |
|
3 |
Alphafrica Kaisha Money Market Fund |
9.8% |
|
3 |
Nabo Africa Money Market Fund |
9.8% |
|
4 |
CIC Money Market Fund |
9.6% |
|
|
Industrial Average |
8.7% |
Section III: Comparing Unit Trust Funds AUM Growth with Bank Deposits Growth
Unit Trust Funds assets recorded a growth of 15.1% in Q2’2020, compared to a growth of 1.1% in Q1’2020, while the listed bank deposits grew by 18.5% in Q2’2020 compared to a growth of 14.3% recorded in Q1’2020.
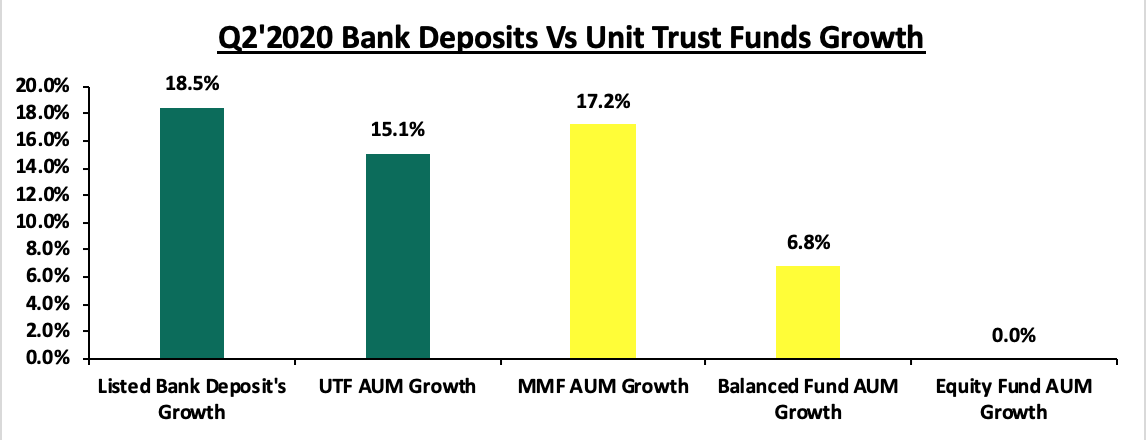
Key take-outs from the graph include:
- Bank deposit growth at 18.5% outpaced UTFs growth of 15.1%, and save for the year 2019, bank deposit growth usually outpace UTFs growth, an indication that our capital markets potential and growth remains constrained, and,
- Money Market Funds grew at a rate of 17.2%, faster than the other UTFs but slightly slower than the listed bank deposits, attributable to the funds affordability in its initial and additional investment requirements, its high liquidity as well as the daily compounding of interest. While initial deposit and additional investments may vary depending on the fund, Money Market Funds present a low risk, affordable and high-yielding investment opportunity for investors and capital preservation, a key feature of MMFs.
Kenya’s Mutual Funds / UTFs to GDP ratio at 5.4% is still very low compared to global average of 61.8%, showing that we improve and enhance our capital markets.
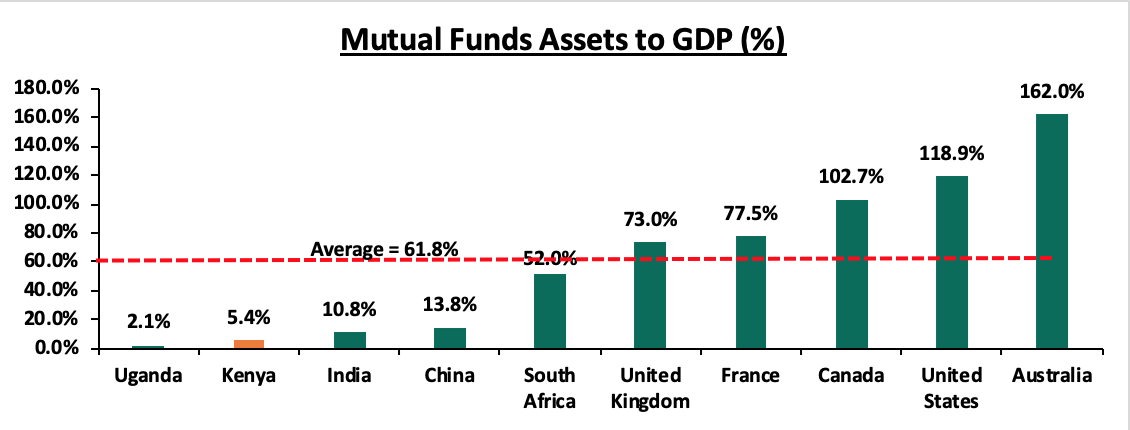
Source: World Bank Data
According to World Bank data, in well-functioning economies, businesses rely on banks for just 40.0% of their funding with the larger percentage of 60.0% coming from Capital Markets. However, in Kenya businesses rely on banks for a staggering 99.0% of their funding; with less than 1.0% coming from Capital Markets. In order to improve our Capital Markets and stimulate its growth, we recommend the following actions:
- Expand eligibility of Trustees of Unit Trust Funds to include non-bank Trustees such as Corporate Trustees. The current situation where all Trustees are banks, severely constrains capital market growth because of;
- The inherent conflict of interest where banks are Trustees in a market where they are also competing for funds, and,
- Banks are not best suited to be Trustees in complex financial products, hence this restrains the market to plain vanilla investments such as bank deposits and government debt,
- Remove conflicts of interest in the governance of capital markets and create a governance structure that is more responsive to market participants and market growth,
- Improve fund transparency to provide investors with more information. Each Unit Trust Fund should be required to publish their portfolio holdings on a quarterly basis. Q3’2020 saw investors in Amana Capital, whose funds had been frozen for the past 2 years, receive a 59.0% impairment on their investments following the losses incurred from investing in the Nakumatt commercial paper, yet they were not aware that their funds had been invested in the Commercial Paper,
- Allow for sector funds: The current capital markets regulations require that funds must diversify. Consequently, one has to seek special dispensation in form sector funds such as a financial services fund, a technology fund or a real estate UTF fund. Regulations allowing unit holders to invest in sector funds would expand the scope of unit holders interested in investing, and,
- Reduce the minimum investments to reasonable amounts: Sector funds, in addition to cumbersome incorporate as mentioned above, have high minimums of Kshs 1,000,000, which is way above the median wage of Kshs 50,000. Having sector funds minimum that is 20 times the national income seems unreasonably high.
Section IV: Conclusion
In conclusion, Money Market Funds continue to lead among unit trust products accounting for 89.6% of the total Unit Trust Funds in Q2’2020. For continued growth, there is a need to leverage more on innovation and digitization in order to further propel the growth of MMFs in Kenya. For instance, China’s first online money market fund known as Yu’eBao that has explosively grown into one of the world’s largest MMF with an AUM of USD 185.2 bn as at 30th June 2020, despite being launched in 2013. Yu’eBao of Tianhong Asset Management was launched as a spare cash management platform, allowing users to transfer idle cash as low as USD 0.15 (Kshs 15.6) into the money market fund, with the use of the Alipay e-wallet. The use of technology as a distribution channel for mutual fund products opened up the fund manager to the retail segment, which is characterized by strong demand among retail clients for convenient and innovative products. The advent of digitization and automation within the industry has enhanced liquidity. Closer home, Cytonn Money Market Fund clients can issue withdrawal instructions and have funds remitted to their bank accounts within 2 – 4 working days while funds withdrawn through the USSD or digital platforms are remitted to their M-Pesa and Bank accounts within 5 minutes and 2 working days respectively; the Cytonn Money Market Fund is accessible through dialing *809#. As highlighted in our topical Potential Effects of COVID-19 on Money Market Funds, we believe that amidst the Coronavirus pandemic, returns for Money Market Funds will remain stable with a bias to a slight increase upwards should rates on government securities increase. They will also remain the most liquid of all mutual funds providing a short-term parking bay that earns higher income yields compared to deposits and savings accounts.
Disclaimer: The views expressed in this publication are those of the writers where particulars are not warranted. This publication, which is in compliance with Section 2 of the Capital Markets Authority Act Cap 485A, is meant for general information only and is not a warranty, representation, advice or solicitation of any nature. Readers are advised in all circumstances to seek the advice of a registered investment advisor.


